4459
Predicting tumor recurrence in patients with gliomas via deep learning-based analysis of structural and amide proton transfer weighted MRI1Department of Radiology, Johns Hopkins University, Baltimore, MD, United States, 2Whiting School of Engineering, Johns Hopkins University, Baltimore, MD, United States, 3Department of Pathology, Johns Hopkins University, Baltimore, MD, United States, 4Department of Neurosurgery, Johns Hopkins University, Baltimore, MD, United States, 5Department of Neurology, Johns Hopkins University, Baltimore, MD, United States, 6F.M. Kirby Research Center for Functional Brain Imaging, Kennedy Krieger Institute, Baltimore, MD, United States
Synopsis
Amide protein transfer weighted (APTw) MRI has been validated to accurately detect recurrent malignant gliomas across different studies. However, APTw image interpretation is time consuming and requires professional knowledge. Therefore, reliable, automated imaging diagnostic tools to assess malignant glioma response to therapies are urgently needed. Here, we develop and verify a CNN-based deep-learning algorithm to identify tumor progression versus response by adding APTw MRI data to structural MR images as the proposed model input. Our results suggest that the use of APTw images can increase the diagnostic accuracy to structural MRI for the treatment response assessment.
Purpose
Amide proton transfer-weighted (APTw) imaging is a molecular MRI technique based on the chemical exchange saturation transfer (CEST) MRI contrast mechanism that is able to detect endogenous cellular proteins and peptides in tissue. Several research groups have confirmed that hyperintensity on APTw images is a reliable imaging marker of recurrent malignant glioma 1-6. However, APTw image interpretation is time consuming and requires professional knowledge and automated reliable analysis would be important for its general accessibility in the clinic. Advances in artificial intelligence and computer vision have achieved powerful solutions for improving medical imaging techniques and automatic diagnosis 7-10. Here, we developed and verified a CNN-based deep-learning algorithm to identify tumor recurrence through a cross-sectional, multi-modal MRI exam. The goal was to evaluate the power of APTw images in the deep-learning algorithm for classification of treatment effect and tumor recurrence in post treatment malignant gliomas.Methods
PatientsA total of 145 MR scans from 98 malignant glioma patients were re-assessed. Each patient had all study-related MRI data after their standard chemoradiation regimen completion. Each slice was annotated as “response" to treatment or “progressive disease", according to the RANO criteria for 2D images for each instance11. Thus, one instance includes a set of APTw, T1w, T2w, FLAIR, and gadolinium contrast-enhanced T1w (T1wGd) MR images acquired at the same slice level. For the scan-level classification, scans with one or more slices of “progressive disease” were assigned as “progression", and all other scans assigned as “response”.
MRI protocol
All patients were scanned on a Philips 3T Achieva MRI system. The sequences performed for each patient included T1w, T2w, FLAIR, APTw, and T1wGd. A 3D imaging acquisition scheme was used for volumetric APTw imaging.6 APTw images were calculated using the magnetization transfer ratio asymmetry at 3.5ppm offset from the water frequency. T1w, T2w, FLAIR, T1wGd and APTw MRI were resampled and co-registered. Normalization, bias correction, and skull-stripping were applied.
Deep-learning Classification Pipeline
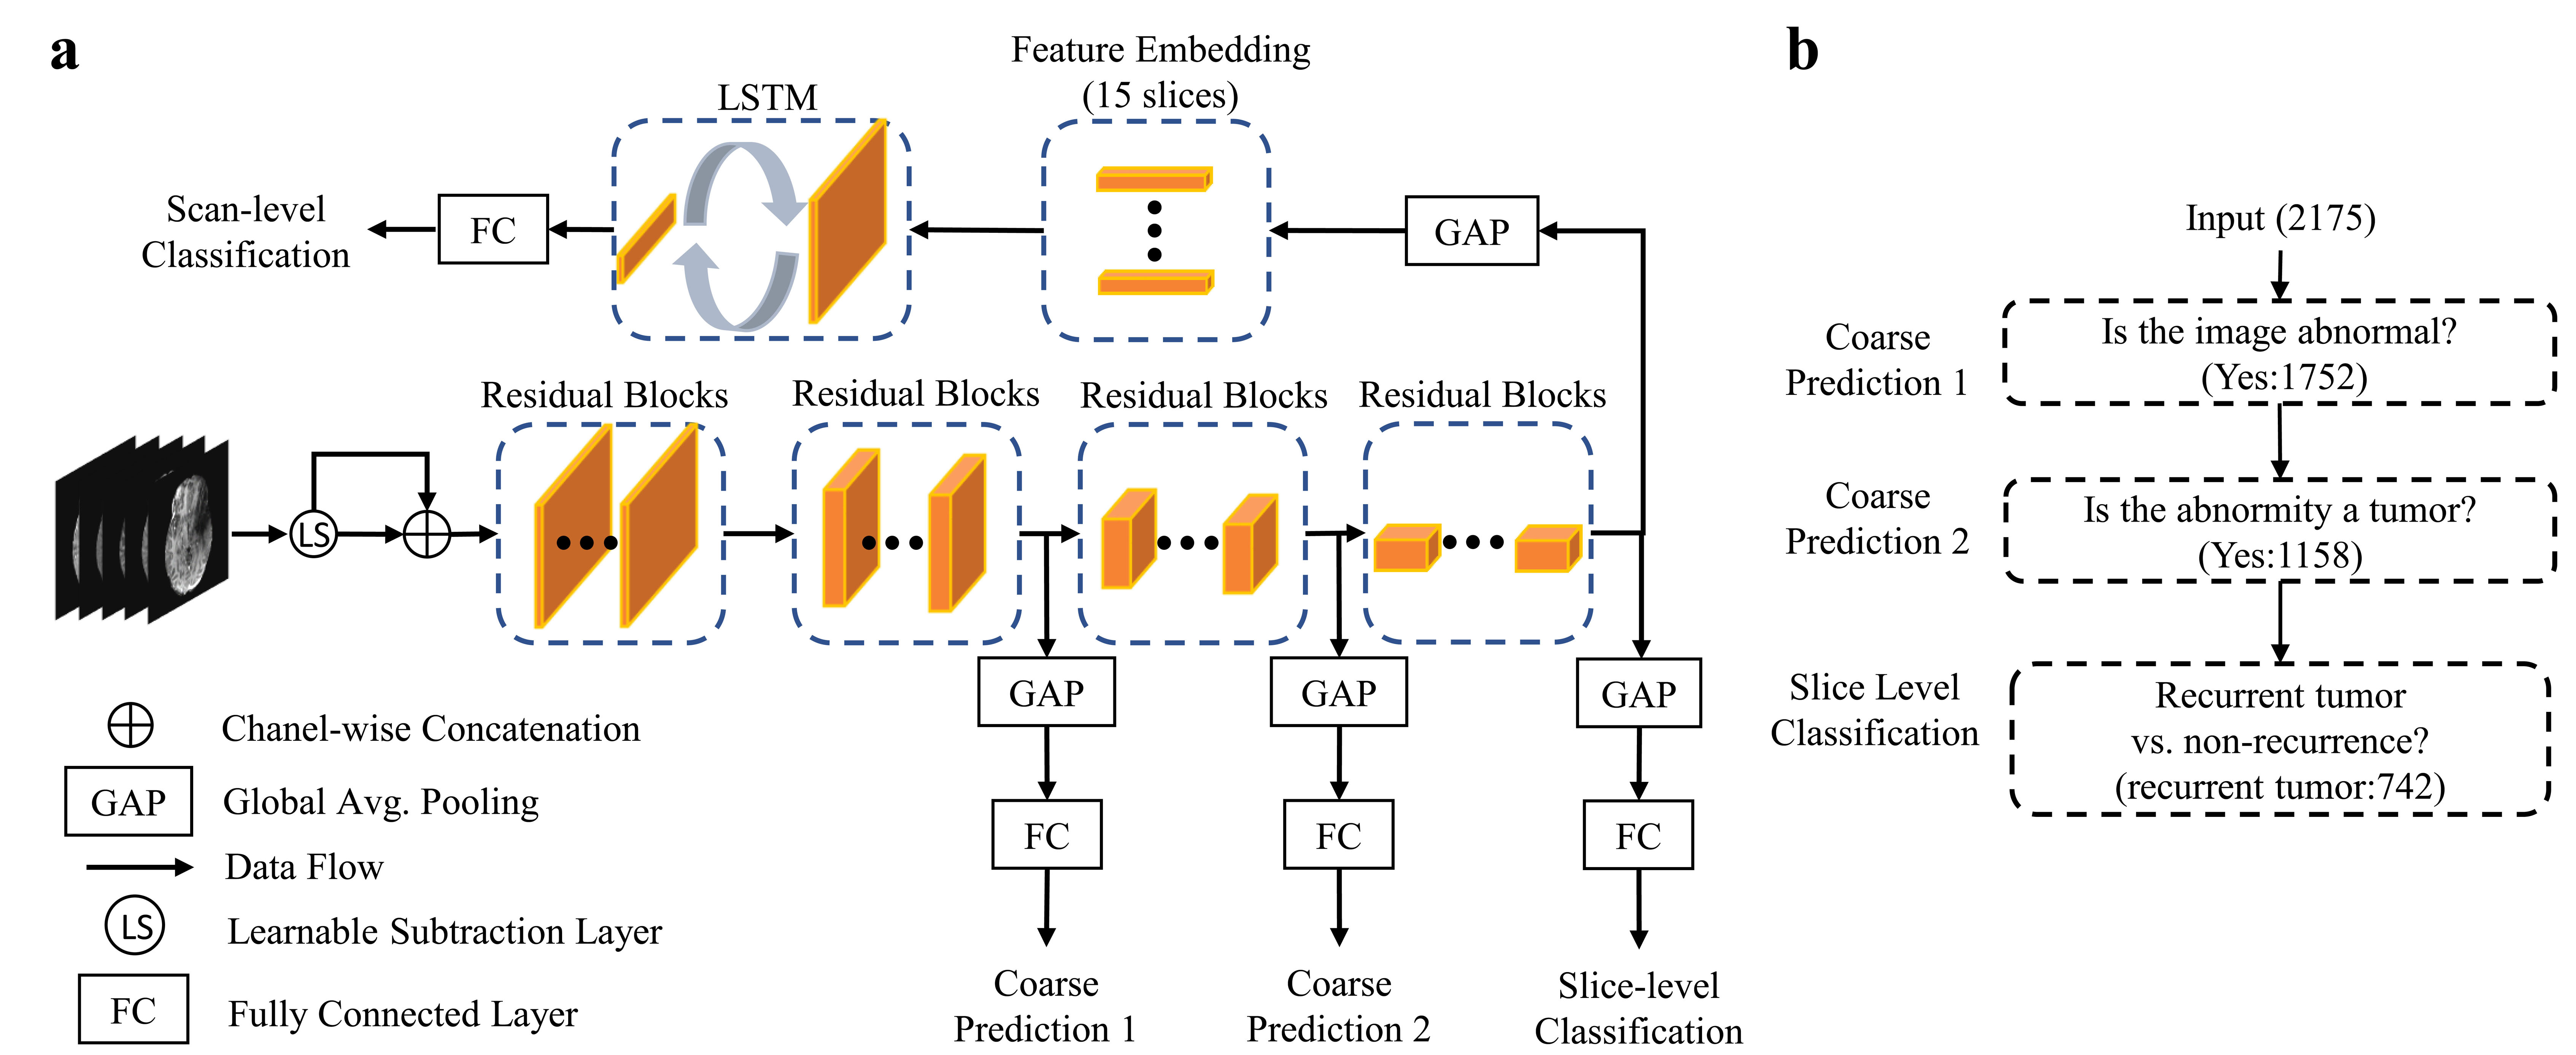
The CNN was built on the ResNet-18 backbone12 (baseline model) and trained using a hierarchical classification paradigm (HC). Addition of a learnable subtraction module (LS) to the CNN was also proposed. We then used a long short-term memory (LSTM) module taking embedded feature representations of all slices of a patient as input to produce scan-level prediction. Fig. 1 presents the overview of the proposed tumor recurrence classification framework. To further assess the added value of APTw images, we separated our experiments into two main groups: without APTw (only anatomical MRIs as input) and with APTw (both anatomical and APTw MRIs). The whole dataset was split into 70%, 10%, and 20% for training, validation, and testing datasets in a chronological order (the MRI acquisition date). The sensitivity, specificity and AUC were evaluated for both instances (slice-level) and patients.
Results
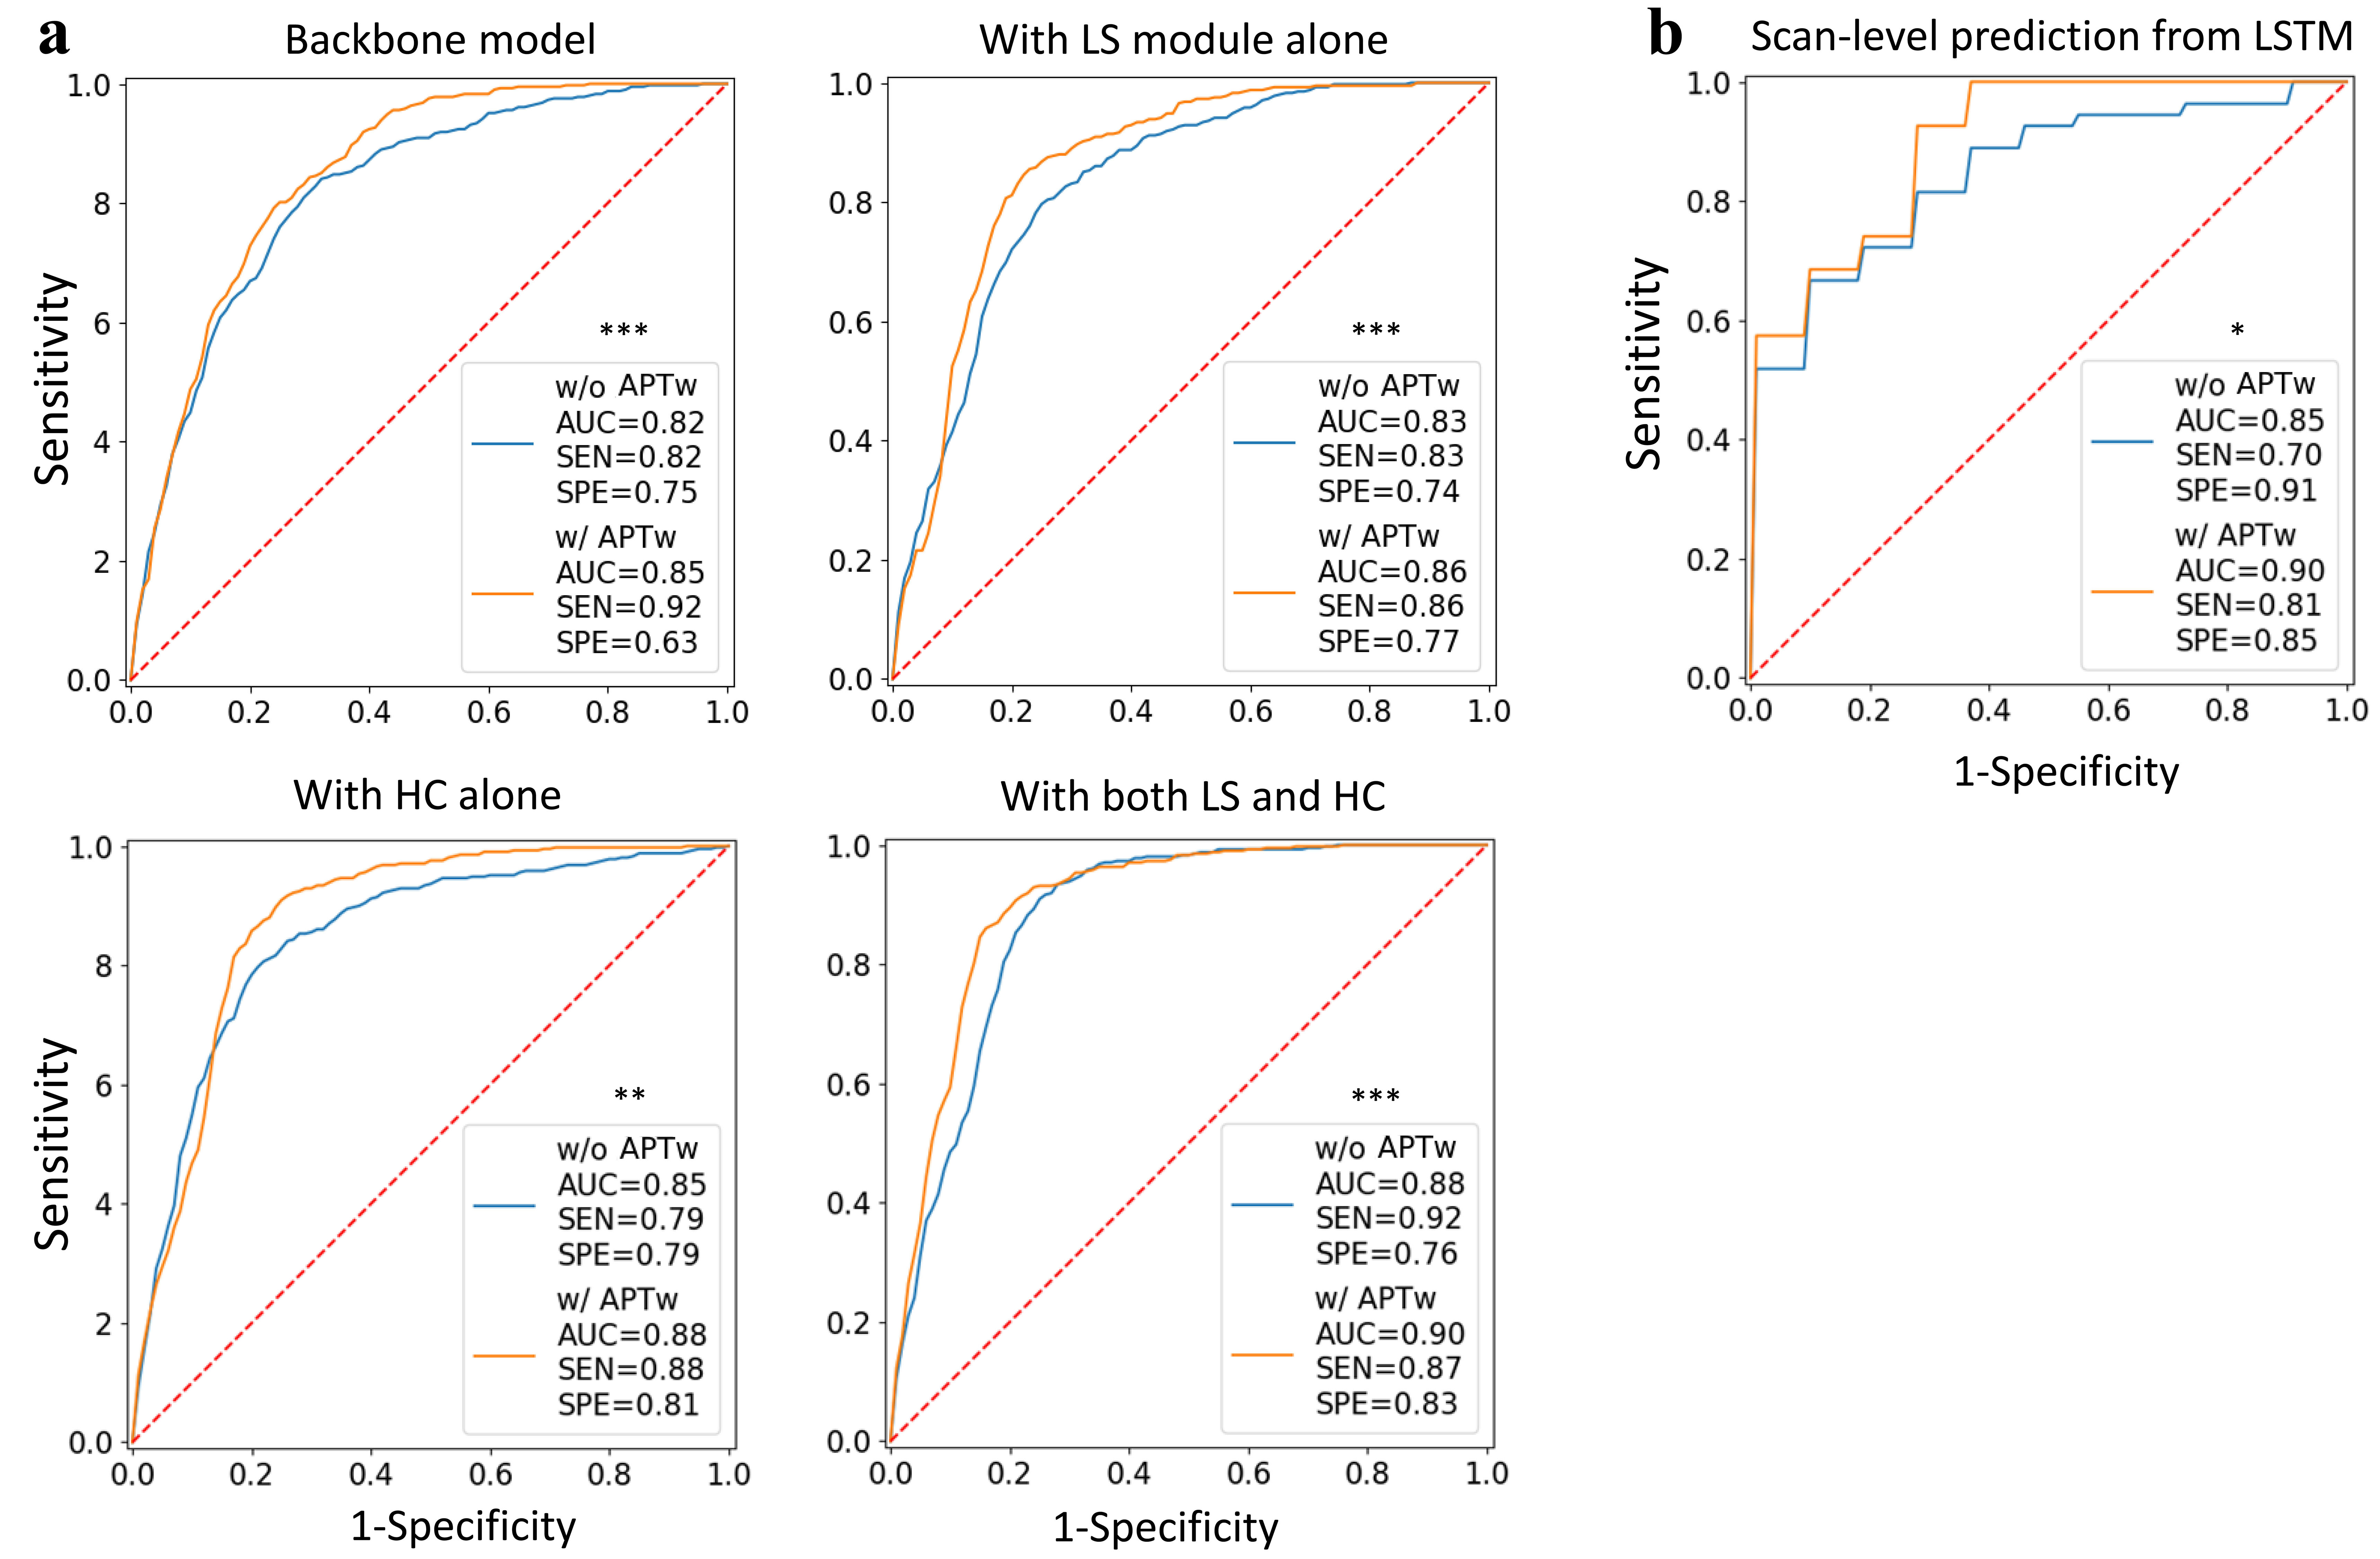
For slice-level analysis, compared with the baseline, using LS and HC, separately and jointly, could improve the classification performances of the two groups of modules with or without APTw images (Fig. 2). Interestingly, adding either HC or LS especially increased specificity. The best performance was achieved by the model with LS and HC in the group taking both anatomical sequences and APTw as input (AUC, 0.90; sensitivity, 0.87; specificity, 0.83). For scan-level diagnosis, the AUCs for the identification of tumor progression versus response were 0.85 (sensitivity, 0.70; specificity, 0.91) and 0.90 (sensitivity, 0.81; specificity, 0.85) for input without and with APTw images, respectively (Fig. 2). A significant added value of APTw images over structural MRIs was also observed in the scan-level classifier (P < 0.05). In this study, pairs of models using data with and without APTw MRI were compared to explore the added value of APTw MRI to structural MRIs. Our data show that APTw MRI improves the diagnostic performance for both slice-level and scan-level classifications.Discussion
Our proposed approach has the following advantages. 1) The learnable-parameter-adjusted image subtraction derived from the proposed LS demonstrated more discriminative features, thus improving the classification performance both with and without APTw data. 2) we introduced the HC paradigm to the CNN by decomposing the final task into three hierarchic subtasks. The shallower layers in the CNN can provide hierarchical priors for the subsequent deeper layers, thus serving as an extra supervised guidance on the intermediate layers. 3) we proposed a set of data from the five MRI sequences as a spatial sequence input for the scan-level classification framework. This LSTM model could thus incorporate the entire information via 75 MR slices (15 instances × 5 MR sequences) affiliated with a scan for the scan-level classification.Conclusion
The proposed CNN models utilizing multiparameter MRIs show promise in the distinction between tumor progression and response after treatment for people with malignant glioma. The AUCs of our best-performing models were 0.90 for both slice-level and scan-level classifications. Based on this performance, the proposed method could be a highly efficient solution that could help clinical experts to make precise diagnoses for patients with post-treatment malignant gliomas.Acknowledgements
This work was supported in part by grants from the National Institutes of Health (R01CA228188 and R37CA248077).References
1.Park YW, et al. Differentiation of recurrent diffuse glioma from treatment-induced change using amide proton transfer imaging: incremental value to diffusion and perfusion parameters. Neuroradiology 2020.
2. Park JE, et al. Identification of Early Response to Anti-Angiogenic Therapy in Recurrent Glioblastoma: Amide Proton Transfer–weighted and Perfusion-weighted MRI compared with Diffusion-weighted MRI. Radiology 2020;295(2):397-406. 3. Regnery S, et al. Chemical exchange saturation transfer MRI serves as predictor of early progression in glioblastoma patients. Oncotarget 2018; (9):28772-28783.
4. Sagiyama K, et al. In vivo chemical exchange saturation transfer imaging allows early detection of a therapeutic response in glioblastoma. Proc Natl Acad Sci USA. 2014;111(12): 4542–4547.
5. Paech D, et al. Relaxation-compensated amide proton transfer (APT) MRI signal intensity is associated with survival and progression in high-grade glioma patients. Eur Radiol. 2019 Sep;29(9):4957-4967.
6. Jiang S, et al. Identifying recurrent malignant glioma after treatment using amide proton transfer-weighted MR imaging: A validation study with image-guided stereotactic biopsy. Clin Cancer Res. 2019;25:552-561.
7. Eijgelaar RS, et al. Robust Deep Learning-based Segmentation of Glioblastoma on Routine Clinical MRI Scans Using Sparsified Training. Radiology Artificial intelligence 2020;2(5):e190103.
8. Cohen O, et al. Rapid and quantitative chemical exchange saturation transfer (CEST) imaging with magnetic resonance fingerprinting (MRF). Magn Reson Med 2018;80(6):2449-2463.
9. Glang F, et al. DeepCEST 3T: Robust MRI parameter determination and uncertainty quantification with neural networks-application to CEST imaging of the human brain at 3T. Magn Reson Med 2020;84(1):450-466.
10. Li M, et al. DC-AL GAN: Pseudoprogression and true tumor progression of glioblastoma multiform image classification based on DCGAN and AlexNet. Med Phys 2020;47(3):1139-1150.
11. Vogelbaum MA, et al. Application of novel response/progression measures for surgically delivered therapies for gliomas: Response assessment in neuro-oncology (RANO) working group. Neurosurgery 2012;70(1):234-243. 12. He K, et al. Deep residual learning for image recognition. Proceedings of the IEEE conference on computer vision and pattern recognition2016; p. 770-778.
Figures