4458
Differentiating Radiation Necrosis from Tumour Progression in Brain Metastases using CEST: A Cross-Vendor Comparison1Physical Sciences Platform, Sunnybrook Research Institute, Toronto, ON, Canada, 2Siemens Healthineers, Erlangen, Germany, 3Department of Radiation Oncology, Sunnybrook Health Sciences Centre, Toronto, ON, Canada, 4Department of Medical Imaging, Sunnybrook Health Sciences Centre, University of Toronto, Toronto, ON, Canada, 5Department of Medical Biophysics, University of Toronto, Toronto, ON, Canada, 6Department of Neurosurgery and Pediatric Neurosurgery, Medical University of Lublin, Lublin, Poland
Synopsis
Stereotactic radiosurgery for the treatment of brain metastases delivers a high dose of radiation with excellent local control, but increases the likelihood of radiation necrosis. CEST is a promising technique for distinguishing radiation necrosis from tumour progression in brain metastases, but its application has been limited to a single MRI system and CEST sequence. This study explores the use of scaling of the magnetization transfer ratio (MTR) by the white matter (WM) of each patient for comparison across vendors/sequences. It was found that the WM-scaled MTR showed improved correspondence across the MR systems, across two CEST sequences.
Introduction
Treatment of brain metastases with stereotactic radiosurgery (SRS), which involves delivering a high dose of radiation focally to the tumour [1–3], offers excellent local tumour control [4], but SRS increases the likelihood of radiation necrosis (reported in up to 22% of all patients [5–7]). Saturation transfer contrast including Chemical Exchange Saturation Transfer (CEST) [8,9] and relayed Nuclear Overhauser Effect (rNOE) [10] have been shown to differentiate radiation necrosis (RN) from tumour progression (TP) in brain metastasis patients with high accuracy [11,12] using Magnetization Transfer Ratio (MTR) acquired with high saturation amplitude (2 μT) for discrimination [12].However, brain metastasis studies for distinguishing RN from TP have been limited to a single-slice, single-vendor implementation of CEST [12]. Here, we investigated cross-vendor comparisons (between Philips and Siemens MR scanners). Scaling of the MTR by the contralateral normal-appearing white matter (WM) signal was explored for comparison across systems and CEST pulse sequences, and results were compared to unscaled MTR.
Methods
PatientsThe study was approved by the institutional research ethics board and informed consent was obtained. Seventy patients (75 lesions, 30 with TP) were scanned on a Philips scanner [11,12] and eight patients (10 lesions, 4 with TP) were scanned on a Siemens scanner including three of the same patients from the Philips cohort.
MRI acquisition
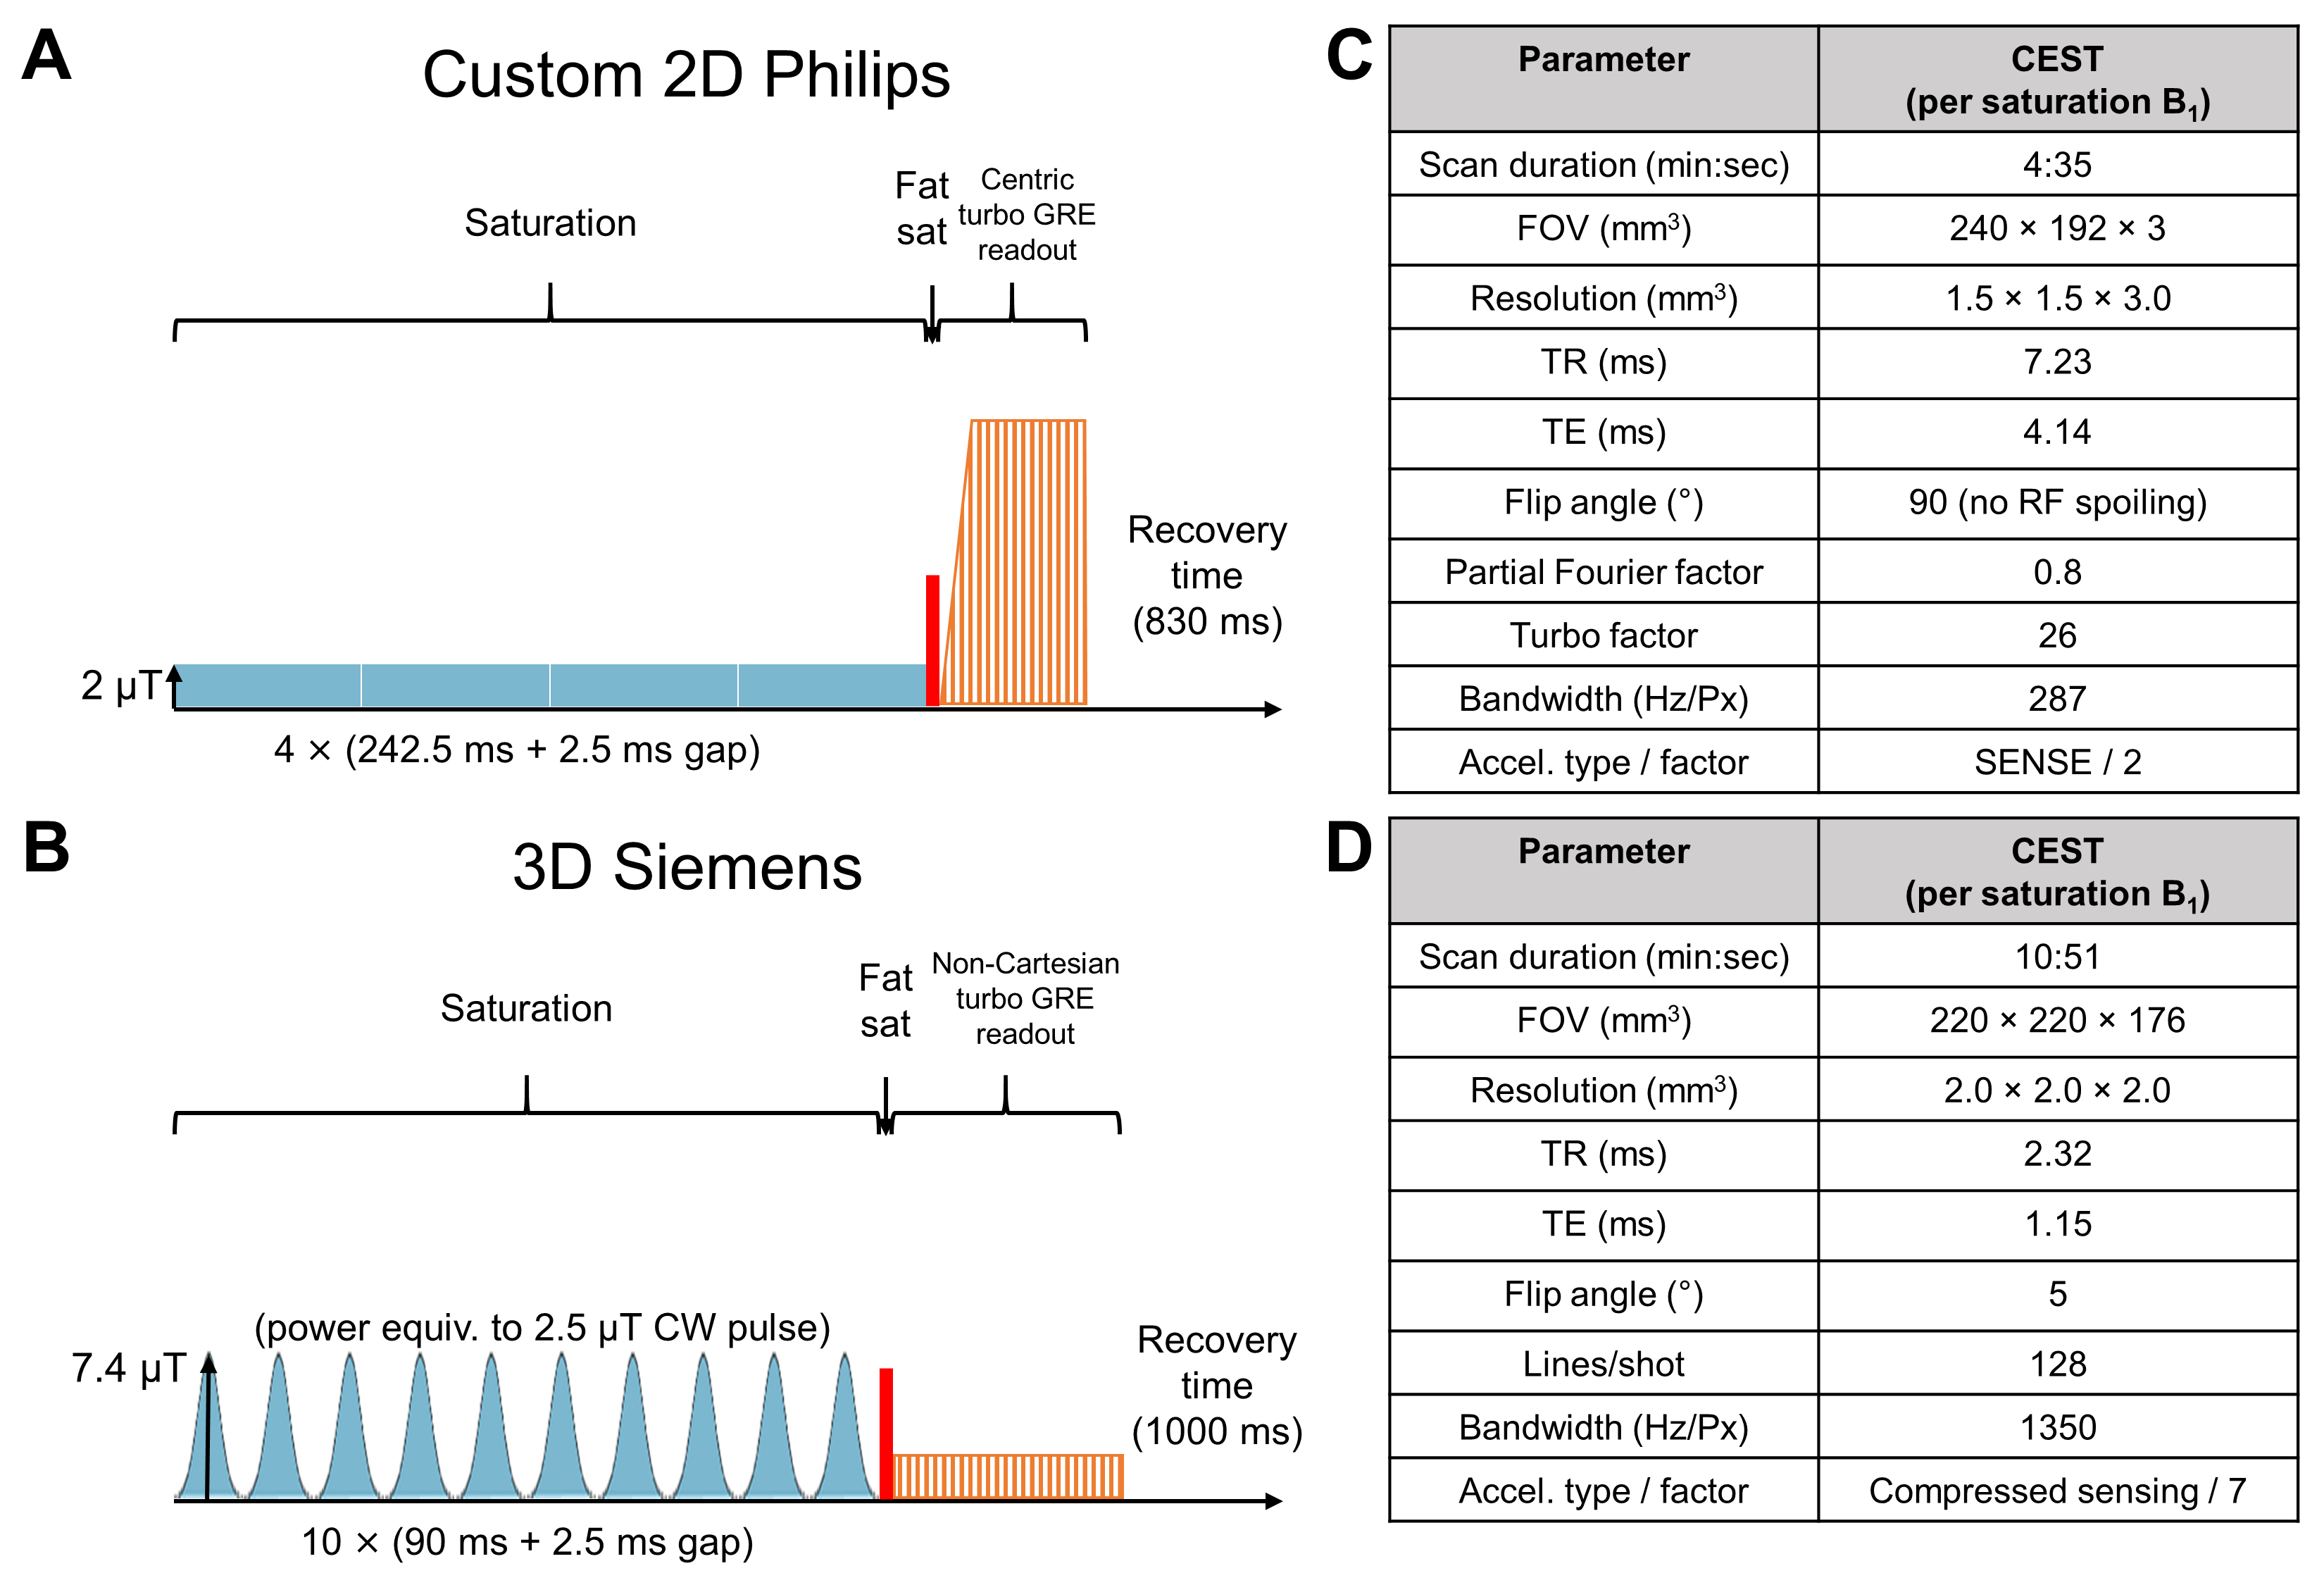
Philips (2D): Images were acquired on a 3T MR scanner (Achieva; Philips Healthcare, Best, The Netherlands). CEST Z-spectra were acquired with saturation amplitudes of B1=0.522 and 2 µT. The saturation pulse train consisted of four block pulses, each of 242.5 ms duration with 2.5 ms inter-pulse delay, acquired with 61 offsets between ±5.87 ppm and reference scans at –783 ppm.
Siemens (3D): At 3T (MAGNETOM Prisma; Siemens Healthineers, Erlangen, Germany), a prototype CEST sequence was used to acquire Z-spectra with continuous-wave power equivalent saturation B1 amplitudes of 0.625 and 2.5 µT. The saturation pulse train consisted of 10 Gaussian pulses, each of 90 ms duration with 2.5 ms inter-pulse delay, acquired with 27 offsets between ±6 ppm and reference scans at 783 ppm.
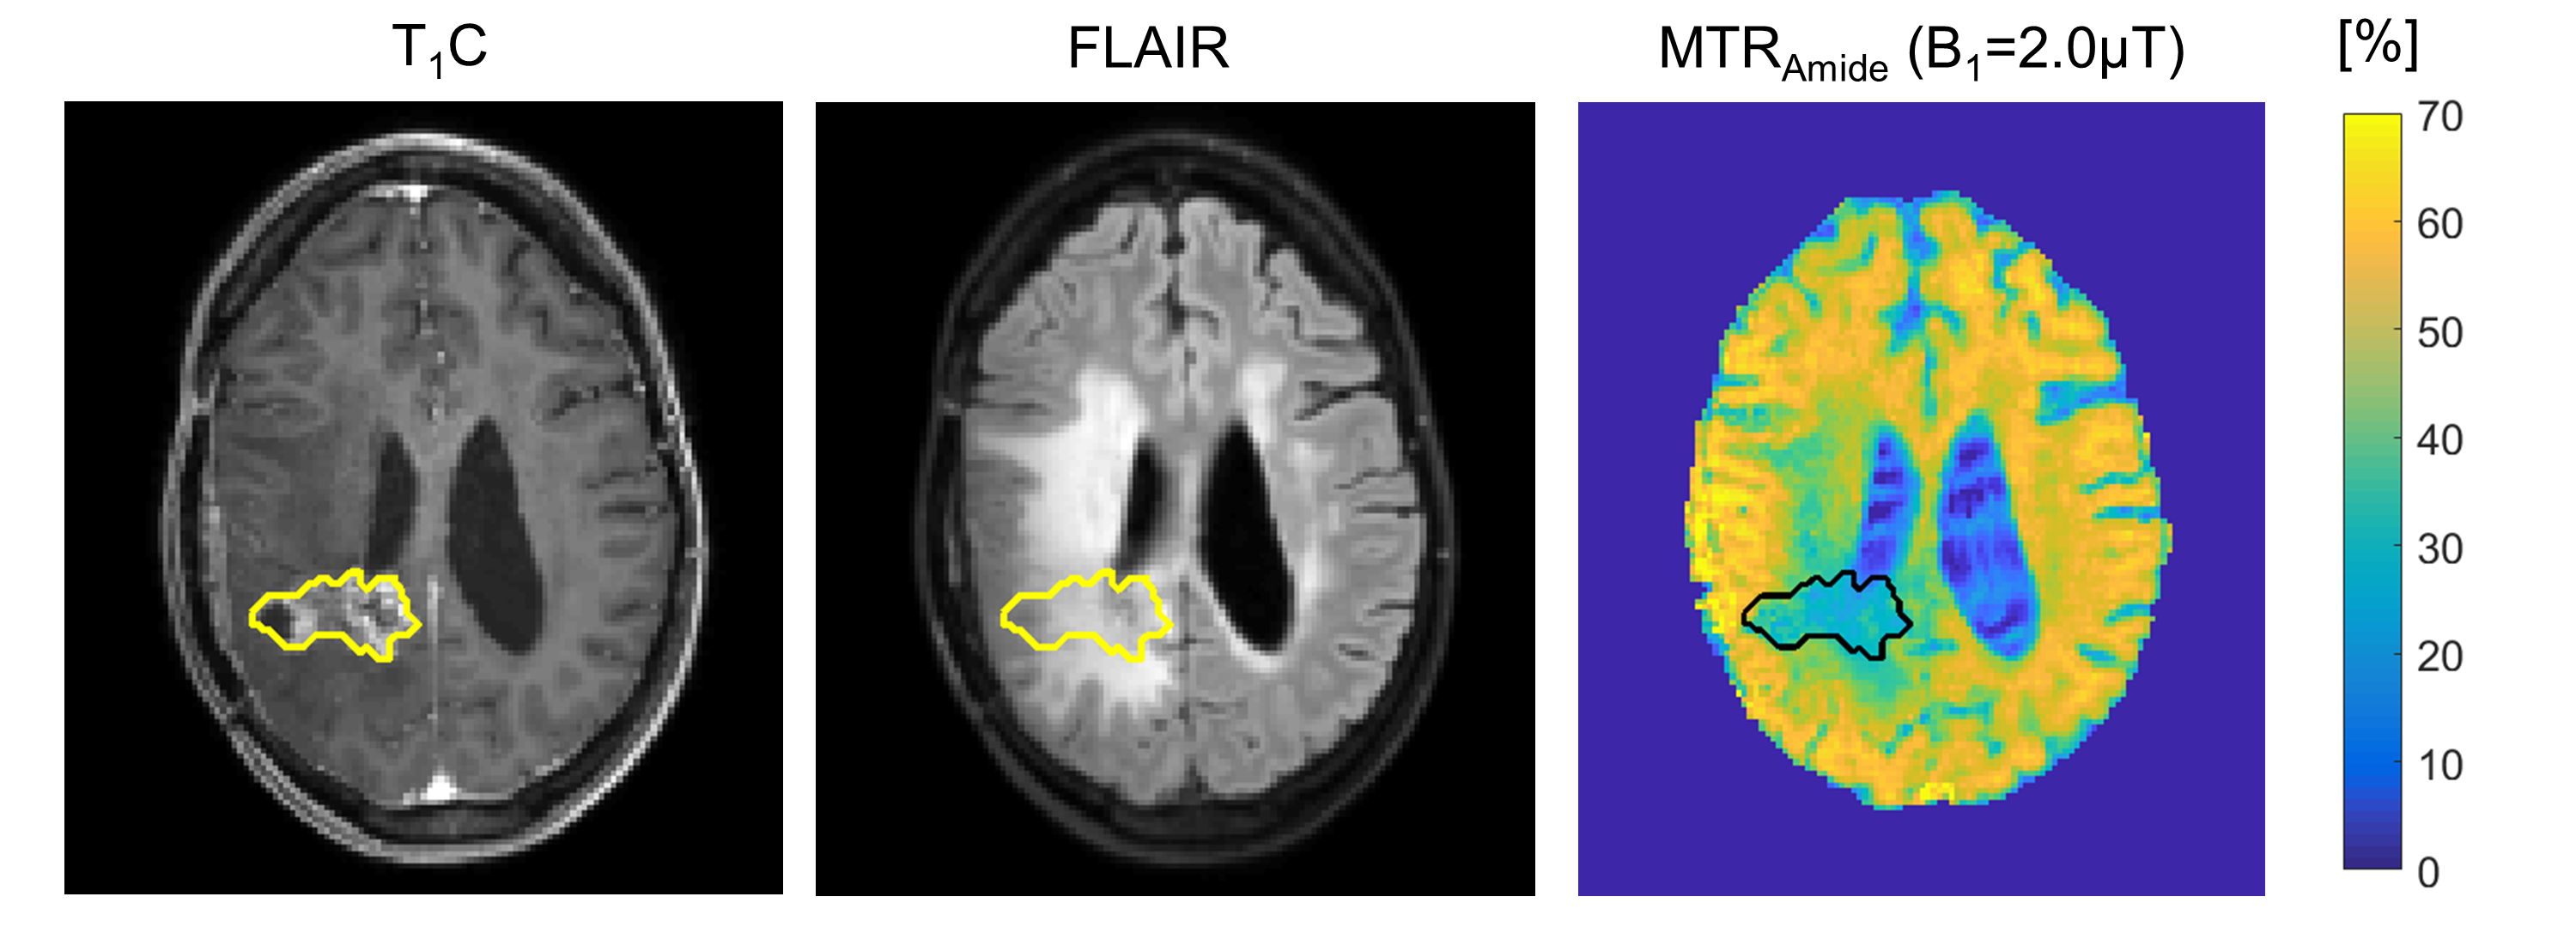
On both scanners, pre/post-contrast T1-weighted and FLAIR scans were acquired. B0, B1, T1, and T2 mapping were performed. RF pulse sequence diagrams and imaging parameters are summarized in Figure 1 with total acquisition durations of 45 min (Philips) and 51 min (Siemens). Example images are shown from the Philips scanner (Figure 2).
Image pre-processing and regions of interest (ROIs)
Brain extraction with HD-BET [13] was used for skull stripping prior to automatic whole-brain WM segmentation with FSL FAST [14], followed by manual selection of the contralateral WM. Contrast-enhanced T1-weighted (T1C) scans were registered to the CEST scan. Tumour ROIs were manually drawn over the enhancing regions, including any centrally hypo-intense regions. All MTR maps (for amide and rNOE at each B1) were normalized by the B1 scale map to account for RF inhomogeneity.
Comparisons between MR systems
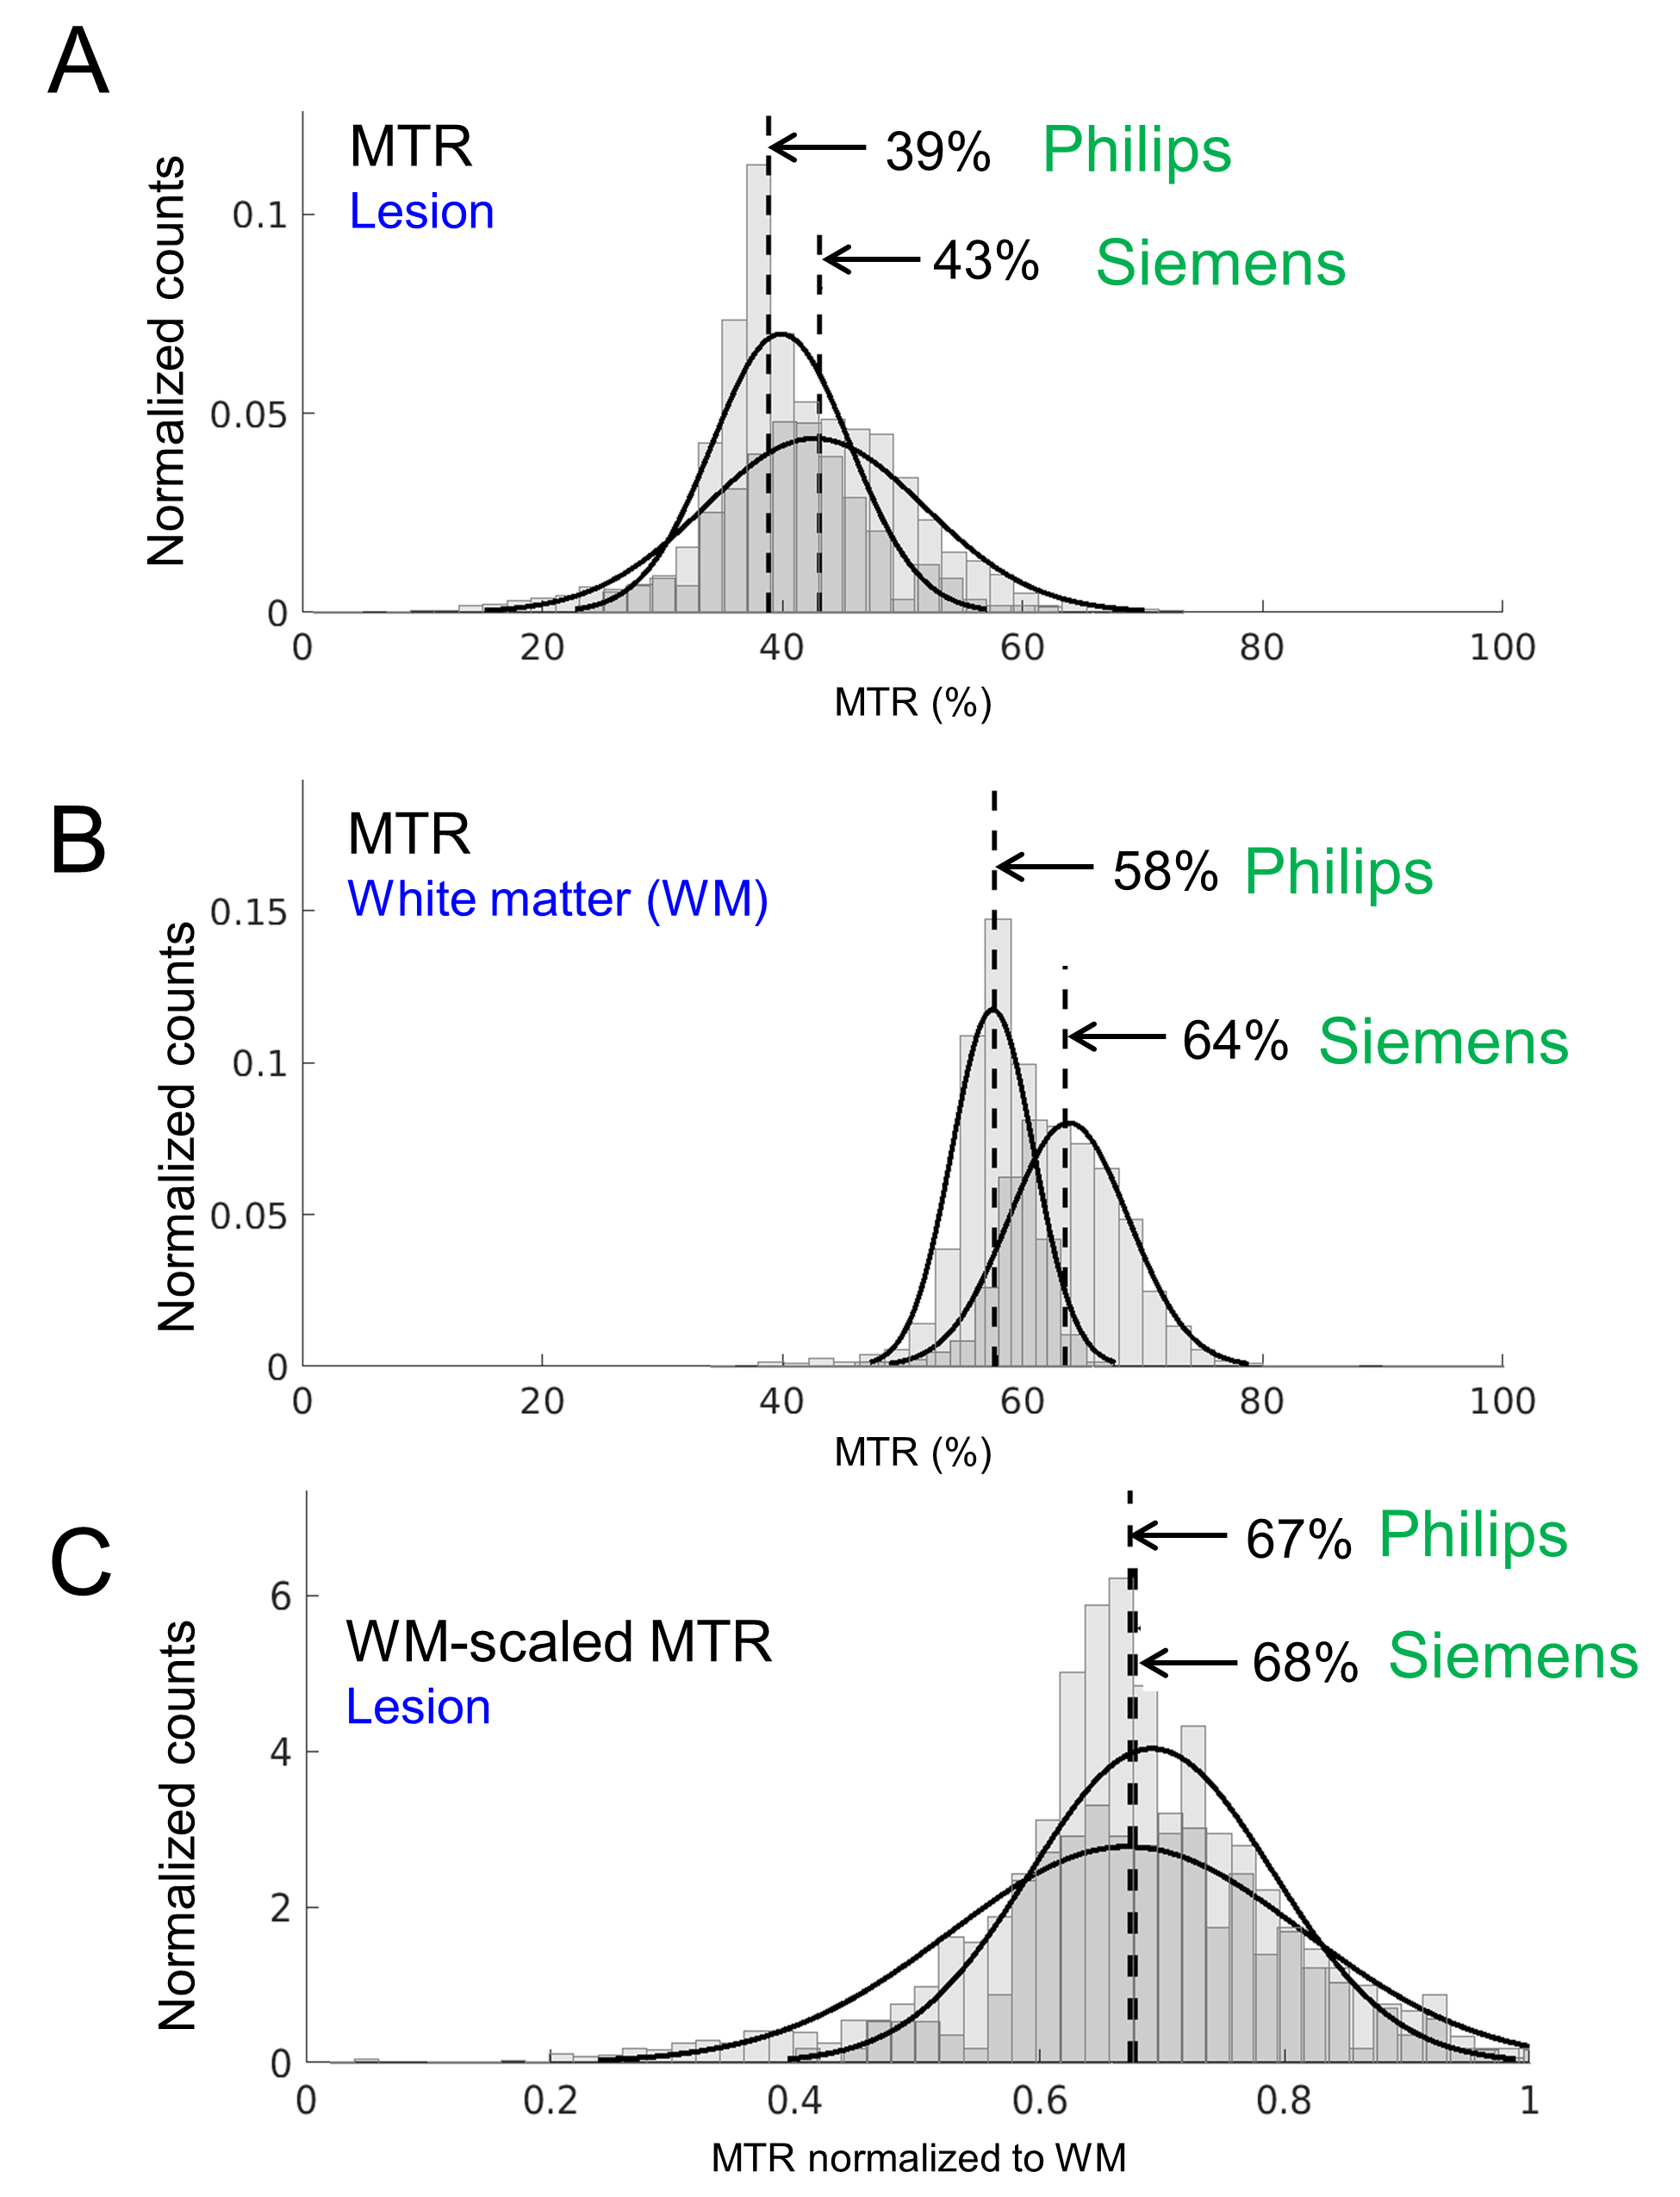
In all patients, histograms of the MTR voxel intensities over the lesions were compared between vendors. Figure 3A shows example histograms of the high B1 MTRAmide from both vendors of a lesion with RN. In this example, a discrepancy can be seen in the MTR values between the Siemens and Philips data. Next, MTR maps were scaled by the median WM MTR of the contralateral side. Example WM MTR histograms (Figure 3B) are shown. Resulting histograms from the WM-scaled lesion MTR maps (Figure 3C) showed improved correspondence of median MTR between scanners.
Results
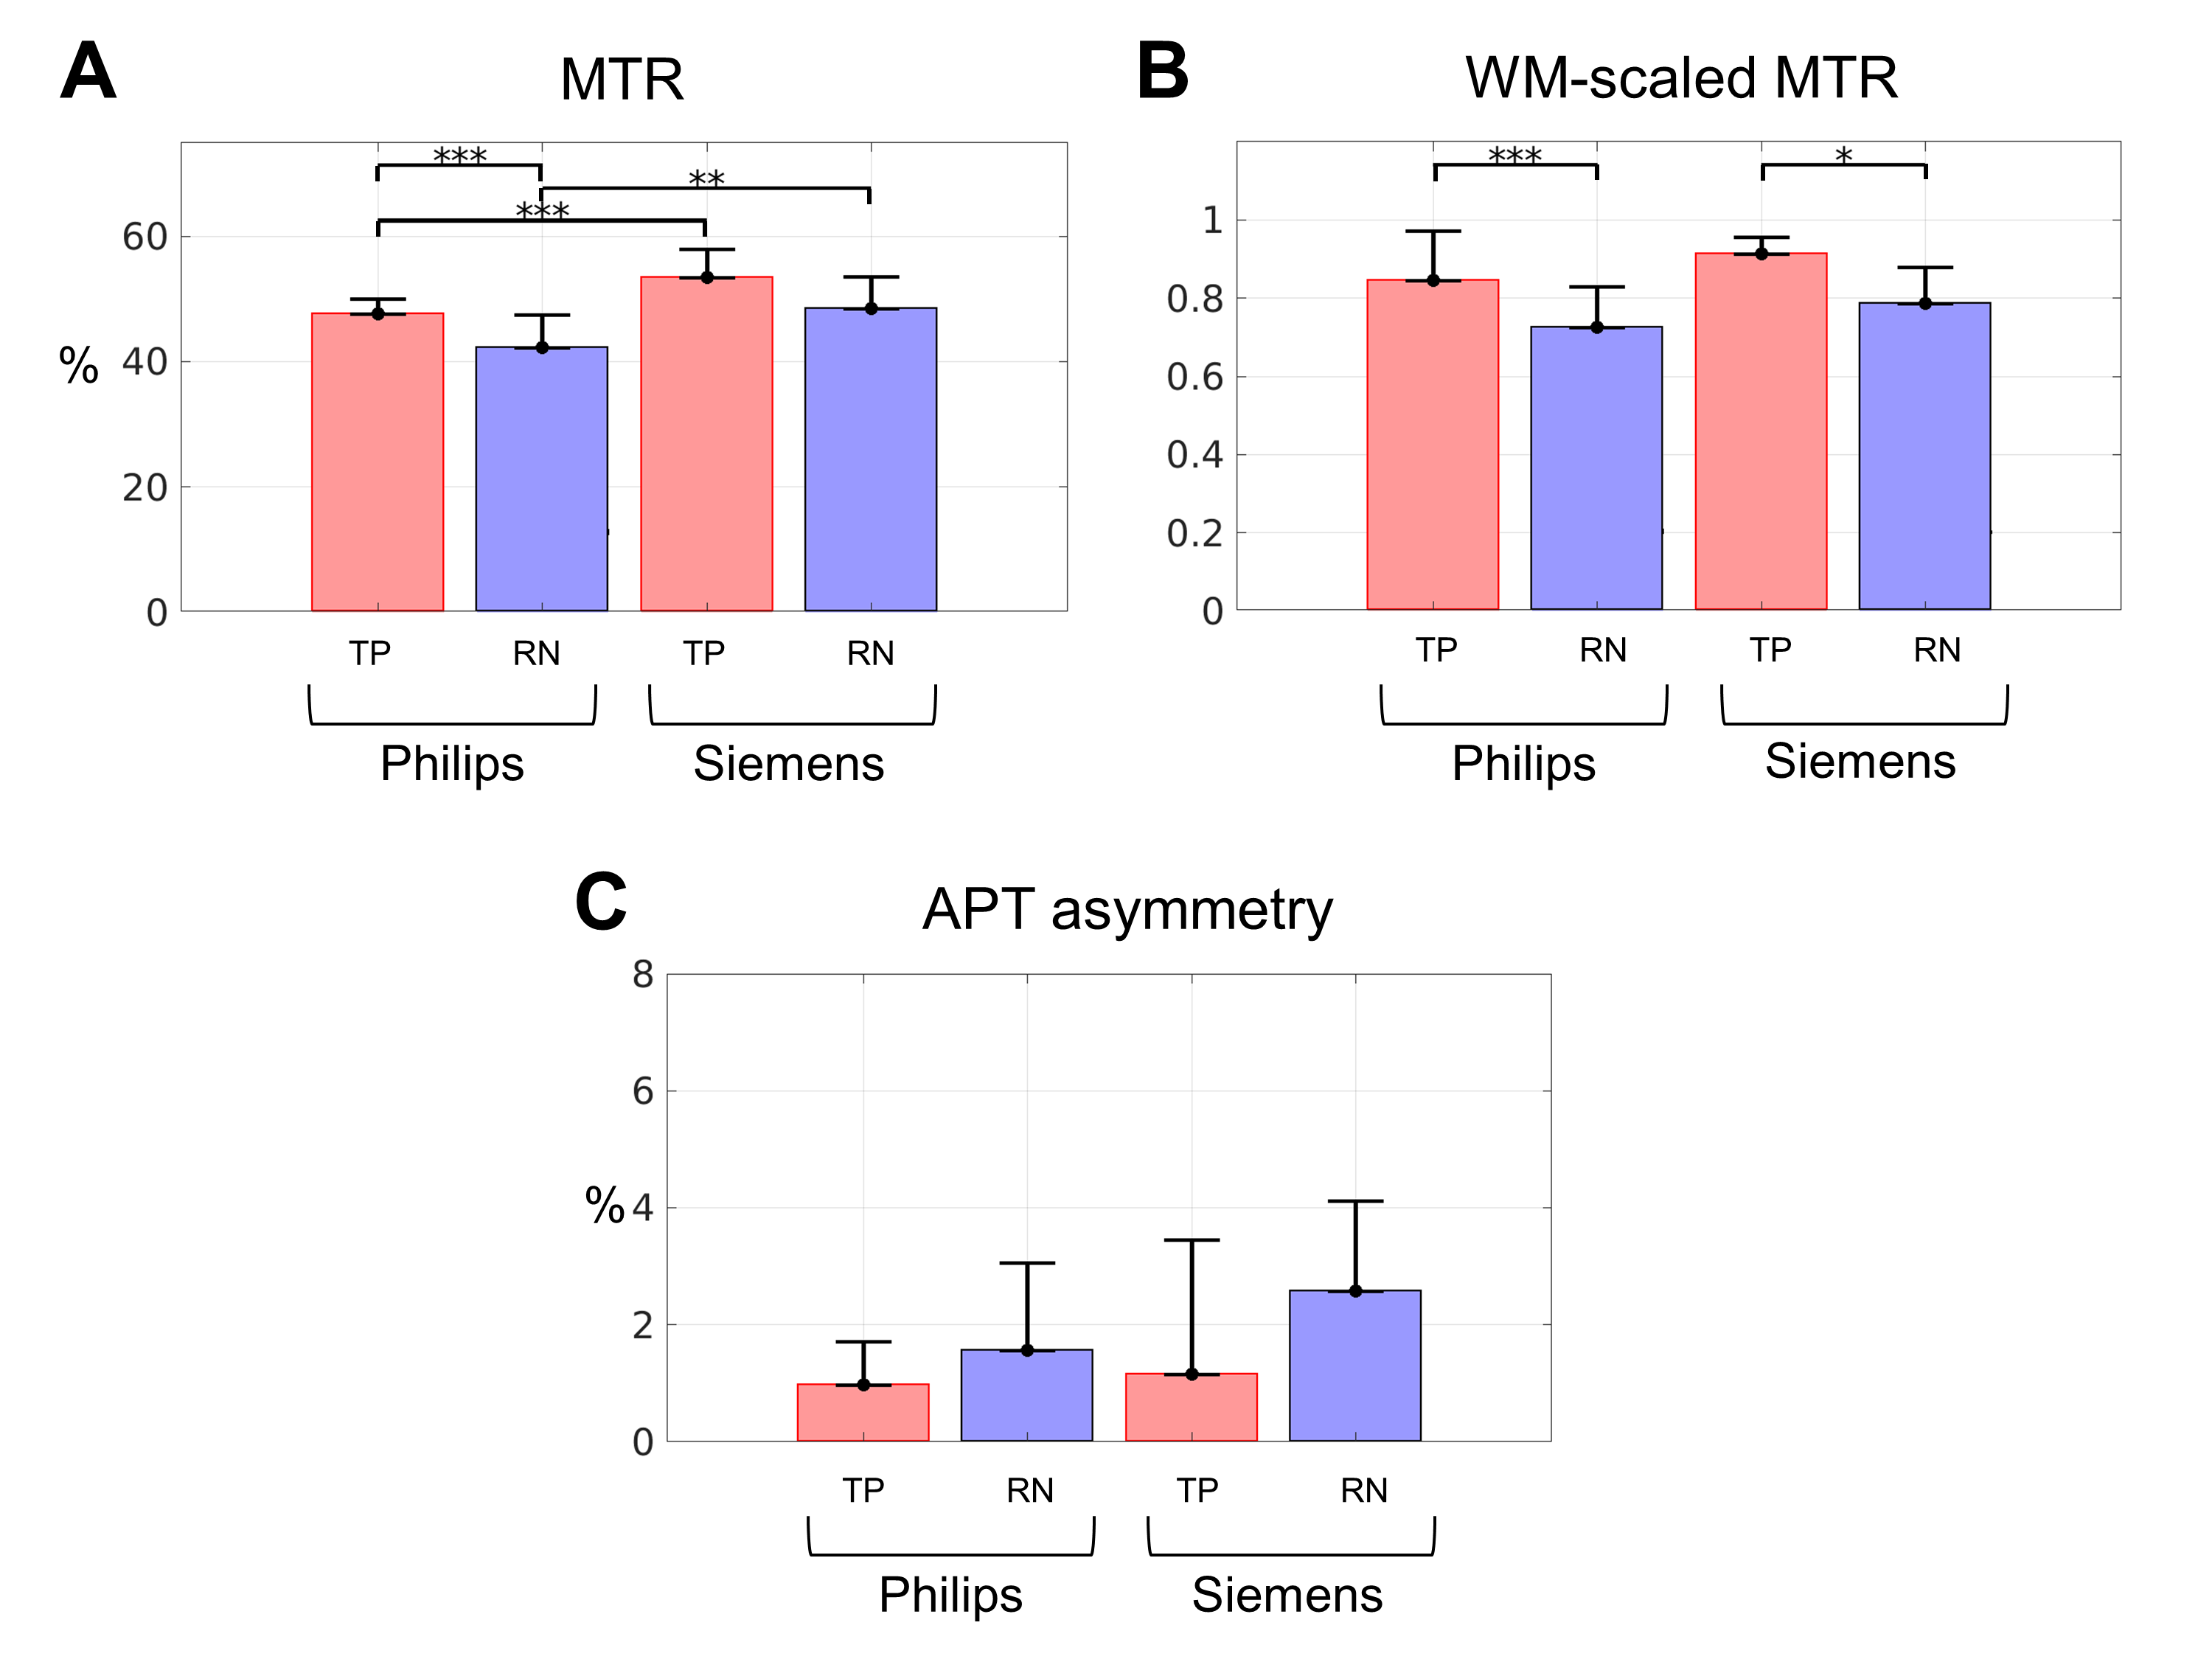
One patient/lesion from the Philips cohort without a WM ROI in the CEST slice near the brain surface was excluded from analysis. Between RN and TP groups, there were significant differences in the Philips cohort (Figure 4A, showing the high power MTRAmide) with 48±2% for TP and 42±5% for RN (p<0.001). In the same plot, the Siemens cohort MTR values are shown, with no significant differences between RN and TP. Before WM scaling, significant differences were found between the Philips and Siemens MTR values for both TP and RN; after WM scaling (Figure 4B), the differences between scanners became non-significant. As well, differences between RN and TP in the Siemens cohort became significant after WM scaling. All MTR for both scanners (unscaled and WM-scaled) are higher for TP compared to RN, consistent with previous findings from the Philips scanner [11,12]. The Amide Proton Transfer (APT) asymmetry (Figure 4C) failed to distinguish between TP and RN.Discussion
MTR is a useful metric for differentiating between RN and TP in brain metastases [11,12]. Here, we investigated the scaling of MTR by each patient’s WM signal for differentiating RN from TP across two MRI systems with different implementations of CEST saturation. The WM-scaled MTR resulted in closer values between the MR systems compared to unscaled MTR. Future work using quantitative modelling [15,16] could be used to compare different vendors/sequences and further protocol optimization could allow for scan time reduction.Conclusion
MTR and WM-scaled MTR metrics were explored for comparison across two different vendors and CEST sequences in patients with brain metastases. WM-scaled MTR showed improved correspondence across the MR systems with a clinically acceptable scan time using both (2D and 3D) vendor implementations.Acknowledgements
We thank Gerald Moran at Siemens Healthineers for providing the 3D CEST sequence. We thank all the MR radiation therapists who were involved in scanning and Angus Lau for useful advice. We gratefully acknowledge sources of funding (Terry Fox Research Institute; Canadian Institutes of Health Research; Canadian Cancer Society Research Institute). Wilfred Lam and Rachel Chan contributed equally to this work.References
[1] de Azevedo Santos TR, Tundisi CF, Ramos H, Maia MAC, Pellizzon ACA, Silva MLG, et al. Local control after radiosurgery for brain metastases: Predictive factors and implications for clinical decision. Radiat Oncol 2015;10. https://doi.org/10.1186/s13014-015-0367-y.
[2] Scoccianti S, Ricardi U. Treatment of brain metastases: Review of phase III randomized controlled trials. Radiother Oncol 2012;102:168–79. https://doi.org/10.1016/j.radonc.2011.08.041.
[3] Tsao MN, Rades D, Wirth A, Lo SS, Danielson BL, Gaspar LE, et al. Radiotherapeutic and surgical management for newly diagnosed brain metastasis(es): An American Society for Radiation Oncology evidence-based guideline. Pract Radiat Oncol 2012;2:210–25. https://doi.org/10.1016/j.prro.2011.12.004.
[4] Andrews DW, Scott CB, Sperduto PW, Flanders AE, Gaspar LE, Schell MC, et al. Whole brain radiation therapy with or without stereotactic radiosurgery boost for patients with one to three brain metastases: phase III results of the RTOG 9508 randomised trial. Lancet 2004;363:1665–72. https://doi.org/10.1016/S0140-6736(04)16250-8.
[5] Patel U, Patel A, Cobb C, Benkers T, Vermeulen S. The management of brain necrosis as a result of SRS treatment for intra-cranial tumor. Transl Cancer Res 2014;3:373–82. https://doi.org/10.3978/j.issn.2218-676X.2014.07.05.
[6] Hoefnagels FWA, Lagerwaard FJ, Sanchez E, Haasbeek CJA, Knol DL, Slotman BJ, et al. Radiological progression of cerebral metastases after radiosurgery: Assessment of perfusion MRI for differentiating between necrosis and recurrence. J Neurol 2009;256:878–87. https://doi.org/10.1007/s00415-009-5034-5.
[7] Ross DA, Sandler HM, Balter JM, Hayman JA, Archer PG, Auer DL. Imaging changes after stereotactic radiosurgery of primary and secondary malignant brain tumors. J Neurooncol 2002;56:175–81. https://doi.org/10.1023/A:1014571900854.
[8] Ward KM, Aletras AH, Balaban RS. A New Class of Contrast Agents for MRI Based on Proton Chemical Exchange Dependent Saturation Transfer (CEST). J Magn Reson 2000;143:79–87. https://doi.org/10.1006/jmre.1999.1956.
[9] Zhou J, Payen JF, Wilson DA, Traystman RJ, van Zijl PCM. Using the amide proton signals of intracellular proteins and peptides to detect pH effects in MRI. Nat Med 2003. https://doi.org/10.1038/nm907.
[10] Zhou J, Lal B, Wilson DA, Laterra J, van Zijl PCM. Amide Proton Transfer (APT) Contrast for Imaging of Brain Tumors. Magn Reson Med 2003;50:1120–6. https://doi.org/10.1002/mrm.10651.
[11] Mehrabian H, Desmond KL, Soliman H, Sahgal A, Stanisz GJ. Differentiation between radiation necrosis and tumor progression using chemical exchange saturation transfer. Clin Cancer Res 2017;23:3667–75. https://doi.org/10.1158/1078-0432.CCR-16-2265.
[12] Chan RW, Mehrabian H, Soliman H, Chen H, Theriault A, Myrehaug S, et al. Differentiation of Radiation Necrosis from Tumor Progression in Brain Metastasis Treated with Stereotactic Radiosurgery using CEST at 3T. In: Proceedings of the ISMRM & SMRT Virtual Annual Meeting & Exhibition. 2021.
[13] Isensee F, Schell M, Pflueger I, Brugnara G, Bonekamp D, Neuberger U, et al. Automated brain extraction of multisequence MRI using artificial neural networks. Hum Brain Mapp 2019;40:4952–64. https://doi.org/10.1002/hbm.24750.
[14] Zhang Y, Brady M, Smith S. Segmentation of brain MR images through a hidden Markov random field model and the expectation-maximization algorithm. IEEE Trans Med Imag 2001;20:45-57. https://doi.org/10.1109/42.906424.
[15] Portnoy S, Stanisz GJ. Modeling pulsed magnetization transfer. Magn Reson Med 2007;58:144–55. https://doi.org/10.1002/mrm.21244.
[16] Lankford CL, Louie EA, Zu Z, Does MD, Gochberg DF. A hybrid numeric‐analytic solution for pulsed CEST. NMR Biomed 2021:1–12. https://doi.org/10.1002/nbm.4610.
Figures