4457
Saturation Transfer MRI in a Clinical Setting for Differentiating Radiation Necrosis from Tumour Progression in Brain Metastases1Physical Sciences Platform, Sunnybrook Research Institute, Toronto, ON, Canada, 2Department of Radiation Oncology, Sunnybrook Health Sciences Centre, Toronto, ON, Canada, 3Department of Medical Biophysics, University of Toronto, Toronto, ON, Canada, 4Department of Neurosurgery and Pediatric Neurosurgery, Medical University of Lublin, Lublin, Poland
Synopsis
Stereotactic radiosurgery for brain metastases delivers a focal dose of radiation and has excellent local tumour control but leads to radiation necrosis (RN) in up to 22% of patients. This study used saturation transfer MRI for distinguishing between RN and tumour progression (TP), extending our previous work to a larger cohort of 70 patients (75 lesions). Eleven out of 14 metrics (including quantitative MT and CEST) showed statistically significant differences between the RN and TP cohorts, including magnetization transfer ratio (MTR) metrics showing the best separation. Univariable logistic regression resulted in the high-power MTR having the highest AUC=0.88 (with AIC=67.3).
Introduction
Brain metastases develop in nearly 30% of patients with cancer [1,2]. Stereotactic radiosurgery (SRS), which delivers a focal dose of radiation locally to the tumour, has become the standard of care [3], but the high radiation doses to achieve local control leads to radiation necrosis (RN) in up to 22% of patients [1,3,4]. Differentiating these radiation-induced changes from tumour progression (TP) using conventional MRI is challenging [5,6] as both have similar appearance on post-contrast T1-weighted (T1w) MRI [7]. Distinguishing between RN and TP would help to guide clinical practice, as the diseases have vastly different treatment.Saturation transfer MRI, including Chemical Exchange Saturation Transfer (CEST) [8], relayed Nuclear Overhauser Effect (rNOE) [9] and quantitative Magnetization Transfer (qMT) [10,11], have shown promising results for differentiating RN from TP in brain metastases[12,13]. Our previous studies differentiating these conditions [12,13] have shown that the Magnetization Transfer Ratio (MTR), despite being a non-specific metric comprising of mixed CEST/MT/T1/T2 contrast, to be able to differentiate between RN and TP with high accuracy [12,13], including a study [13] that has used high saturation amplitudes (B1=2µT) in 23 patients.
The present study extended our previous cohort [13] to 70 brain metastases patients performed in a clinical setting. Whereas our previous study [13] has investigated only the MTR metrics, here we included qMT and apparent exchange-dependant relaxation (AREX) [14] to separate MT and CEST contributions to the MTR.
Methods
Patients: 70 patients (75 lesions) previously treated with SRS underwent CEST/MT MRI. SRS treatment were of a single fraction (16-20Gy) or hypo-fractionated (24-32.5Gy in 3 to 5 fractions). Outcomes of RN or TP were determined based on histological confirmation or clinical and radiographic follow-up 6 months after the CEST scan. The study was approved by the institutional research ethics board and informed consent was obtained.MRI Acquisition: Images were acquired at 3T (Achieva; Philips Healthcare, Best, The Netherlands). A single slice CEST data were acquired at B1=0.522 and 2µT, and at offset frequencies between ±1.2ppm in 0.12ppm increments); qMT data were collected at B1=1.5, 3, and 5µT, at 14 offset frequencies (3-780ppm). B0, B1 (using a water shift and B1 (WASABI) scan [15]), T1/T2 mapping scans were included.
Image analysis: Regions of interest were drawn on the contrast-enhanced T1w image and co-registered to CEST. The median metric values over the lesion ROIs were calculated. WASSR was used to correct for B0 inhomogeneity and all MTR maps were scaled voxel-wise by the B1 (from the WASABI scan). Fourteen metrics were quantified including qMT, APT, MTR, qMT and AREX at high and low saturation power (at the amide/rNOE frequency offsets, averaged between ±3.25 and ±3.75ppm).
Statistical Analysis: The difference in mean parameter values between RN and TP was investigated with two-sample t-tests and Cohen’s d[16]. The parameters’ abilities to differentiate RN from TP were quantified by their AUCs (areas under the receiver operating characteristic (ROC) curve) and Akaike Information Criteria (AIC) [17] upon univariable logistic regression. Analyses were performed with MATLAB (R2016b) and R (v4.0.2).
Results
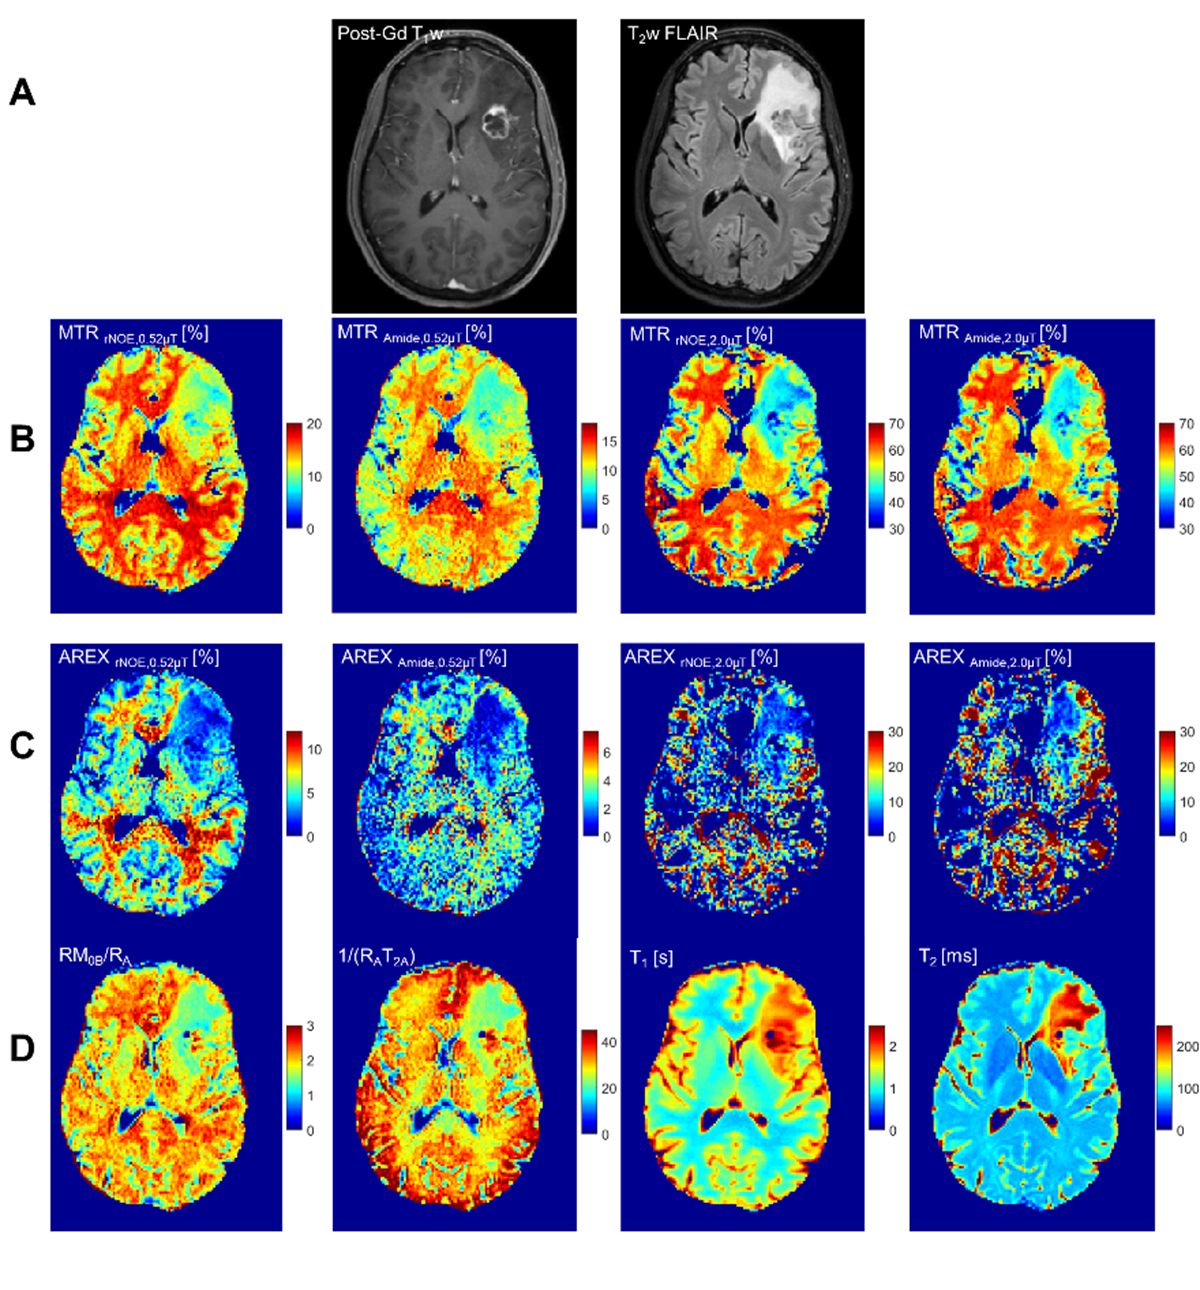
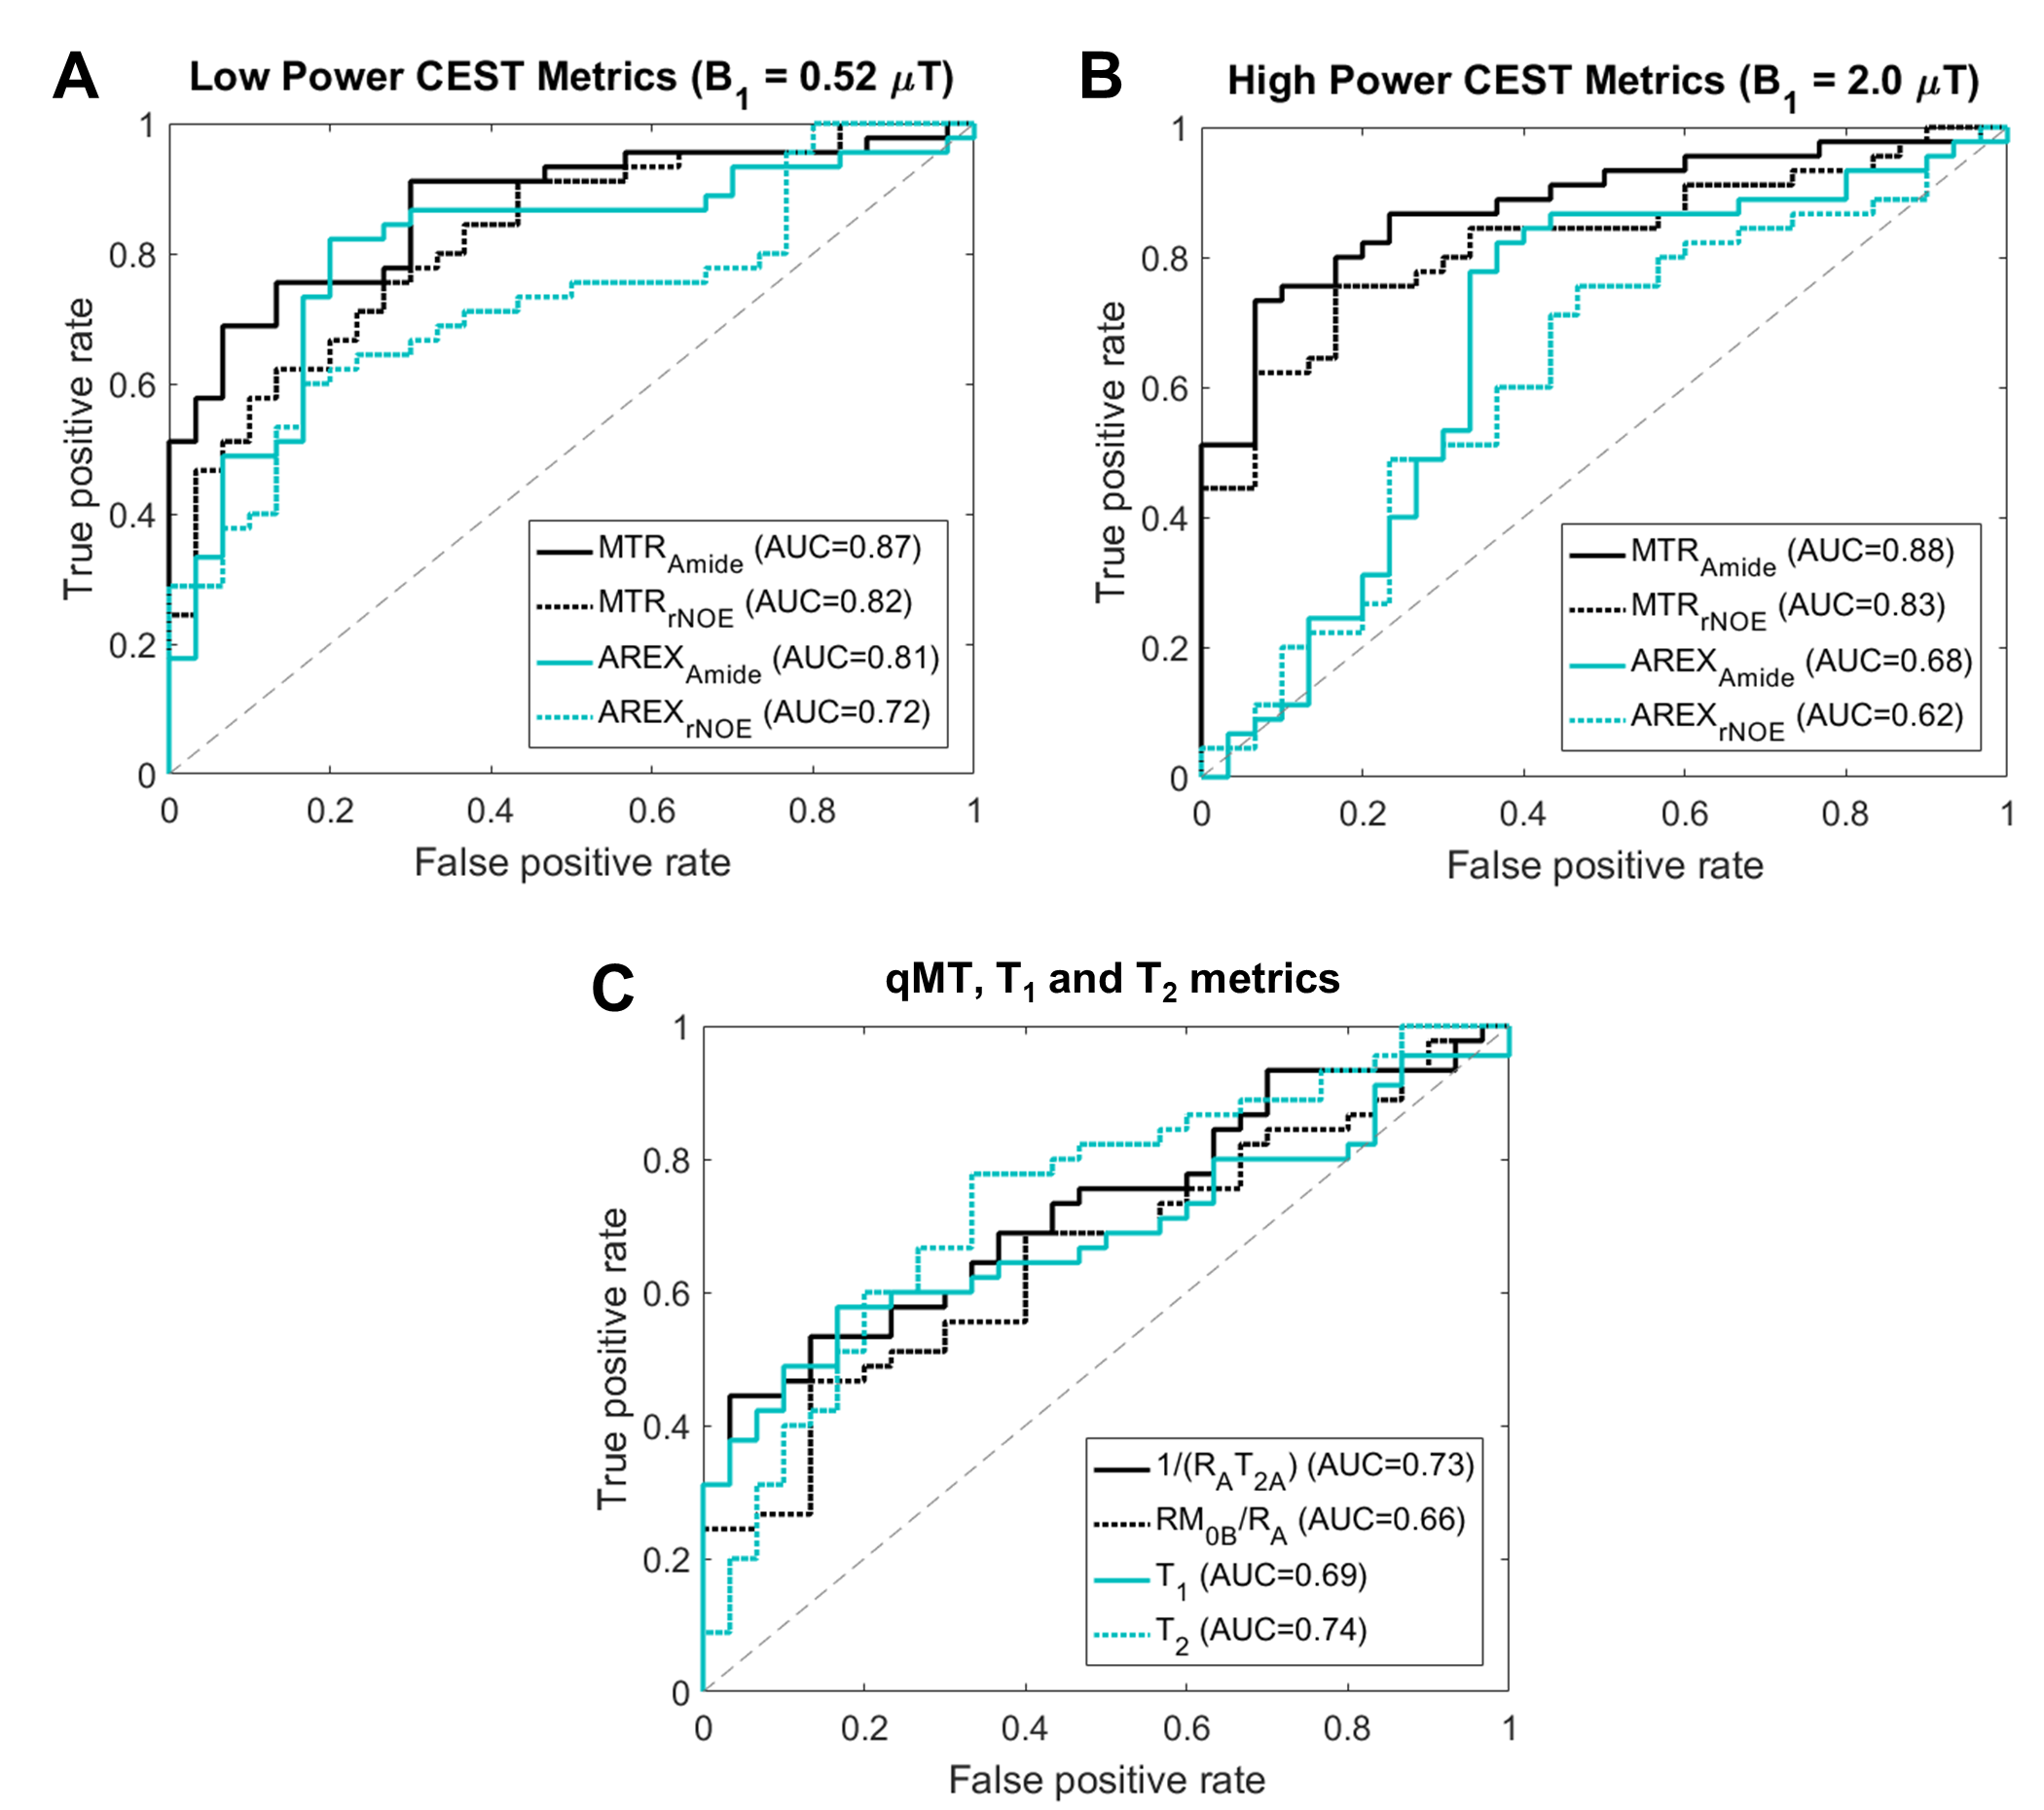
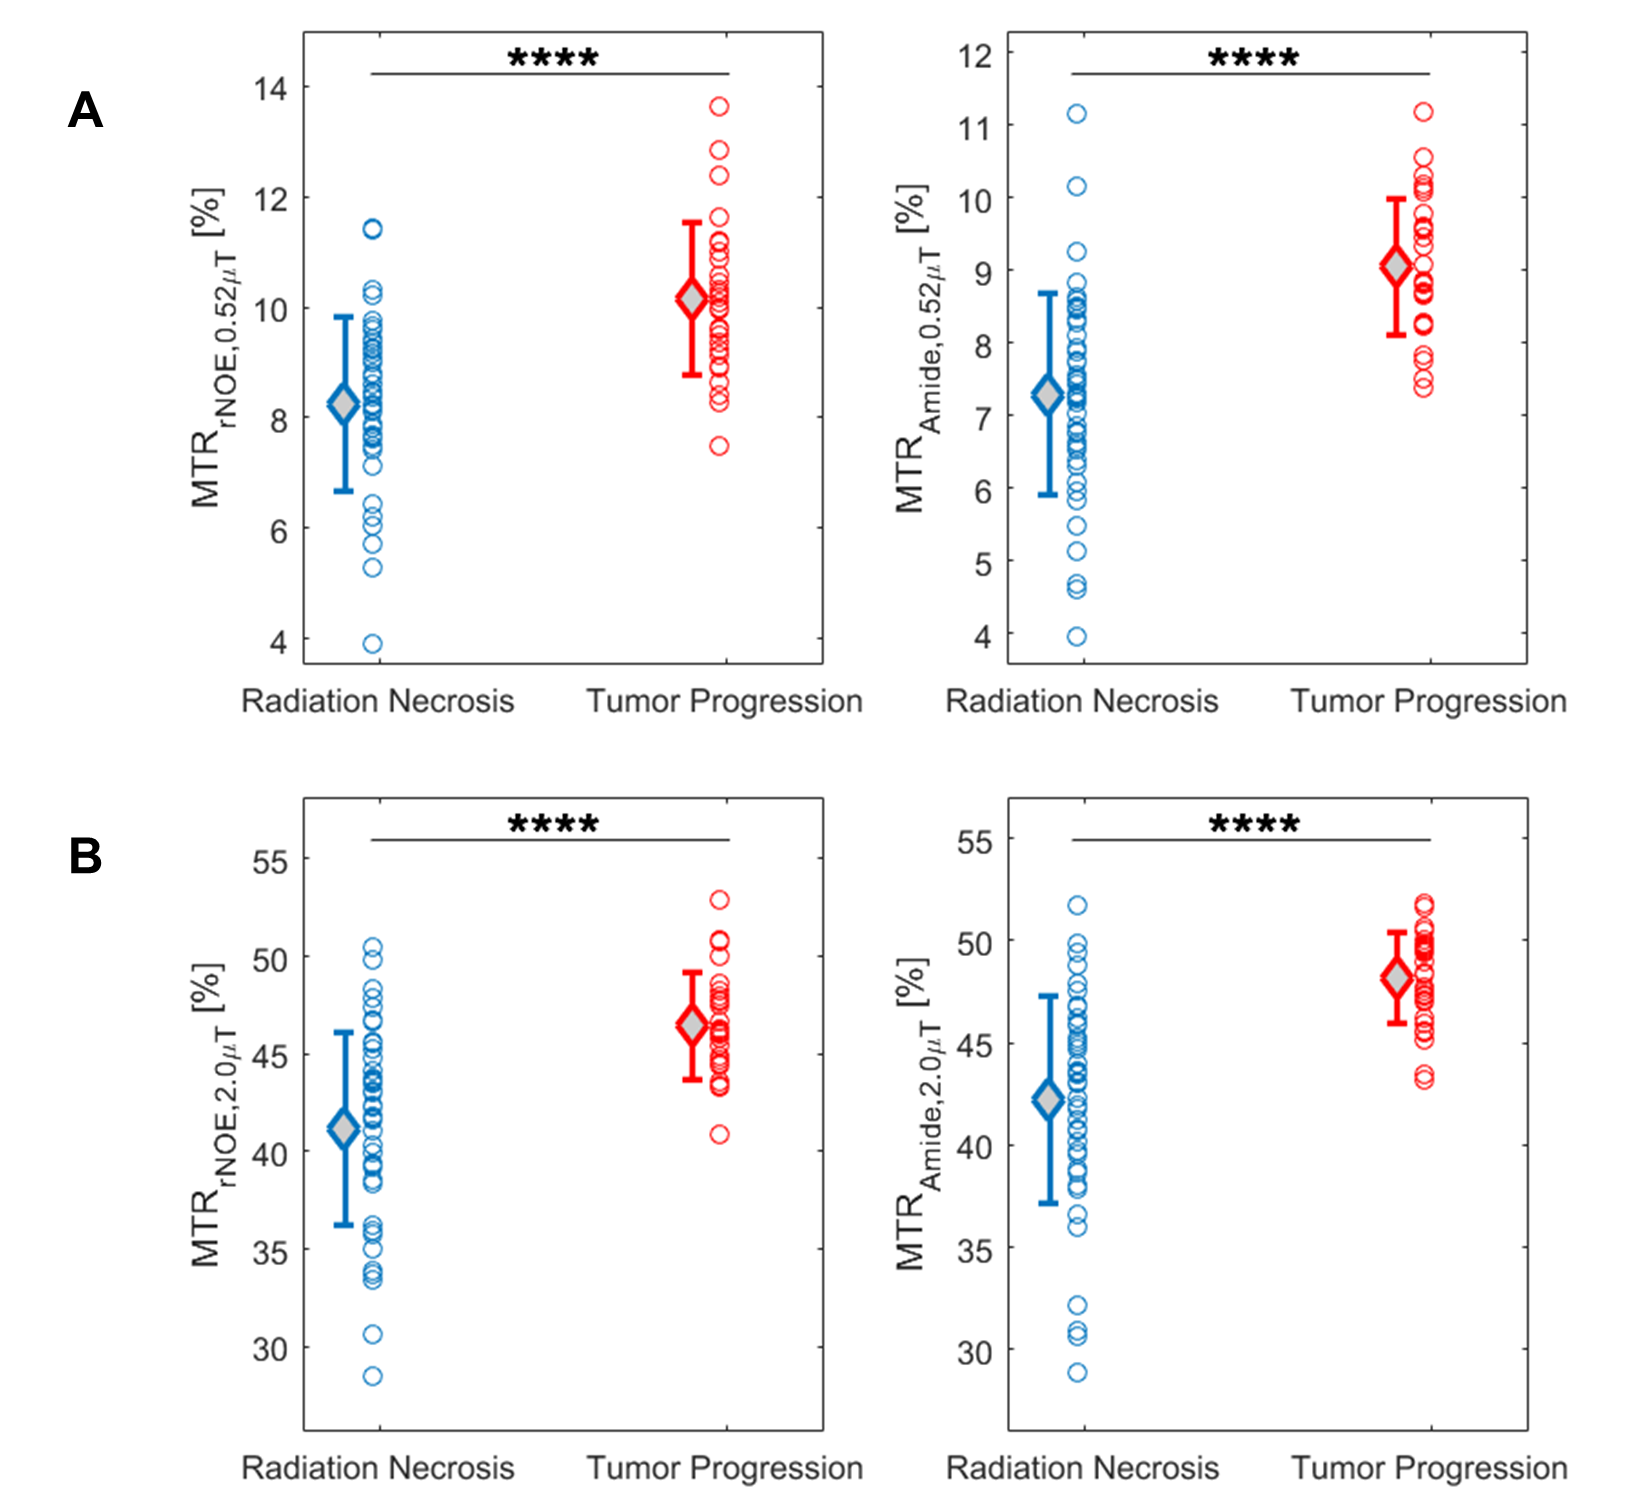
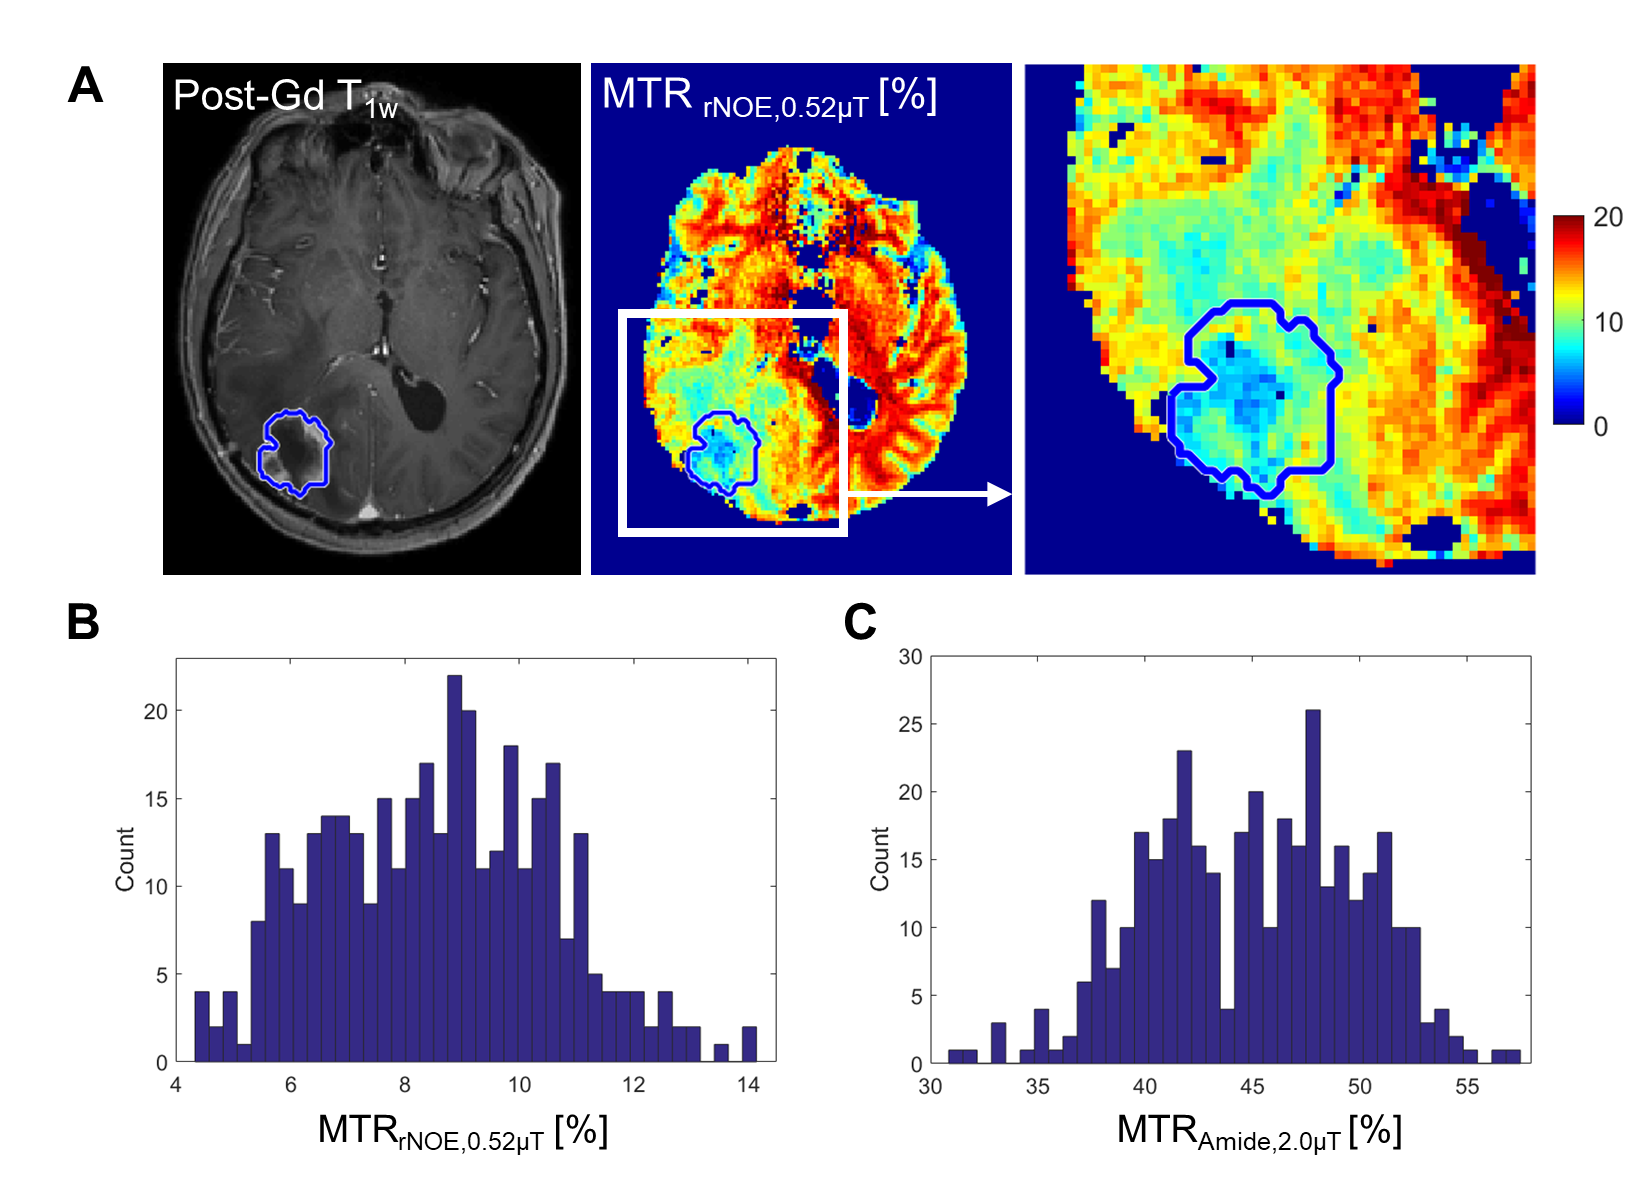
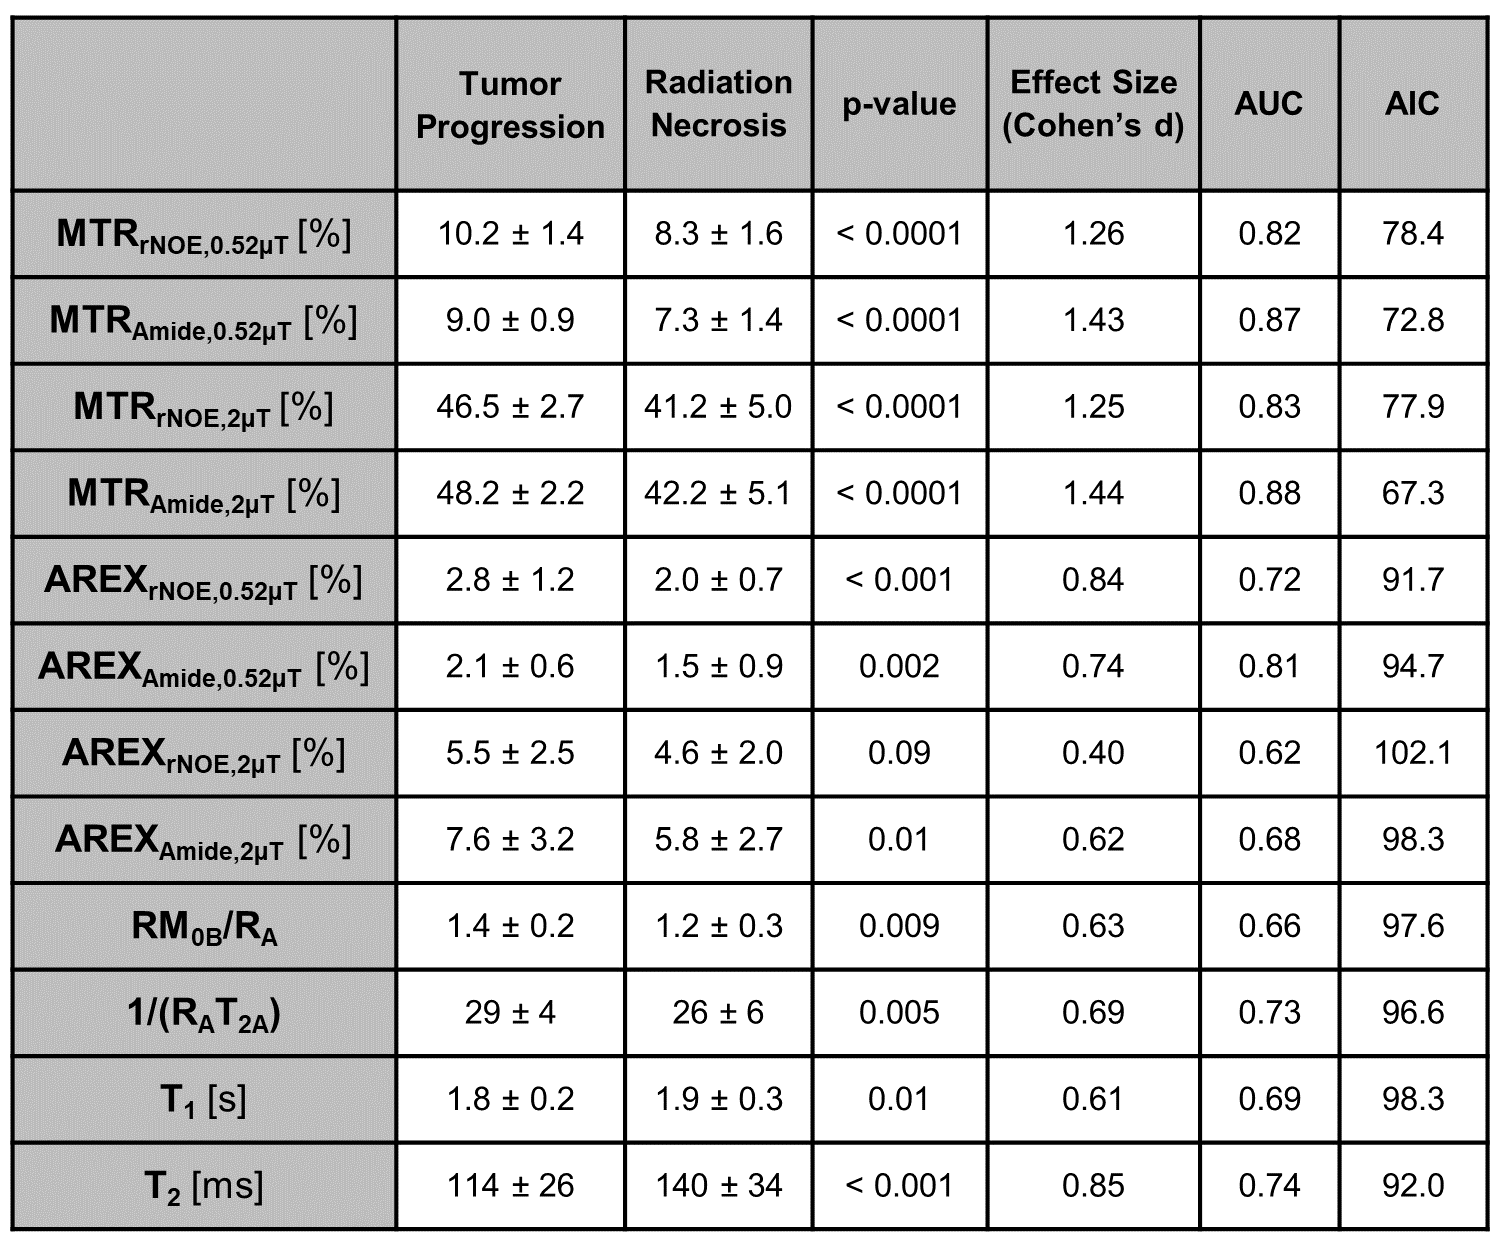
The clinical outcomes of the lesions (n=75) demonstrated 45 cases of RN and 30 cases of TP, including 11 determined through histopathology. Figure 1 shows the parametric maps (MTR, AREX, qMT and direct effect) for a patient with TP. Figure 2 shows the ROC curves for differentiating RN from TP for each metric. MTR provides the best separation for all lesions in each cohort (with plots of MTR shown in Figure 3). Asymmetry maps from Amide Proton Transfer (APT) computed for comparison (not shown) resulted in noisier maps with no significant differences between the groups. Figure 4 shows an example with ROI median values falling between the necrosis and tumour cohort medians, due to areas of both tumour and necrosis. Table 1 reports the mean and standard deviation in each RN and TP cohort. All metrics (except for AREXrNOE,2.0µT) showed significant differences in mean values between RN and TP (with p<0.05), with MTR metrics having the smallest p-values (p<0.0001). High-power MTR had the greatest ability to differentiate RN from TP (AUC=0.88, AIC=67.3), followed by low-power MTR (AUC=0.87, AIC=72.8).Discussion
Differentiating RN from TP is essential for managing radiation-induced effects after SRS treatment. This study conducted in a clinical setting in a large cohort of patients included CEST scans with high saturation amplitudes (B1=2µT) and also qMT and AREX. 11 out of 14 metrics showed significant differences between the RN and TP cohorts. Compared to MTR, the Amide Proton Transfer (APT) asymmetry maps are more noisy and thus, less useful for the differentiation between RN and TP. CEST imaging allows for high spatial resolution compared to MR spectroscopy and is suitable for imaging lesions with heterogeneous tumours (as in the example shown in Figure 4). A single slice was used in this study. Future work using a 3D saturation transfer acquisition will improve coverage and capture any signal heterogeneity across the slices.Conclusions
This clinical study demonstrated the utility of saturation transfer MRI in differentiating RN from TP. Significant differences in CEST and qMT characteristics of lesions were identified, suggesting that saturation transfer MRI is a useful tool in clinical practice for this and other related [11,18–20] applications.Acknowledgements
We thank all the MR radiation therapists who were involved in scanning and acknowledge sources of funding (Terry Fox Research Institute; Canadian Institutes of Health Research; Canadian Cancer Society Research Institute). Hatef Mehrabian and Rachel Chan contributed equally to this work as first authors; Hany Soliman and Greg Stanisz contributed equally to this work as co-principal investigators.References
[1] Scoccianti S, Ricardi U. Treatment of brain metastases: Review of phase III randomized controlled trials. Radiother Oncol 2012;102:168–79. https://doi.org/10.1016/j.radonc.2011.08.041.
[2] Nayak L, Lee EQ, Wen PY. Epidemiology of brain metastases. Curr Oncol Rep 2012;14:48–54. https://doi.org/10.1007/s11912-011-0203-y.
[3] Tsao MN, Rades D, Wirth A, Lo SS, Danielson BL, Gaspar LE, et al. Radiotherapeutic and surgical management for newly diagnosed brain metastasis(es): An American Society for Radiation Oncology evidence-based guideline. Pract Radiat Oncol 2012;2:210–25. https://doi.org/10.1016/j.prro.2011.12.004.
[4] de Azevedo Santos TR, Tundisi CF, Ramos H, Maia MAC, Pellizzon ACA, Silva MLG, et al. Local control after radiosurgery for brain metastases: Predictive factors and implications for clinical decision. Radiat Oncol 2015;10. https://doi.org/10.1186/s13014-015-0367-y.
[5] Ross DA, Sandler HM, Balter JM, Hayman JA, Archer PG, Auer DL. Imaging changes after stereotactic radiosurgery of primary and secondary malignant brain tumors. J Neurooncol 2002;56:175–81. https://doi.org/10.1023/A:1014571900854.
[6] Huber PE, Hawighorst H, Fuss M, Van Kaick G, Wannenmacher MF, Debus J. Transient enlargement of contrast uptake on MRI after linear accelerator (linac) stereotactic radiosurgery for brain metastases. Int J Radiat Oncol Biol Phys 2001;49:1339–49. https://doi.org/10.1016/S0360-3016(00)01511-X.
[7] Hoefnagels FWA, Lagerwaard FJ, Sanchez E, Haasbeek CJA, Knol DL, Slotman BJ, et al. Radiological progression of cerebral metastases after radiosurgery: Assessment of perfusion MRI for differentiating between necrosis and recurrence. J Neurol 2009;256:878–87. https://doi.org/10.1007/s00415-009-5034-5.
[8] Ward KM, Aletras AH, Balaban RS. A New Class of Contrast Agents for MRI Based on Proton Chemical Exchange Dependent Saturation Transfer (CEST). J Magn Reson 2000;143:79–87. https://doi.org/10.1006/jmre.1999.1956.
[9] Zhou J, Lal B, Wilson DA, Laterra J, van Zijl PCM. Amide Proton Transfer (APT) Contrast for Imaging of Brain Tumors. Magn Reson Med 2003;50:1120–6. https://doi.org/10.1002/mrm.10651.
[10] Morrison C, Mark Henkelman R. A Model for Magnetization Transfer in Tissues. Magn Reson Med 1995;33:475–82. https://doi.org/10.1002/mrm.1910330404.
[11] Henkelman RM, Huang X, Xiang Q ‐S, Stanisz GJ, Swanson SD, Bronskill MJ. Quantitative interpretation of magnetization transfer. Magn Reson Med 1993;29:759–66. https://doi.org/10.1002/mrm.1910290607.
[12] Mehrabian H, Desmond KL, Soliman H, Sahgal A, Stanisz GJ. Differentiation between radiation necrosis and tumor progression using chemical exchange saturation transfer. Clin Cancer Res 2017;23:3667–75. https://doi.org/10.1158/1078-0432.CCR-16-2265.
[13] Chan RW, Mehrabian H, Soliman H, Chen H, Theriault A, Myrehaug S, et al. Differentiation of Radiation Necrosis from Tumor Progression in Brain Metastasis Treated with Stereotactic Radiosurgery using CEST at 3T. In: Proceedings of the ISMRM & SMRT Virtual Annual Meeting & Exhibition. 2021.
[14] Zaiss M, Windschuh J, Paech D, Meissner JE, Burth S, Schmitt B, et al. Relaxation-compensated CEST-MRI of the human brain at 7T: Unbiased insight into NOE and amide signal changes in human glioblastoma. Neuroimage 2015;112:180–8. https://doi.org/10.1016/j.neuroimage.2015.02.040.
[15] Schuenke P, Windschuh J, Roeloffs V, Ladd ME, Bachert P, Zaiss M. Simultaneous mapping of water shift and B 1 (WASABI)—Application to field-Inhomogeneity correction of CEST MRI data. Magn Reson Med 2017;77:571–80. https://doi.org/10.1002/mrm.26133. [16] Cohen J. Statistical Power Analysis for the Behavioral Sciences. New York, NY: Routledge Academic. 1988.
[17] Akaike H. A new look at the statistical model identification. IEEE Trans Autom Contr, Vol 19, No 6, Pp 716–723 1974.
[18] Mehrabian H, Myrehaug S, Soliman H, Sahgal A, Stanisz GJ. Quantitative Magnetization Transfer in Monitoring Glioblastoma (GBM) Response to Therapy. Sci Rep 2018;8:1–11. https://doi.org/10.1038/s41598-018-20624-6.
[19] Mehrabian H, Myrehaug S, Soliman H, Sahgal A, Stanisz GJ. Evaluation of Glioblastoma Response to Therapy With Chemical Exchange Saturation Transfer. Int J Radiat Oncol Biol Phys 2018;101:713–23. https://doi.org/10.1016/j.ijrobp.2018.03.057.
[20] Mehrabian H, Lam WW, Myrehaug S, Sahgal A, Stanisz GJ. Glioblastoma (GBM) effects on quantitative MRI of contralateral normal appearing white matter. J Neurooncol 2018;139:97–106. https://doi.org/10.1007/s11060-018-2846-0.
Figures