4455
Measures of reliability in high frequency longitudinal white matter multi-shell diffusion and inhomogeneous magnetization transfer database11Sherbrooke Connectivity Imaging Lab (SCIL), University of Sherbrooke, SCIL, Sherbrooke, QC, Canada, 2Imeka Solutions, Inc., Sherbrooke, QC, Canada, 3Videos & Images Theory and Analytics Laboratory (VITAL), University of Sherbrooke,, Sherbrooke, QC, Canada, 4Pharma Research and Early Development, Roche Innovation Center Basel, F. Hoffmann-La Roche Ltd., Basel, Switzerland
Synopsis
Longitudinal imaging studies are widely used to capture and characterize progressive brain changes. However, evaluation of the reproducibility and the variation of measures in MRI is crucial to reliably detect or predict brain changes with quantitative MRI measures. Using the coefficient of variation and intraclass correlation, we evaluated the reproducibility of diffusion and myelin-based MRI measures from a multi-shell diffusion and inhomogeneous magnetization transfer MRI dataset of twenty healthy adults, each with five MRI acquisitions over six months. Moderate to high reproducibility of diffusion and myelin measures is observed within white matter tracks of interests.
Introduction
Longitudinal imaging studies have the advantage of allowing to trace the dynamics of events at the individual level [1]. They are thus considered to be more accurate and sensitive to capture progressive brain changes. However, to reliably detect brain changes in quantitative MRI measures, it is critical to evaluate the reproducibility and variation of measures with MR images that may arise due to different sources [2-5]. The amplitude of variations in MRI measures can be detected and quantified using the coefficient of variation and the intraclass correlation coefficient [6]. To date, there are only few databases allowing an evaluation of this variability over more than two timepoints. Consequently, we designed a “high frequency” repeated-measure study to collect a rich multivariate microstructural (anatomical, multi-shell diffusion, inhomogeneous magnetization transfer (ihMT)) MRI dataset that makes it possible to estimate the variance and correlation of measures across bundles, between several time points and different individuals.Methods
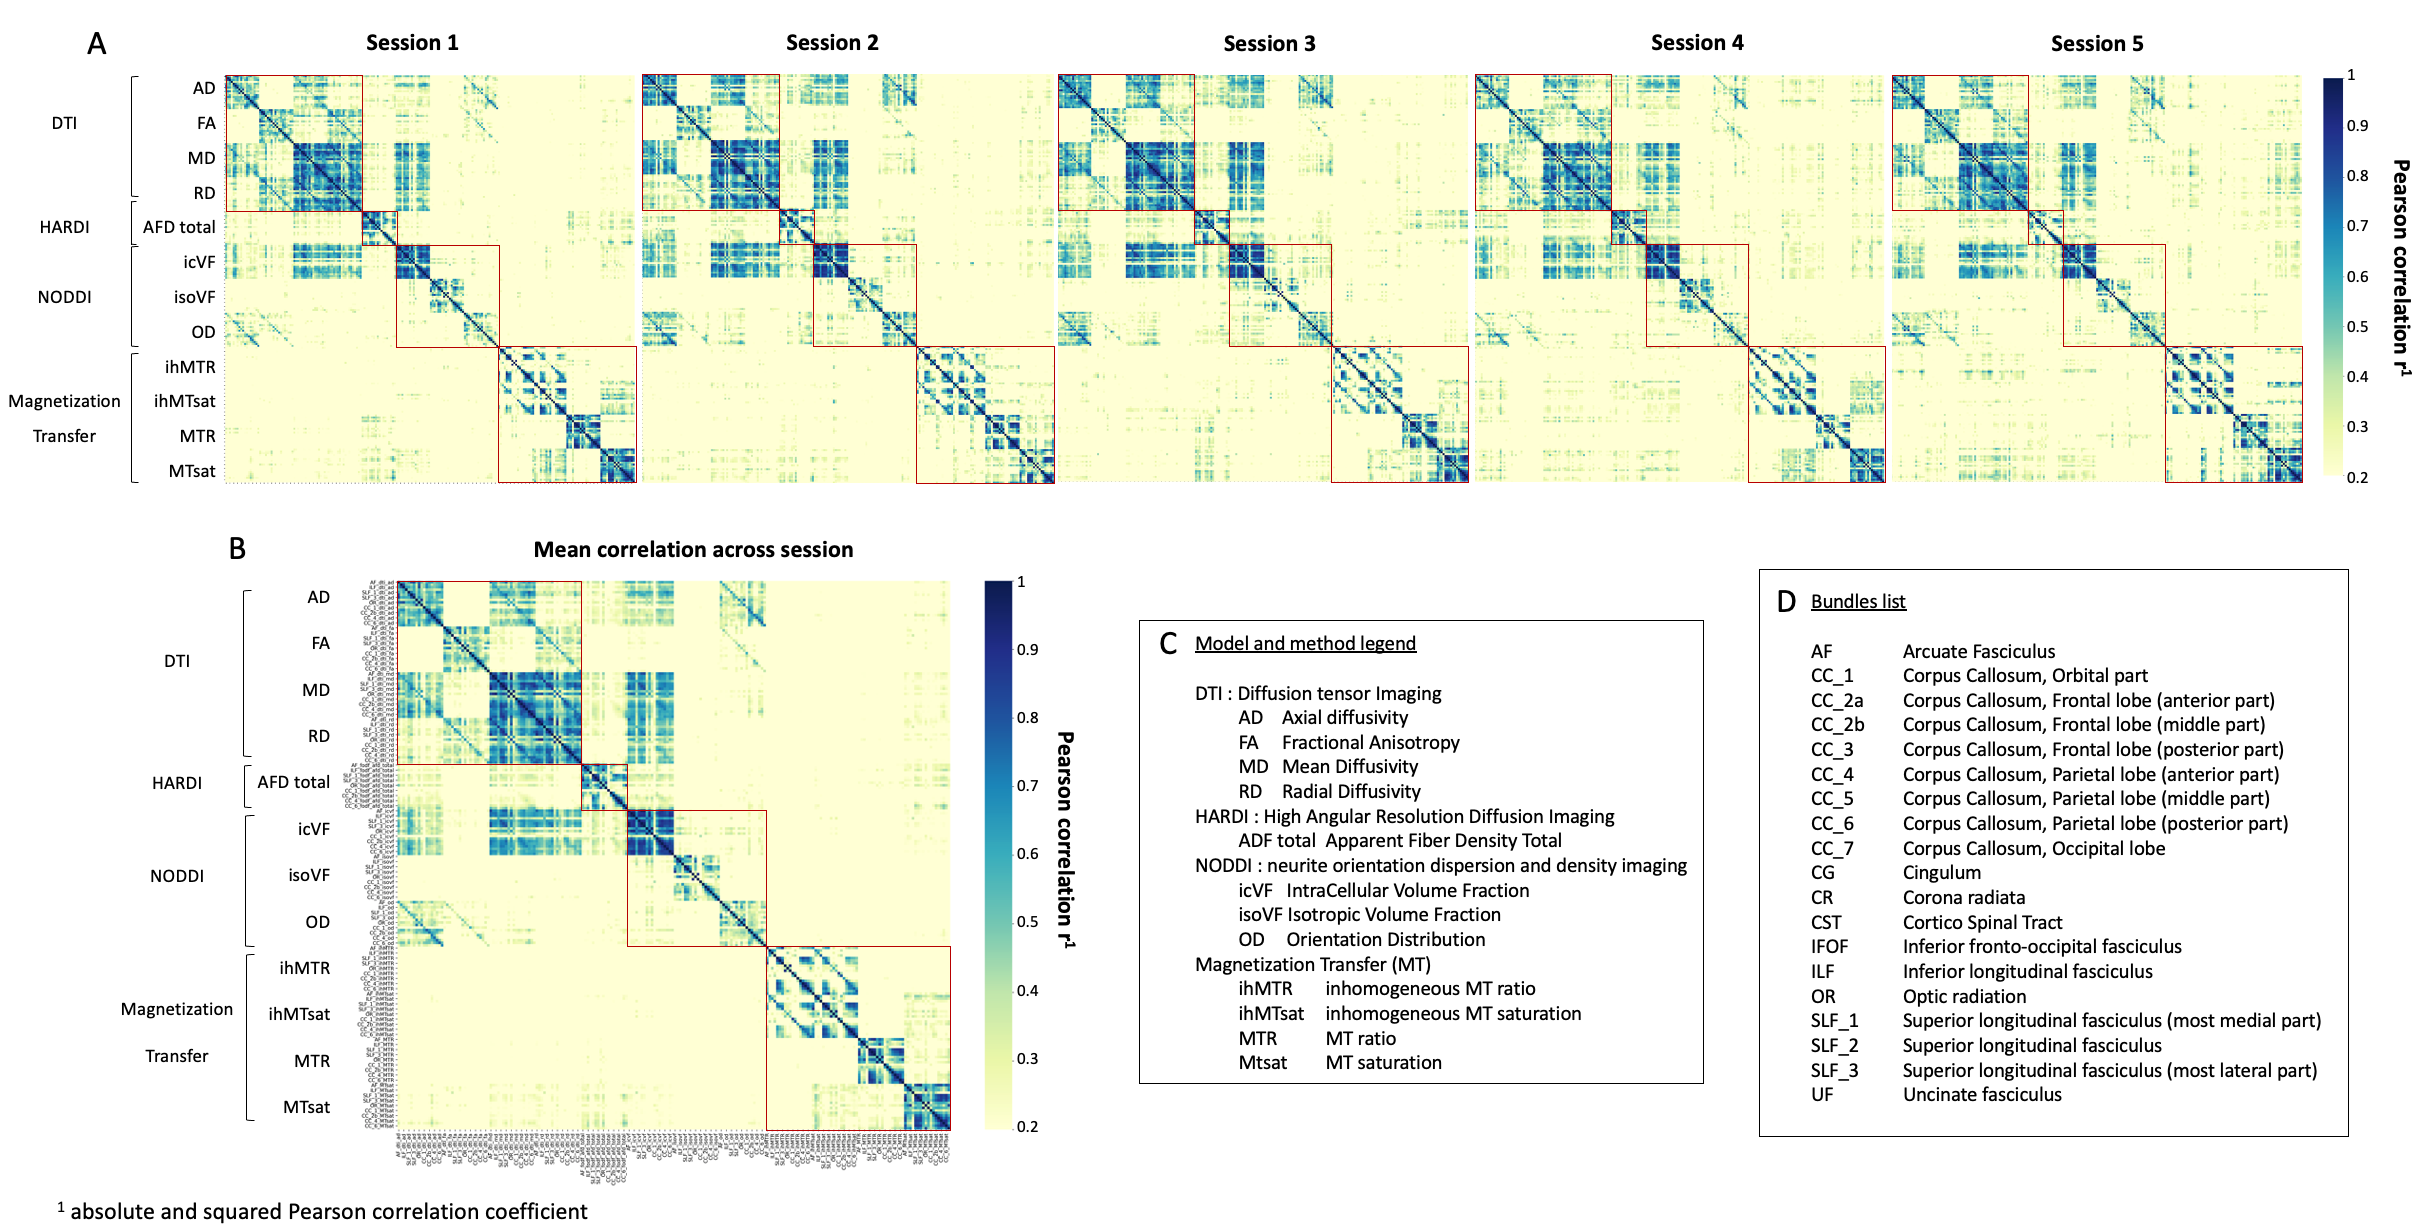
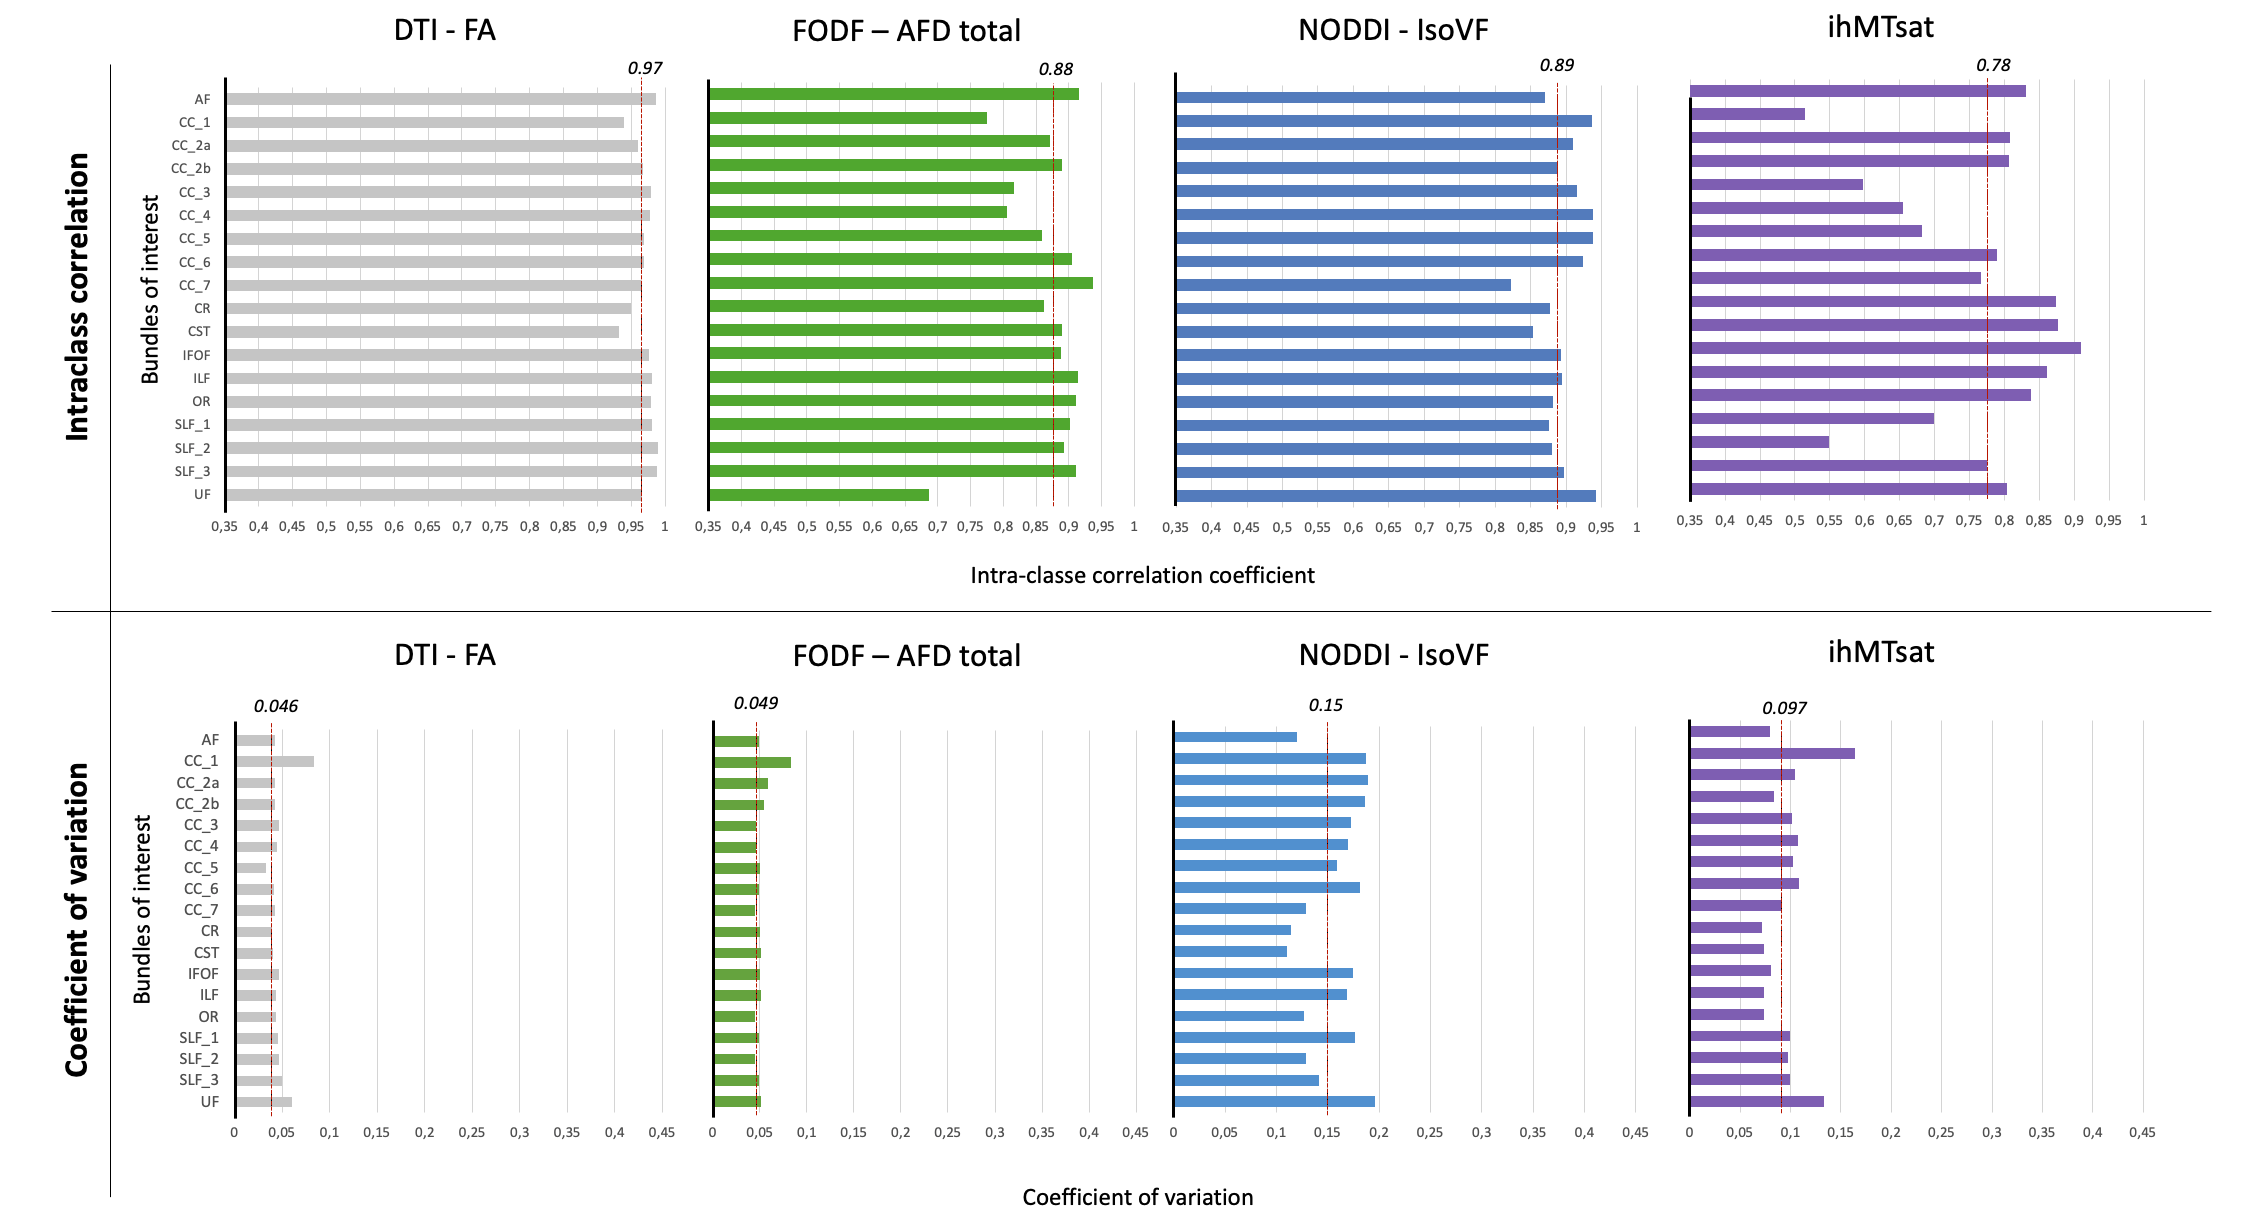
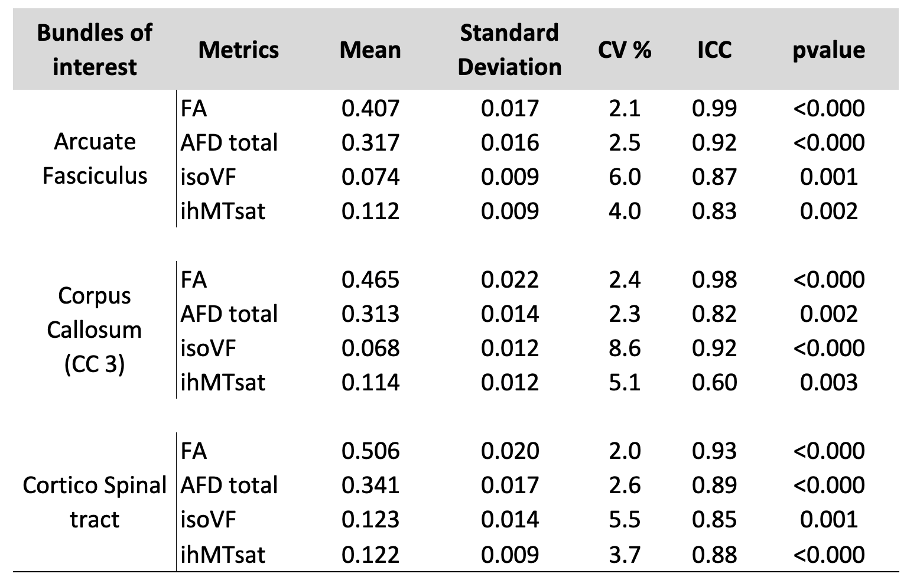
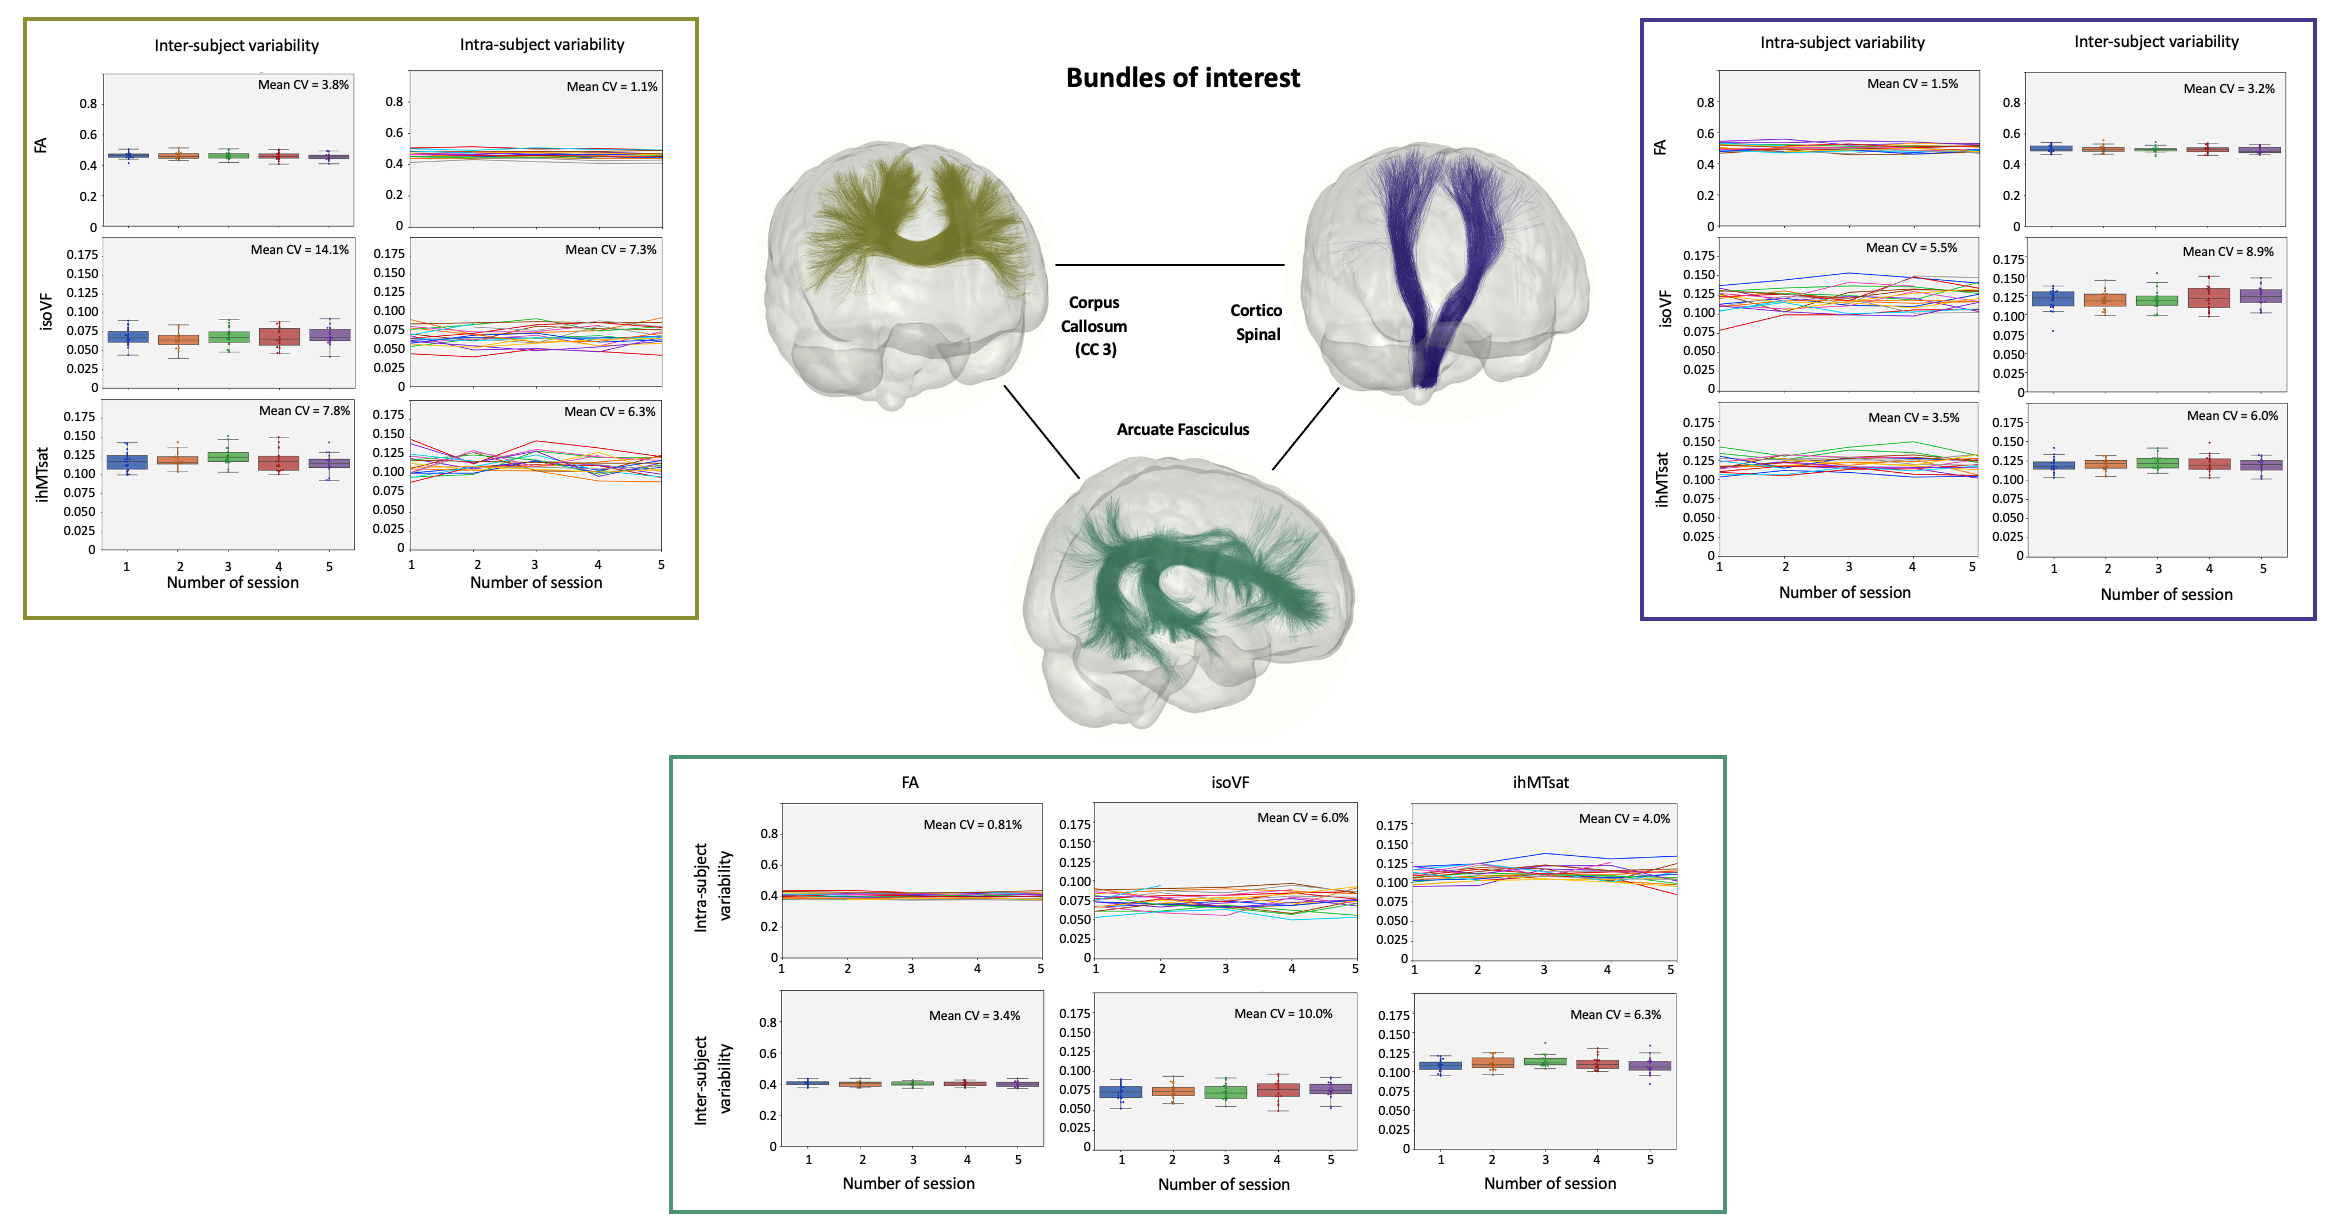
The study included 20 healthy adults (mean age 35 years [24-45], 4 men and 16 women). MRI sessions are repeated 5 times at a 4-week interval (+/- 1 week). Multi-shell diffusion MRI (b at 300, 1000, and 2000 s/mm2 for 8, 32 and 60 directions respectively) and T1w images are acquired with 3T MRI Philips Healthcare system and processed using Tractoflow [7]. This pipeline generates several diffusion metrics including DTI, HARDI and NODDI metrics. IhMT MRI for myelin index reconstruction is acquired using a 3D segmented-EPI gradient-echo sequence with different MT preparation pulses (TR/TE = 3.6/112ms, 2 mm isotropic resolution). IhMT uses a magnetization preparation (10 Hann pulses of 0.9 ms duration with 1.5 ms interval at a frequency offset of +/- 7000 Hz) designed to increase specificity to myelin [8,9]. IhMT data are processed using an in-house pipeline and provides MT and inhomogeneous MT ratio (MTR, ihMTR) and their pseudo-quantitative versions (MTsat, ihMTsat). 25 major WM bundles are extracted from whole brain tractograms using RecoBundlesX [10]. Finally, averaged values for each diffusion and myelin metrics are extracted for each bundle (Figure 1). To evaluate the reliability, we examined the Pearson correlation between all measures averaged across the bundles for each session. Then, the coefficient of variation (CV) and intra-class correlation (ICC) coefficients (two-way, absolute agreement) [11] are computed for an average assessment across all repeated timepoints, for each metric and bundle. Average ICC and CV are reported for all bundles and metrics. In depth results are reported only for WM projection (cortico-spinal, CST), association (arcuate fasciculus, AF), and commissural (corpus callosum, CC) tracts for a reduced number of metrics.Results
The correlation matrices of the measures averaged over different bundles reveal a high correlation between the metrics within each diffusion and myelin models. The first matrix exhibits a correlation pattern which is found across all repeated timepoint, suggesting consistency over time. Diffusion measures from different models sensitive to local complexity or orientational-dispersion show moderate to high correlation with each other (Figure 1). Figure 3 illustrates the average of ICC and CV across bundles for each model. ICC ranges, on average, from 0.76 to 0.97 (Figure 2A, Table 1), while the CV is generally low (Figure 2B, Table 1), suggesting a high degree of repeatability. Across the different measures, DTI metrics and notably FA exhibit the highest reproducibility (mean ICC = 0.97, mean CV = 4%), while myelin measures show overall greater variability. Across myelin measures, pseudo-quantitative show higher reliability (ihMTsat/MTsat: mean ICC = 0.78/0.93, mean CV = 9.7/4.3%) than ratio measures (ihMTR/MTR: mean ICC = 0.82/0.73, mean CV = 9.2/4.7%). Across the different bundles, ICCs and CV exhibit greater variation for isoVF and ihMTsat (0.5 >ICC>0.91 and CV>10%), notably for commissural bundles that show lower reproducibility than other projection or association bundles such as CST and AF (Figure 2, Table 1). Finally, figure 4 presents the intra and inter-subject variability over the study period. The intra-subject variability is lower than inter-subject variability (0.7% [FA-SLF2] – 13% [isoVF-CC1] vs. 1.8% [MTR-ILF] – 31% [isoVF-CC1]) supporting the high degree of repeatability (Figure 4).Discussion & Conclusion
Across sessions, over all analyzed WM bundles, similar and high correlation patterns are observed between all repeated measures within each model/method. This suggests not only a high reproducibility over time but also redundancy between the different measures. In addition, the high intra-class correlations, and the low overall coefficients of variation between repeated measures suggest a high degree of consistency of WM microstructure metrics across repeated scans. In healthy subjects, these findings suggest consistency over time and redundancy between the different MRI measures. This redundancy could be used to combine different measures with data-reduction approaches can either generate composite measures or by filter measures [12,13]. Thus, these approaches could consider measurements from different models to better characterize the microstructural integrity of WM (axon, myelin sheath, etc.) and would be a promising approach for biomarker identification [2,14]. In conclusion, our work demonstrated moderate to high consistency and reproducibility of diffusion and myelin measures across WM bundles from multi-shell diffusion and inhomogeneous magnetization transfer MRI sequences over time. Finally, our study could also be useful to determine the power/sample size required to reliably detect the changes in brain measures.Acknowledgements
The authors wish to acknowledge the Institutional Université de Sherbrooke Institutional Chair in Neuroinformatics from Pr Descoteaux (www.usherbrooke.ca) and the Mitacs Accelerate program (www.mitacs.ca). We would also like to acknowledge the participants of this study.
References
1. Wiseman, Stewart J., Rozanna Meijboom, Maria del C. Valdés Hernández, Cyril Pernet, Eleni Sakka, Dominic Job, Adam D. Waldman, et Joanna M. Wardlaw. « Longitudinal multi-centre brain imaging studies: guidelines and practical tips for accurate and reproducible imaging endpoints and data sharing ». Trials 20, no 1 (7 janvier 2019): 21.
2. De Santis, Silvia, Mark Drakesmith, Sonya Bells, Yaniv Assaf, et Derek K. Jones. « Why Diffusion Tensor MRI Does Well Only Some of the Time: Variance and Covariance of White Matter Tissue Microstructure Attributes in the Living Human Brain ». NeuroImage 89 (1 avril 2014): 35‑44.
3. Munafò, Marcus R., Brian A. Nosek, Dorothy V. M. Bishop, Katherine S. Button, Christopher D. Chambers, Nathalie Percie du Sert, Uri Simonsohn, Eric-Jan Wagenmakers, Jennifer J. Ware, et John P. A. Ioannidis. « A Manifesto for Reproducible Science ». Nature Human Behaviour 1, no 1 (10 janvier 2017): 1‑9.
4. O’Connor, David, Natan Vega Potler, Meagan Kovacs, Ting Xu, Lei Ai, John Pellman, Tamara Vanderwal, et al. « The Healthy Brain Network Serial Scanning Initiative: a resource for evaluating inter-individual differences and their reliabilities across scan conditions and sessions ». GigaScience 6, no 2 (1 février 2017).
5. Koller, Kristin, Umesh Rudrapatna, Maxime Chamberland, Erika P. Raven, Greg D. Parker, Chantal M. W. Tax, Mark Drakesmith, et al. « MICRA: Microstructural Image Compilation with Repeated Acquisitions ». NeuroImage 225 (15 janvier 2021): 117406.Weijden, Chris W. J. van der, David Vállez García, Ronald J. H. Borra, Patrick Thurner, Jan F. Meilof,
6. Peter-Jan van Laar, Rudi A. J. O. Dierckx, Ingomar W. Gutmann, et Erik F. J. de Vries. « Myelin Quantification with MRI: A Systematic Review of Accuracy and Reproducibility ». NeuroImage 226 (1 février 2021): 117561
7. Theaud G, Houde J-C, Boré A, Rheault F, Morency F, Descoteaux M. TractoFlow: A robust, efficient and reproducible diffusion MRI pipeline leveraging Nextflow & Singularity. NeuroImage. 1 sept 2020;218:116889.
8. Varma, G., O. M. Girard, V. H. Prevost, A. K. Grant, G. Duhamel, et D. C. Alsop. « Interpretation of Magnetization Transfer from Inhomogeneously Broadened Lines (IhMT) in Tissues as a Dipolar Order Effect within Motion Restricted Molecules ». Journal of Magnetic Resonance 260 (1 novembre 2015): 67‑76.
9. Varma, Gopal, Guillaume Duhamel, Cedric de Bazelaire, et David C. Alsop. « Magnetization Transfer from Inhomogeneously Broadened Lines: A Potential Marker for Myelin ». Magnetic Resonance in Medicine 73, no 2 (2015): 614‑22.
10. Rheault F, St-Onge E, Sidhu J, Maier-Hein K, Tzourio-Mazoyer N, Petit L, et al. Bundle-specific tractography with incorporated anatomical and orientational priors. NeuroImage. 1 févr 2019;186:382‑98.
11. Shrout, P. E., & Fleiss, J. L. (1979). Intraclass correlations: Uses in assessing rater reliability. Psychological Bulletin, 86(2), 420–428.
12. Sui, Jing, Rene Huster, Qingbao Yu, Judith M. Segall, et Vince D. Calhoun. « Function–Structure Associations of the Brain: Evidence from Multimodal Connectivity and Covariance Studies ». NeuroImage, Multimodal Data Fusion, 102 (15 novembre 2014): 11‑23.
13. Liang, Sugai, Yinfei Li, Zhong Zhang, Xiangzhen Kong, Qiang Wang, Wei Deng, Xiaojing Li, et al. « Classification of First-Episode Schizophrenia Using Multimodal Brain Features: A Combined Structural and Diffusion Imaging Study ». Schizophrenia Bulletin 45, nᵒ 3 (25 avril 2019): 591‑99.
14. Chamberland, Maxime, Erika P. Raven, Sila Genc, Kate Duffy, Maxime Descoteaux, Greg D. Parker, Chantal M. W. Tax, et Derek K. Jones. « Dimensionality Reduction of Diffusion MRI Measures for Improved Tractometry of the Human Brain ». NeuroImage 200 (15 octobre 2019): 89‑100.
Figures