4454
MR imaging of stroke rats using CEST with an Average Saturation Efficiency Filter (ASEF)
Julius Juhyun Chung1 and Tao Jin1
1University of Pittsburgh, Pittsburgh, PA, United States
1University of Pittsburgh, Pittsburgh, PA, United States
Synopsis
Average Saturation Efficiency Filter (ASEF) is a fast and intuitive technique for achieving CEST imaging with improved sensitivity removing fast exchanges and semi-solid MT background with minimal loss to sensitivity. Our results in MCAO rodents showed that it can detect the ischemic lesion from CEST signal contrasts at 3.6, 2.6, and 2 ppm which may provide different metabolic-related information with higher sensitivity to 3-point measurement at 3.6 ppm and comparable contrast. Its low requirement on number of imaged signals also opens up possibilities for dynamic imaging or signal averaging.
Introduction
CEST MRI signal is usually contaminated by magnetization transfer (MT) from semi-solids and overlapping faster, broad exchanges. Numerous solutions have been proposed to remove confounding effects but these methods often either increase acquisition time or sacrifice sensitivity1-4. We proposed an Average Saturation Efficiency Filter (ASEF) for CEST imaging (detailed theory presented in another abstract). This method uses two pulse trains with similar average saturation power but highly unequal duty cycles, so that saturation transfer effects from fast chemical exchange species and semisolid macromolecules are similar between the two pulse trains, but drastically different for slow exchange species. Thus, their difference becomes an exchange rate filter suppressing MT and fast exchange signals. In this study, we demonstrate the implementation of ASEF imaging in vivo in the rat brain and examine its sensitivity in detecting ischemia in rats with Middle Cerebral Artery Occlusion (MCAO).Methods
Imaging of MCAO rats (n=6) was performed 3-4 hours post-operation using 4-s saturation preparation with average B1=0.80 μT applied at 36 offsets (0-6 ppm) comprising either a Continuous Wave (CW) pulse or a train of 25 binomial pairs of Gaussian pulses with kurtosis of 4 with duration=24 ms and pulse interval=136 ms, yielding a duty cycle (DC) of ~15%. Two slice spin-echo EPI was read-out: matrix size= 80×80, field of view= 32×32 mm, slice thickness= 2 mm, TR= 7 s and TE= 20 ms. It has been reported that the MT signal can be slightly different for two saturations with the same average B1 power but highly unequal DCs5. Thus, MT matching was performed to determine a small fudge factor for the low DC pulse train, so as to minimize this residue MT effect. CEST maps were obtained with CW at 5.5 ppm with fixed B1=0.80 μT as well as with a binomial pair pulse train where average B1 was modulated by a fudge factor between 0 and ± 3.6% in 0.4% increments. Signal from ROIs of normal tissue saturated by CW was compared to the pulse train, linearly interpolating to find the fudge factor that matches the two signals. Any remnant baseline difference at 5-6 ppm was subtracted directly from ASEF signals across offsets. CEST signals were calculated as follows: ASEFΩ= SΩ,low DC/S0,low DC–SΩ,CW/S0,CW where Ω is frequency offset, low DC refers to saturation by low duty cycle binomial pulse train, and S0 images were acquired at 300 ppm; and APT*= ((S4.2ppm+S3.0ppm)/2-S3.6ppm)/S06.Results
The positive offsets of the Z-spectra averaged over animals are shown for ROIs selected from the contralesional hemisphere (Fig.1a) and from infarcts (Fig.1b). The CW and low DC spectra closely matched at >5 ppm and show peaks around the amide (~3.6 ppm), guanidyl (~2 ppm), and phosphocreatine signal (2.6 ppm). ASEF signals (Fig.1c) at 3.6 ppm, 2 ppm, and 2.6 ppm in the contralateral/lesion were about 2.9%/1.6%, 2.3%/2.2%, and 2.0%/1.1%, respectively. APT* and 3.6 ppm ASEF (APTASEF) calculated from the spectra averaged over the lesion/contralateral (Fig.1d) were 1.21±0.4%/2.43±0.1% and 1.6±0.4%/2.9±0.4%, respectively. Maps of an exemplary rodent were compared for ADC, APTASEF, APT*, ASEF at 2.0 ppm, and ASEF at 2.6 ppm (Fig.1e). There was comparable contrast for APTASEF and APT* between ischemic and normal tissue with ASEF maps at 2.0 ppm showing limited contrast between the lesion and normal tissue while 2.6 ppm maps clearly depicting the lesion. There is heterogeneity in the lesion for 2.0 ppm with hypointensity corresponding to deeper hypointensity at 2.6 and 3.6 ppm and hyperintensity corresponding to reduced hypointensity.Discussion
The 3-point method has been used to measured APT with good sensitivity and specificity, but it requires high field so that the 3.6 ppm amide peak is distinct. It is also difficult to apply at 2.6 ppm where the peak of PCr is small, and at the 2 ppm guanidyl group where direct water saturation is large. Using a high DC pulse train or CW to effectively saturate the labile protons and a low DC pulse train as the baseline, ASEF can be acquired at the Larmor frequency of a labile proton. ASEF showed similar contrast to 3-point measurement with increased signal sensitivity. ASEF showed larger inter-animal variation, likely due to MT matching introducing an additional factor of variability. As actual variation in matching was within a few percent of the B1 peak power, standardizing the match across animals could reduce variation with limited detriment on the accuracy of ASEF signal. The close signal for ASEF at 2 ppm in the lesion and contralateral was likely due to the exchange rate tuning effect at 0.80 μT7.Conclusion
ASEF is a fast and intuitive technique for achieving CEST imaging with improved sensitivity removing fast exchanges and semi-solid MT background with minimal loss to sensitivity. Our results showed that it can detect the ischemic lesion from CEST signal contrasts at 3.6, 2.6, and 2 ppm which may provide different metabolic-related information. Its low requirement on number of imaged signals also opens up possibilities for dynamic imaging or signal averaging.Acknowledgements
This work is supported by NIH grant NS100703.References
- Zaiss M, et al. J Magn Reson 2011;211(2):149-55.
- Zu Z, et al. Magn Reson Med 2013;69(3):637-647.
- Xu X, et al. Magn Reson Med 2016;75(1):88-96.
- Chen L, et al. Magn Reson Med 2019;81(1):69-78.
- Varma G, et al. J Magn Reson 2018;296:60-71.
- Jin T, et al. Magn Reson Med. 2013; 69(3): 760–770.
- Jin T. et al. Neuroimage. 2017; 157: 341–350.
Figures
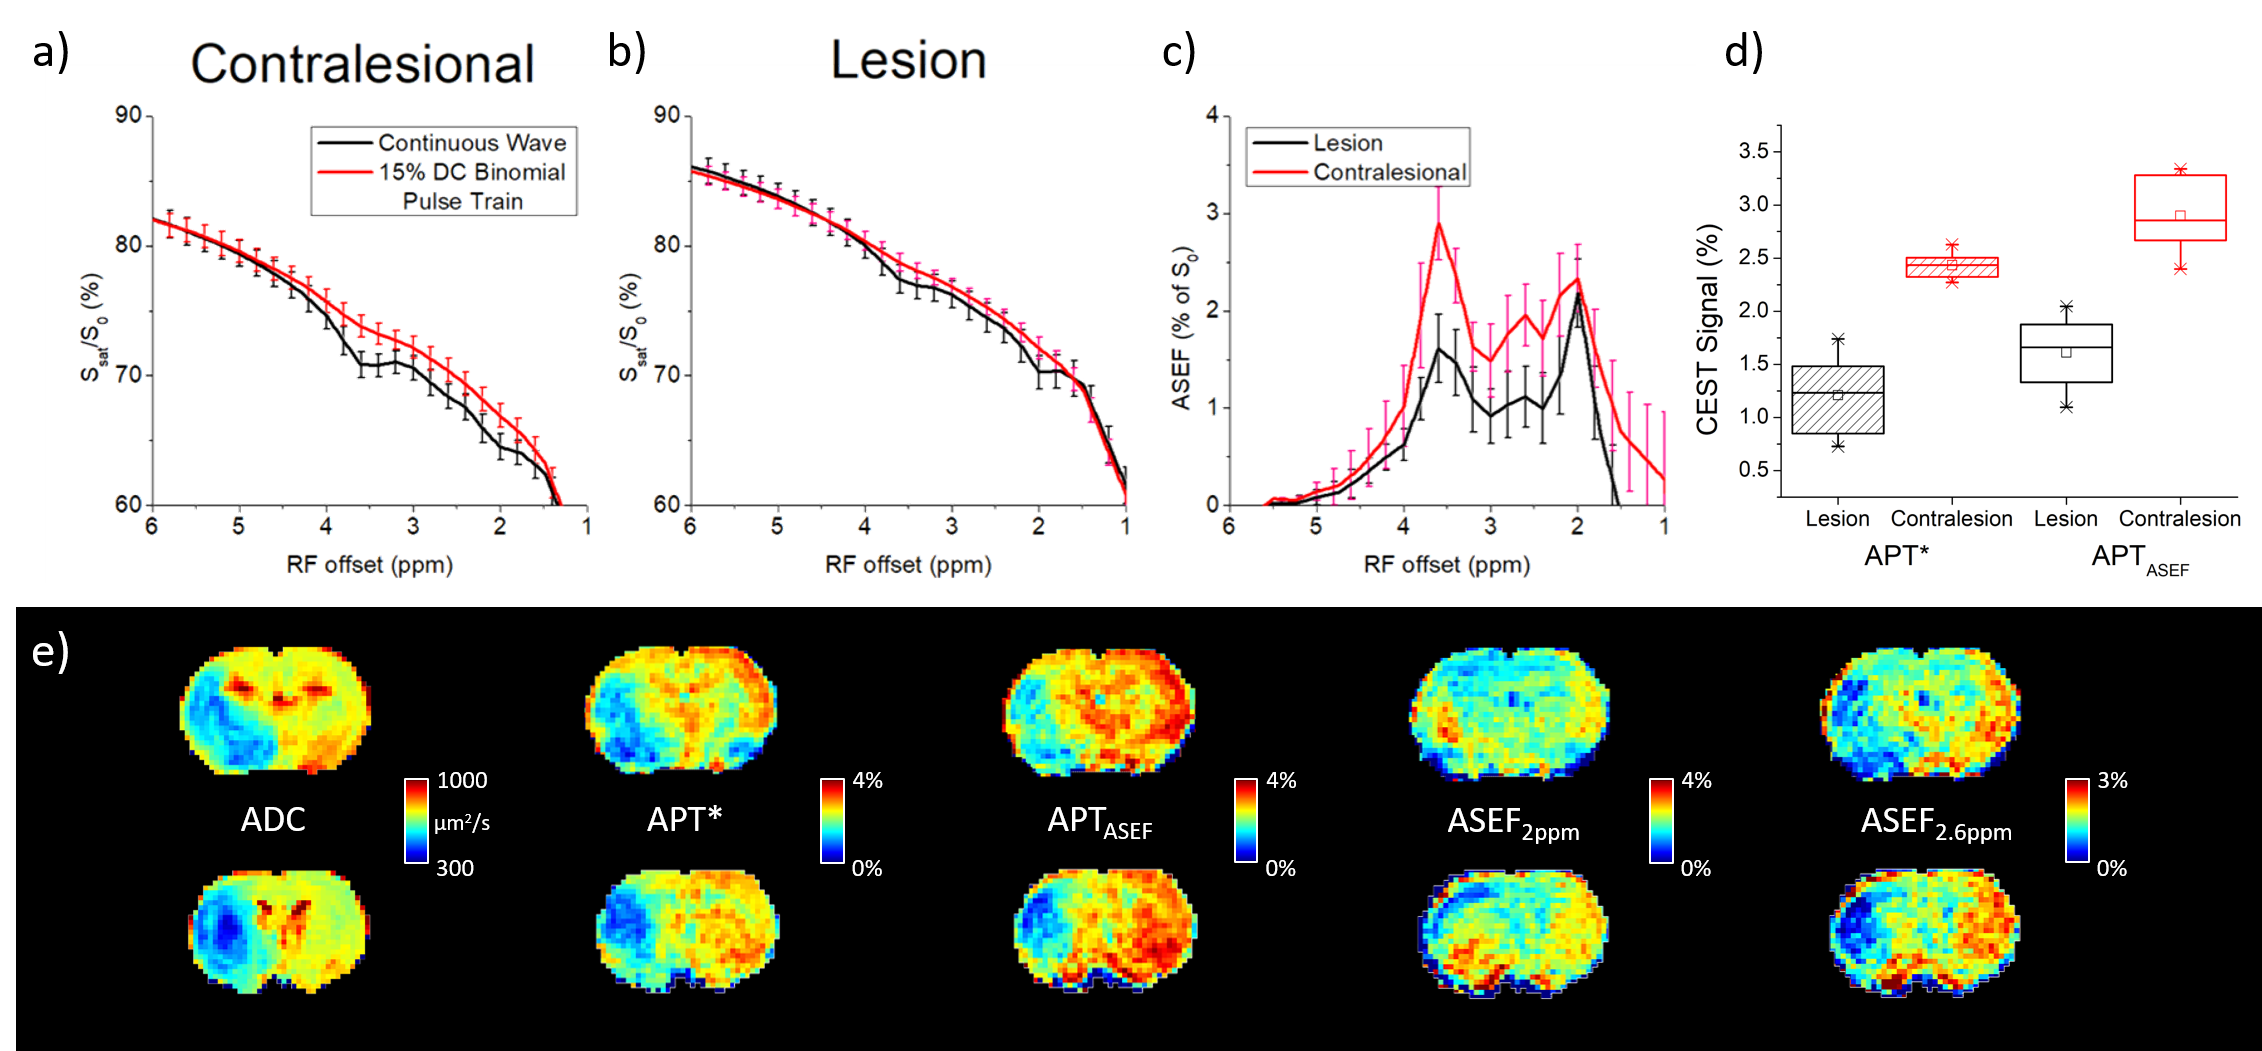
Figure 1. ASEF
CEST averaged over six rats with MCAO.
The Z-spectra from 1-6 ppm from an ROI in the contralateral (a) and infarcted tissue (b).
The difference between the two spectra (ASEF) shows distinct peaks at 2
ppm, 2.6 ppm, and 3.6 ppm (c). Comparison
of APT* and ASEF maps at 3.6 ppm (APTASEF) across rodents are shown via boxplot (d). Maps of an exemplary rodent for
ADC, APT*, APTASEF, ASEF at 2 ppm, and ASEF
at 2.6 ppm (e).
DOI: https://doi.org/10.58530/2022/4454