4451
Determining the conditions for robust acidoCEST MRI to measure extracellular pH in tumors in vivo
Rohan S. Virgincar1, Kai H. Barck1, Mary Ann Go2, Geoffrey Del Rosario2, Shang-Fan Yu2, ManKin Choy1, Alvin Gogineni1, Justin Elstrott1, Herman S. Gill1, Jan Marik1, Genee Lee2, Mark D. Pagel3, Alex de Crespigny4, Teemu T. Junttila5, Christoph Spiess6, Robby M. Weimer1, and Luke Xie1
1Biomedical Imaging, Genentech, South San Francisco, CA, United States, 2Translational Oncology, Genentech, South San Francisco, CA, United States, 3Department of Cancer Systems Imaging, University of Texas MD Anderson Cancer Center, Houston, TX, United States, 4Early Clinical Development, Genentech, South San Francisco, CA, United States, 5In Vivo Pharmacology, Genentech, South San Francisco, CA, United States, 6Antibody Engineering, Genentech, South San Francisco, CA, United States
1Biomedical Imaging, Genentech, South San Francisco, CA, United States, 2Translational Oncology, Genentech, South San Francisco, CA, United States, 3Department of Cancer Systems Imaging, University of Texas MD Anderson Cancer Center, Houston, TX, United States, 4Early Clinical Development, Genentech, South San Francisco, CA, United States, 5In Vivo Pharmacology, Genentech, South San Francisco, CA, United States, 6Antibody Engineering, Genentech, South San Francisco, CA, United States
Synopsis
AcidoCEST MRI is a promising technique to directly measure extracellular pH in vivo and is well-suited to imaging tumors, which can exhibit acidosis. However, few studies have demonstrated the conditions and the minimum contrast agent concentrations needed for robust acidoCEST MRI. In this study, we employed micro-CT to determine the uptake of iopamidol in tumors with intratumoral and intravenous delivery of isovue-370, estimated the accuracy of pH measured by MRI vs. a pH meter, demonstrated the minimum iopamidol concentration required for acidoCEST MRI, and reported pH measurements in different tumor xenograft models.
Introduction
AcidoCEST MRI is a promising non-invasive technique to directly measure extracellular pH in vivo by virtue of pH-dependent changes in the CEST signal from amide protons in injectable agents like iopamidol1. This technique has a potential application in oncology to assess tumor pH considering that the Warburg effect can lead to tumor acidification2. Therefore, the ability to measure tumor pH can allow for a better understanding of the microenvironment and unique conditions in which therapeutics can be more effective. Currently, there are only a handful of studies evaluating acidoCEST MRI in clinical settings and animal models of cancer. A major limitation is the limited demonstration of robust acidoCEST signal in vivo, the minimum agent concentration required, and paired CT data to confirm concentration levels. In this study, our goal was to experimentally determine the settings required for successful and robust in vivo acidoCEST MRI and to measure pH in different tumor xenograft models.Methods
All animals were dosed and monitored according to the guidelines from the IACUC at Genentech, Inc.Micro-CT
Micro-CT (MILabs U-CTUHR) with an injection of isovue-370 (Bracco Diagnostics) was used to determine the local concentration of iopamidol in the tumor, using two different injection protocols: 1) intratumoral injection of 50µl; 2) intravenous bolus of a 300µl followed by infusion of 200µl over 30 minutes. Micro-CT included 1 whole body pre-injection scan, and 8 post-injection scans 4-minutes apart to capture the evolution of iopamidol concentration over a similar duration of the acidoCEST MRI acquisition.
MRI
MRI was done on a Bruker BioSpec 7T with a cryogenically-cooled receive-only surface array coil, and an 86-mm transmit volume coil. AcidoCEST MRI employed the parameters in Figure 5. Pixelwise pH was calculated by fitting the CEST z-spectra using Bloch McConnel equations modified to substitute pH for chemical exchange rates as a fitting parameter3.
In vitro acidoCEST MRI was performed on 16 iopamidol solutions of pH 6.1-7.5 (“pH phantom”) and compared with measurements from a calibrated pH meter. To estimate the minimum required concentration, a phantom comprised of 7 different concentrations of iopamidol (“concentration phantom”) was used.
In vivo acidoCEST MRI was conducted with intratumoral injection in 5 tumor xenograft models (KP4, KP4-CA9, KPL-4, MMTV-HER2.tg, KPR3070), and intravenous infusion in 2 models with highly vascularized tumors (SW480, 786-O). The same injection protocol as with micro-CT was used.
Results and Discussion
Micro-CTFigure 1A shows micro-CT images post-injection of isovue-370 via intratumoral or intravenous delivery, and Figure 1B shows histograms of the iopamidol concentration within the tumors. Intratumoral injection yielded a concentration of 125.3±110.2mM, whereas intravenous delivery yielded 20.6±7.0mM and 22.1± 5.7mM in the two models. Figure 1C shows the temporal evolution of the iopamidol concentration. The average concentration after intratumoral delivery was initially ~200mM and decreased to ~100mM at the final time point. The large error bars indicate a highly heterogenous distribution. With intravenous delivery, the highest concentration was only ~25mM.
MRI
Figure 2A shows the acidoCEST MRI pH map in the pH phantom. MRI pH values were highly correlated with pH meter measurements (Figure 2B, r=0.98), but tended to be lower with a mean difference of –0.14. Therefore, the equation of the linear regression line was used to re-calibrate pH.
Figure 2C shows CEST z-spectra in the concentration phantom. The CEST resonances were only visible at concentrations >=10mM. This limit would be higher in vivo due to biological noise, susceptibility-induced spectral broadening, and heterogeneous uptake of the agent by the tumor.
Figure 3 shows in vivo acidoCEST MRI pH measurements and representative pH maps in different tumor xenografts after intratumoral delivery of isovue-370. The KPR3070 model exhibited the lowest pH, which could hypothetically be attributed to elevated glycolytic rate. Another notable finding was that the coefficient of variation of the pH in the KP4-CA9 model (overexpressed Carbonic Anhydrase IX) was the lowest among all tumors.
Figure 4 shows representative CEST z-spectra in a 100mM iopamidol solution (A), and in tumors with isovue-370 delivered intratumorally (B) and intravenously (C). Whereas the CEST resonances are clearly visible in the solution and intratumoral examples, they are inconspicuous in the intravenous example. This implies that even at our large intravenous infusion volume of 500µl, the average tumor concentration of ~20mM is most likely insufficient for in vivo acidoCEST MRI. In fact, only 50% of the animals imaged with intravenous delivery had >50% pixels in the tumor with sufficient signal for pH analysis.
Conclusion
We have demonstrated that acidoCEST MRI can be a robust technique to measure extracellular pH in vivo when delivered intratumorally. Moreover, we demonstrated that tumors can exhibit acidosis when considering the dynamic range of pH values in relation to different tumor xenografts and overexpression of CA9. However, a significant limitation of the technique is the low tumor concentration of iopamidol when delivered intravenously, which limits applications in orthotopic and metastases models where intratumoral injections are not practical. For clinical MRI studies, these high concentrations and doses might be very difficult to achieve. Under ideal conditions and highly vascularized tumors, pH measurements with acidoCEST MRI might be attainable. CT imaging could mitigate some risks by first understanding the concentrations and tumor heterogeneity prior to acidoCEST MRI.Acknowledgements
No acknowledgement found.References
- Anemone A, Consolino L, Arena F, et al. Imaging tumor acidosis: a survey of the available techniques for mapping in vivo tumor pH. Cancer and Metastasis Reviews. 2019;38:25–49
- Liberti MV, Locasale JW. The Warburg Effect: How Does it Benefit Cancer Cells? Trends Biochem Sci. 2016;41(3):211-218
- Liu G, Li Y, Sheth VR and Pagel MD. Imaging In Vivo Extracellular pH with a Single Paramagnetic Chemical Exchange Saturation Transfer Magnetic Resonance Imaging Contrast Agent. Molecular Imaging. 2012;11(1):47–57
Figures
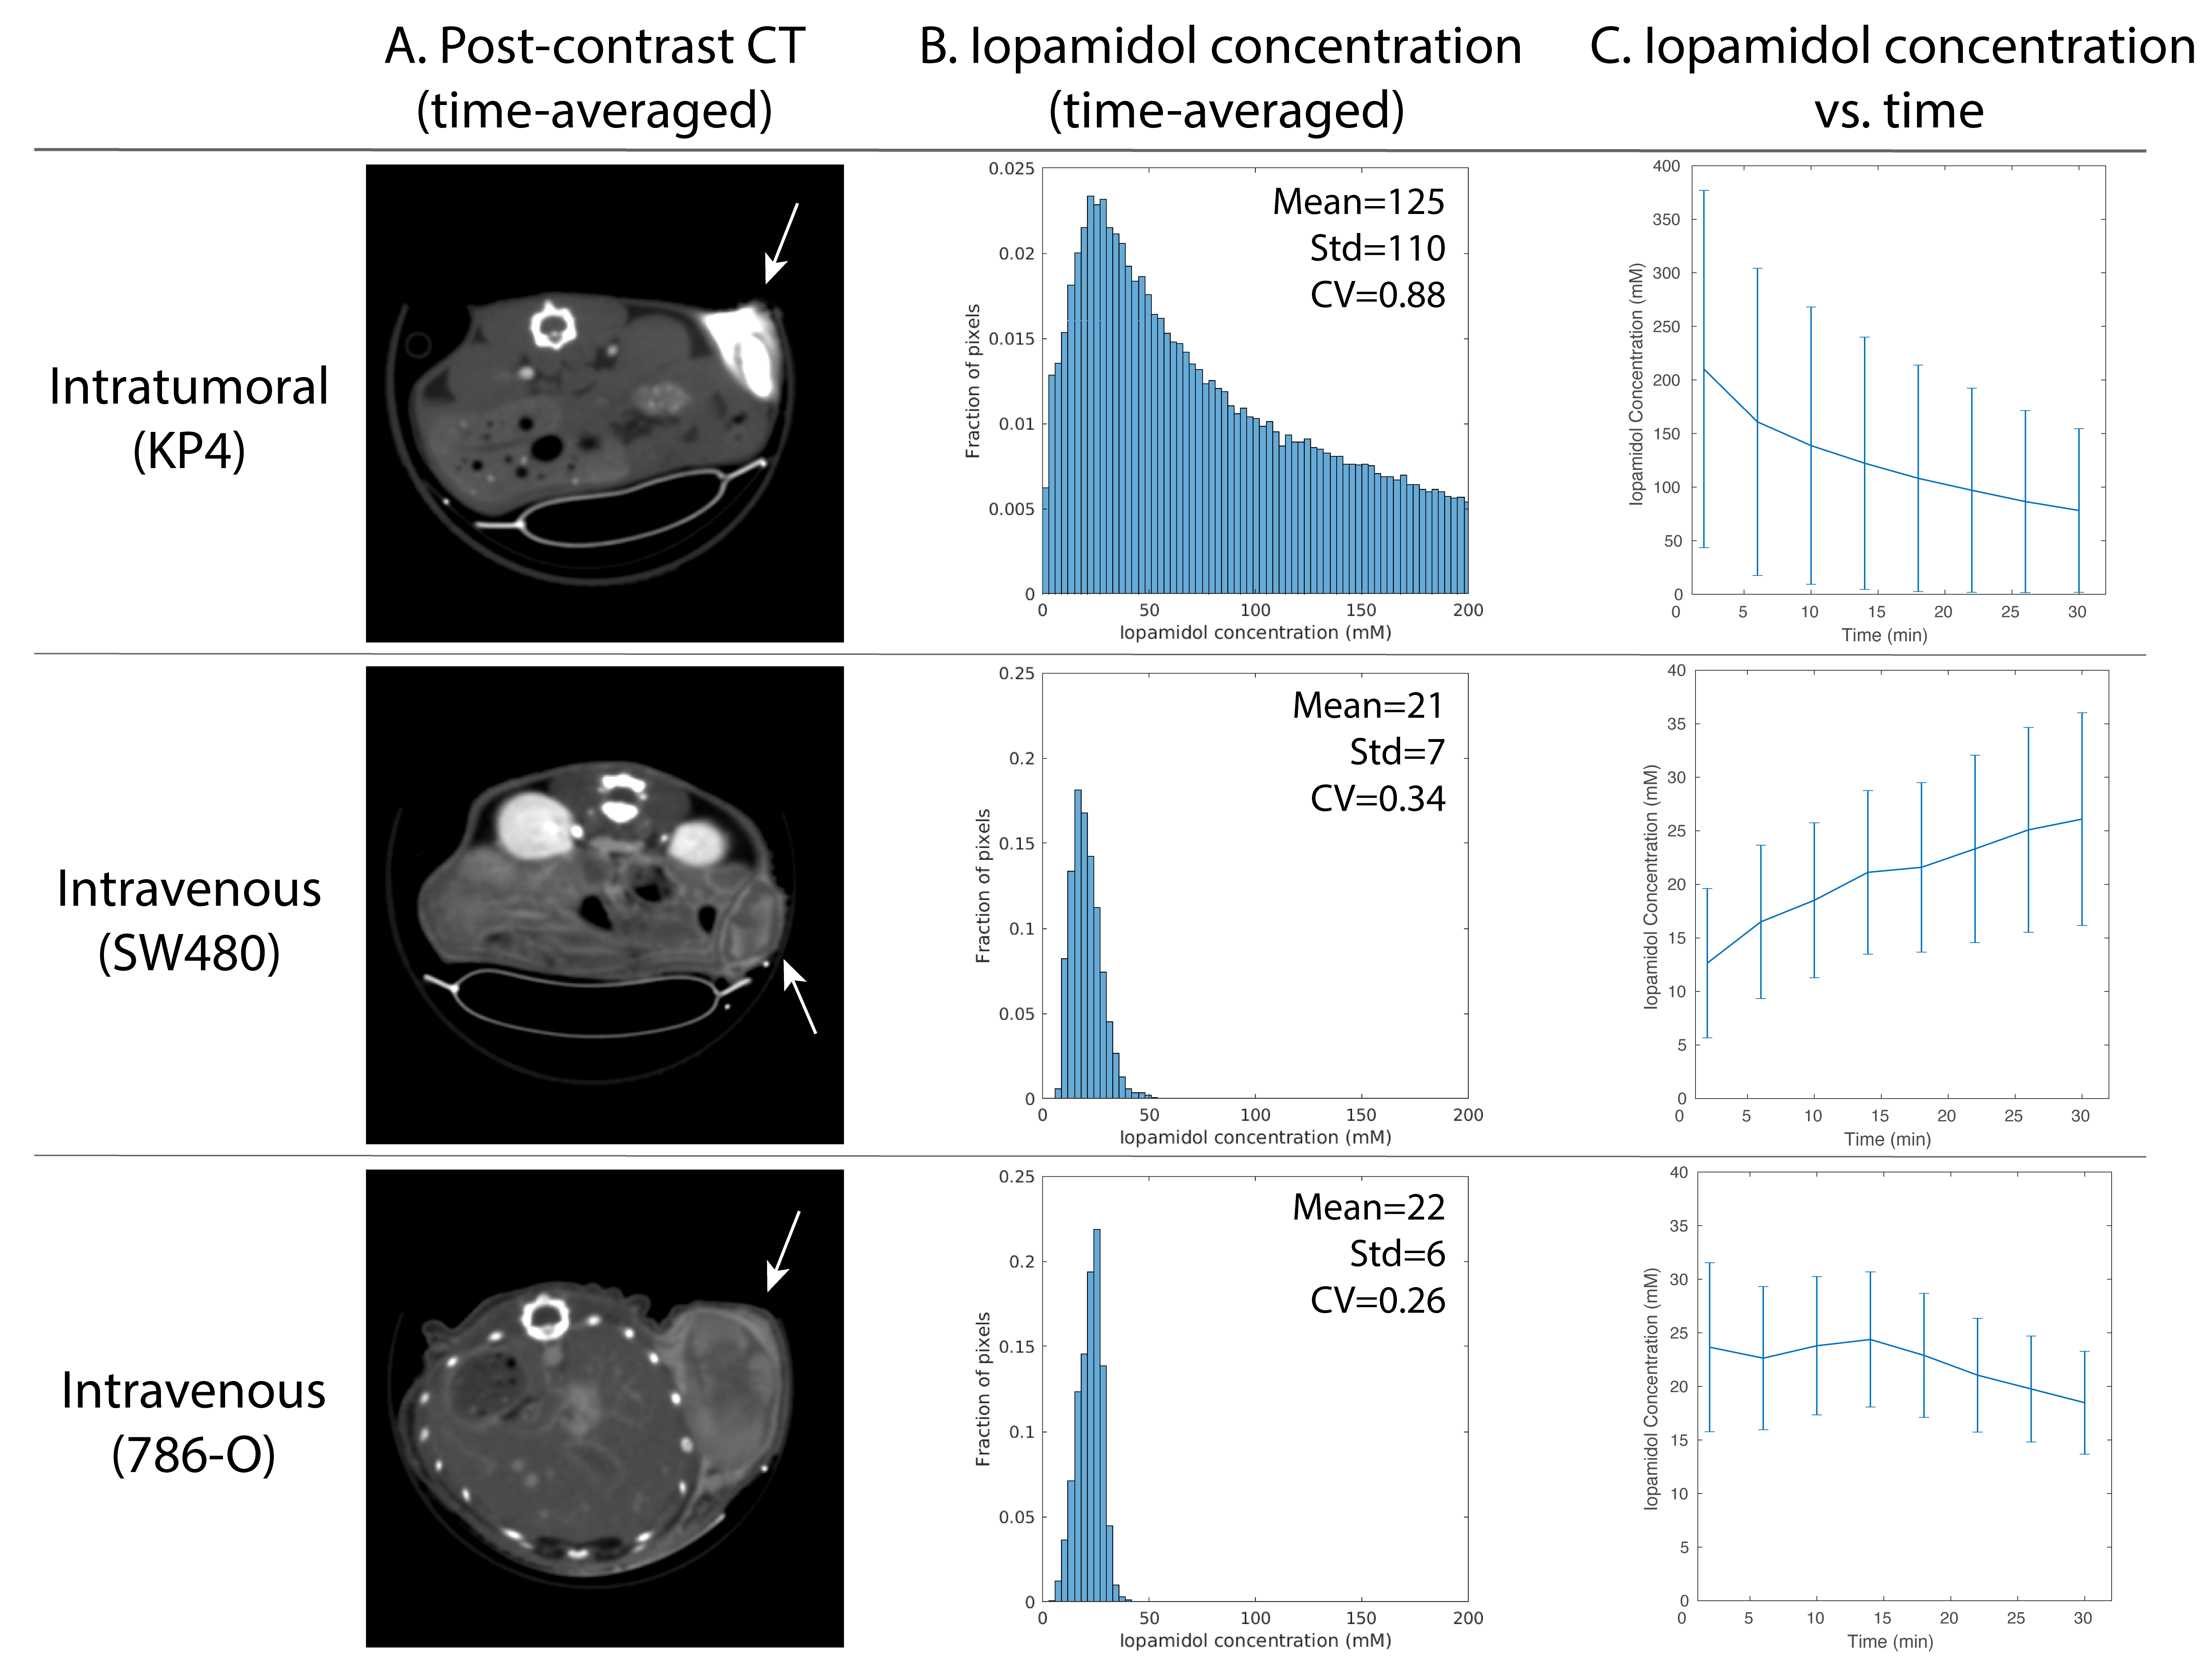
A. Representative time-averaged micro-CT images in different tumor xenograft models after injection of isovue-370 via intratumoral (top) or intravenous delivery (middle, bottom). B. Time averaged histograms of the iopamidol concentration. C. Dynamic micro-CT imaging at 4-minute temporal resolution shows evolution of iopamidol concentration (mean and standard deviation).
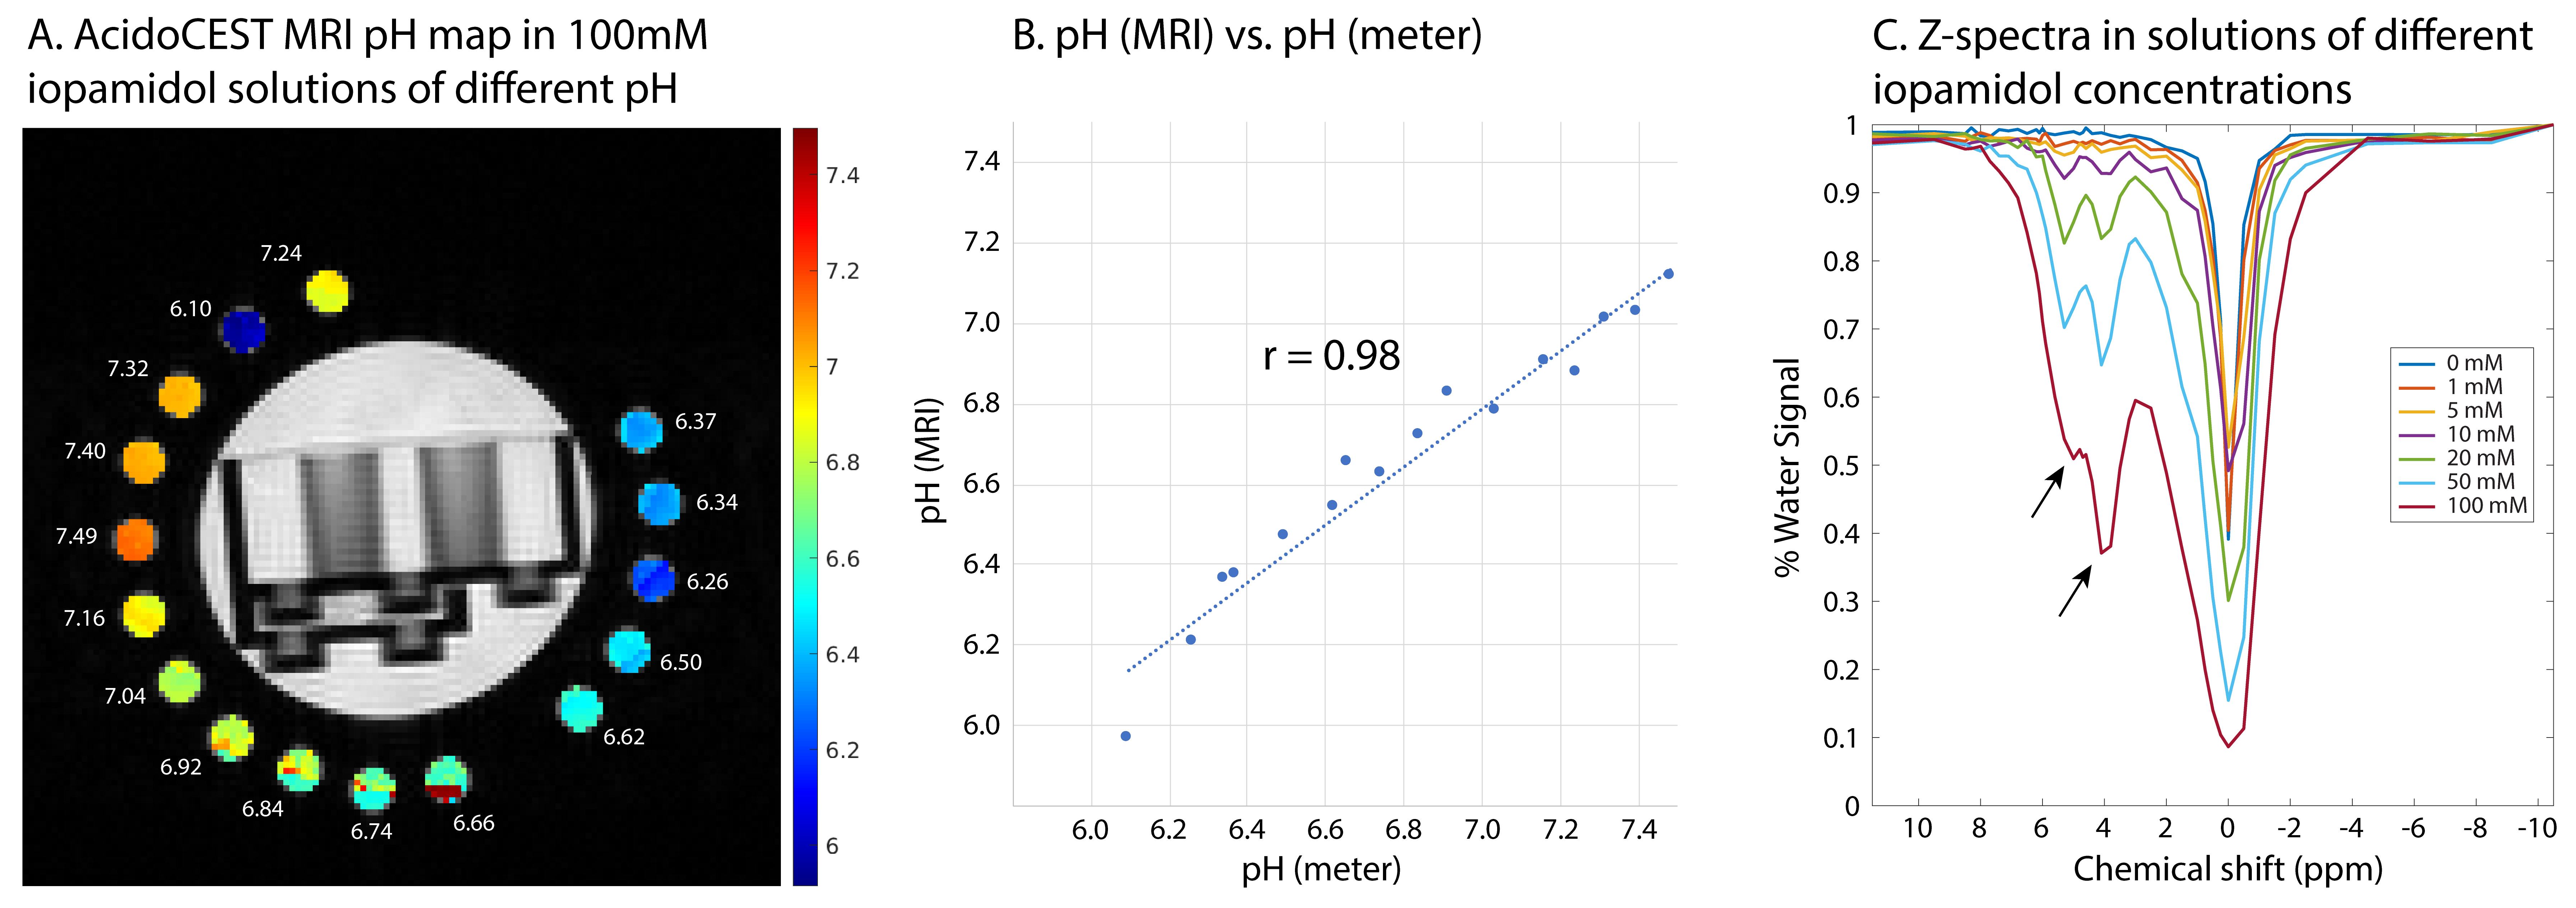
A. pH map of 100-mM iopamidol solutions of pH 6.1-7.5. Values in white are measurements by a calibrated pH meter. B. Correlation between pH determined with acidoCEST MRI (median values) and pH meter was excellent (r = 0.98). C. CEST z-spectra showed that the resonances at 4.2 and 5.6 ppm were only visible at concentrations >=10mM.
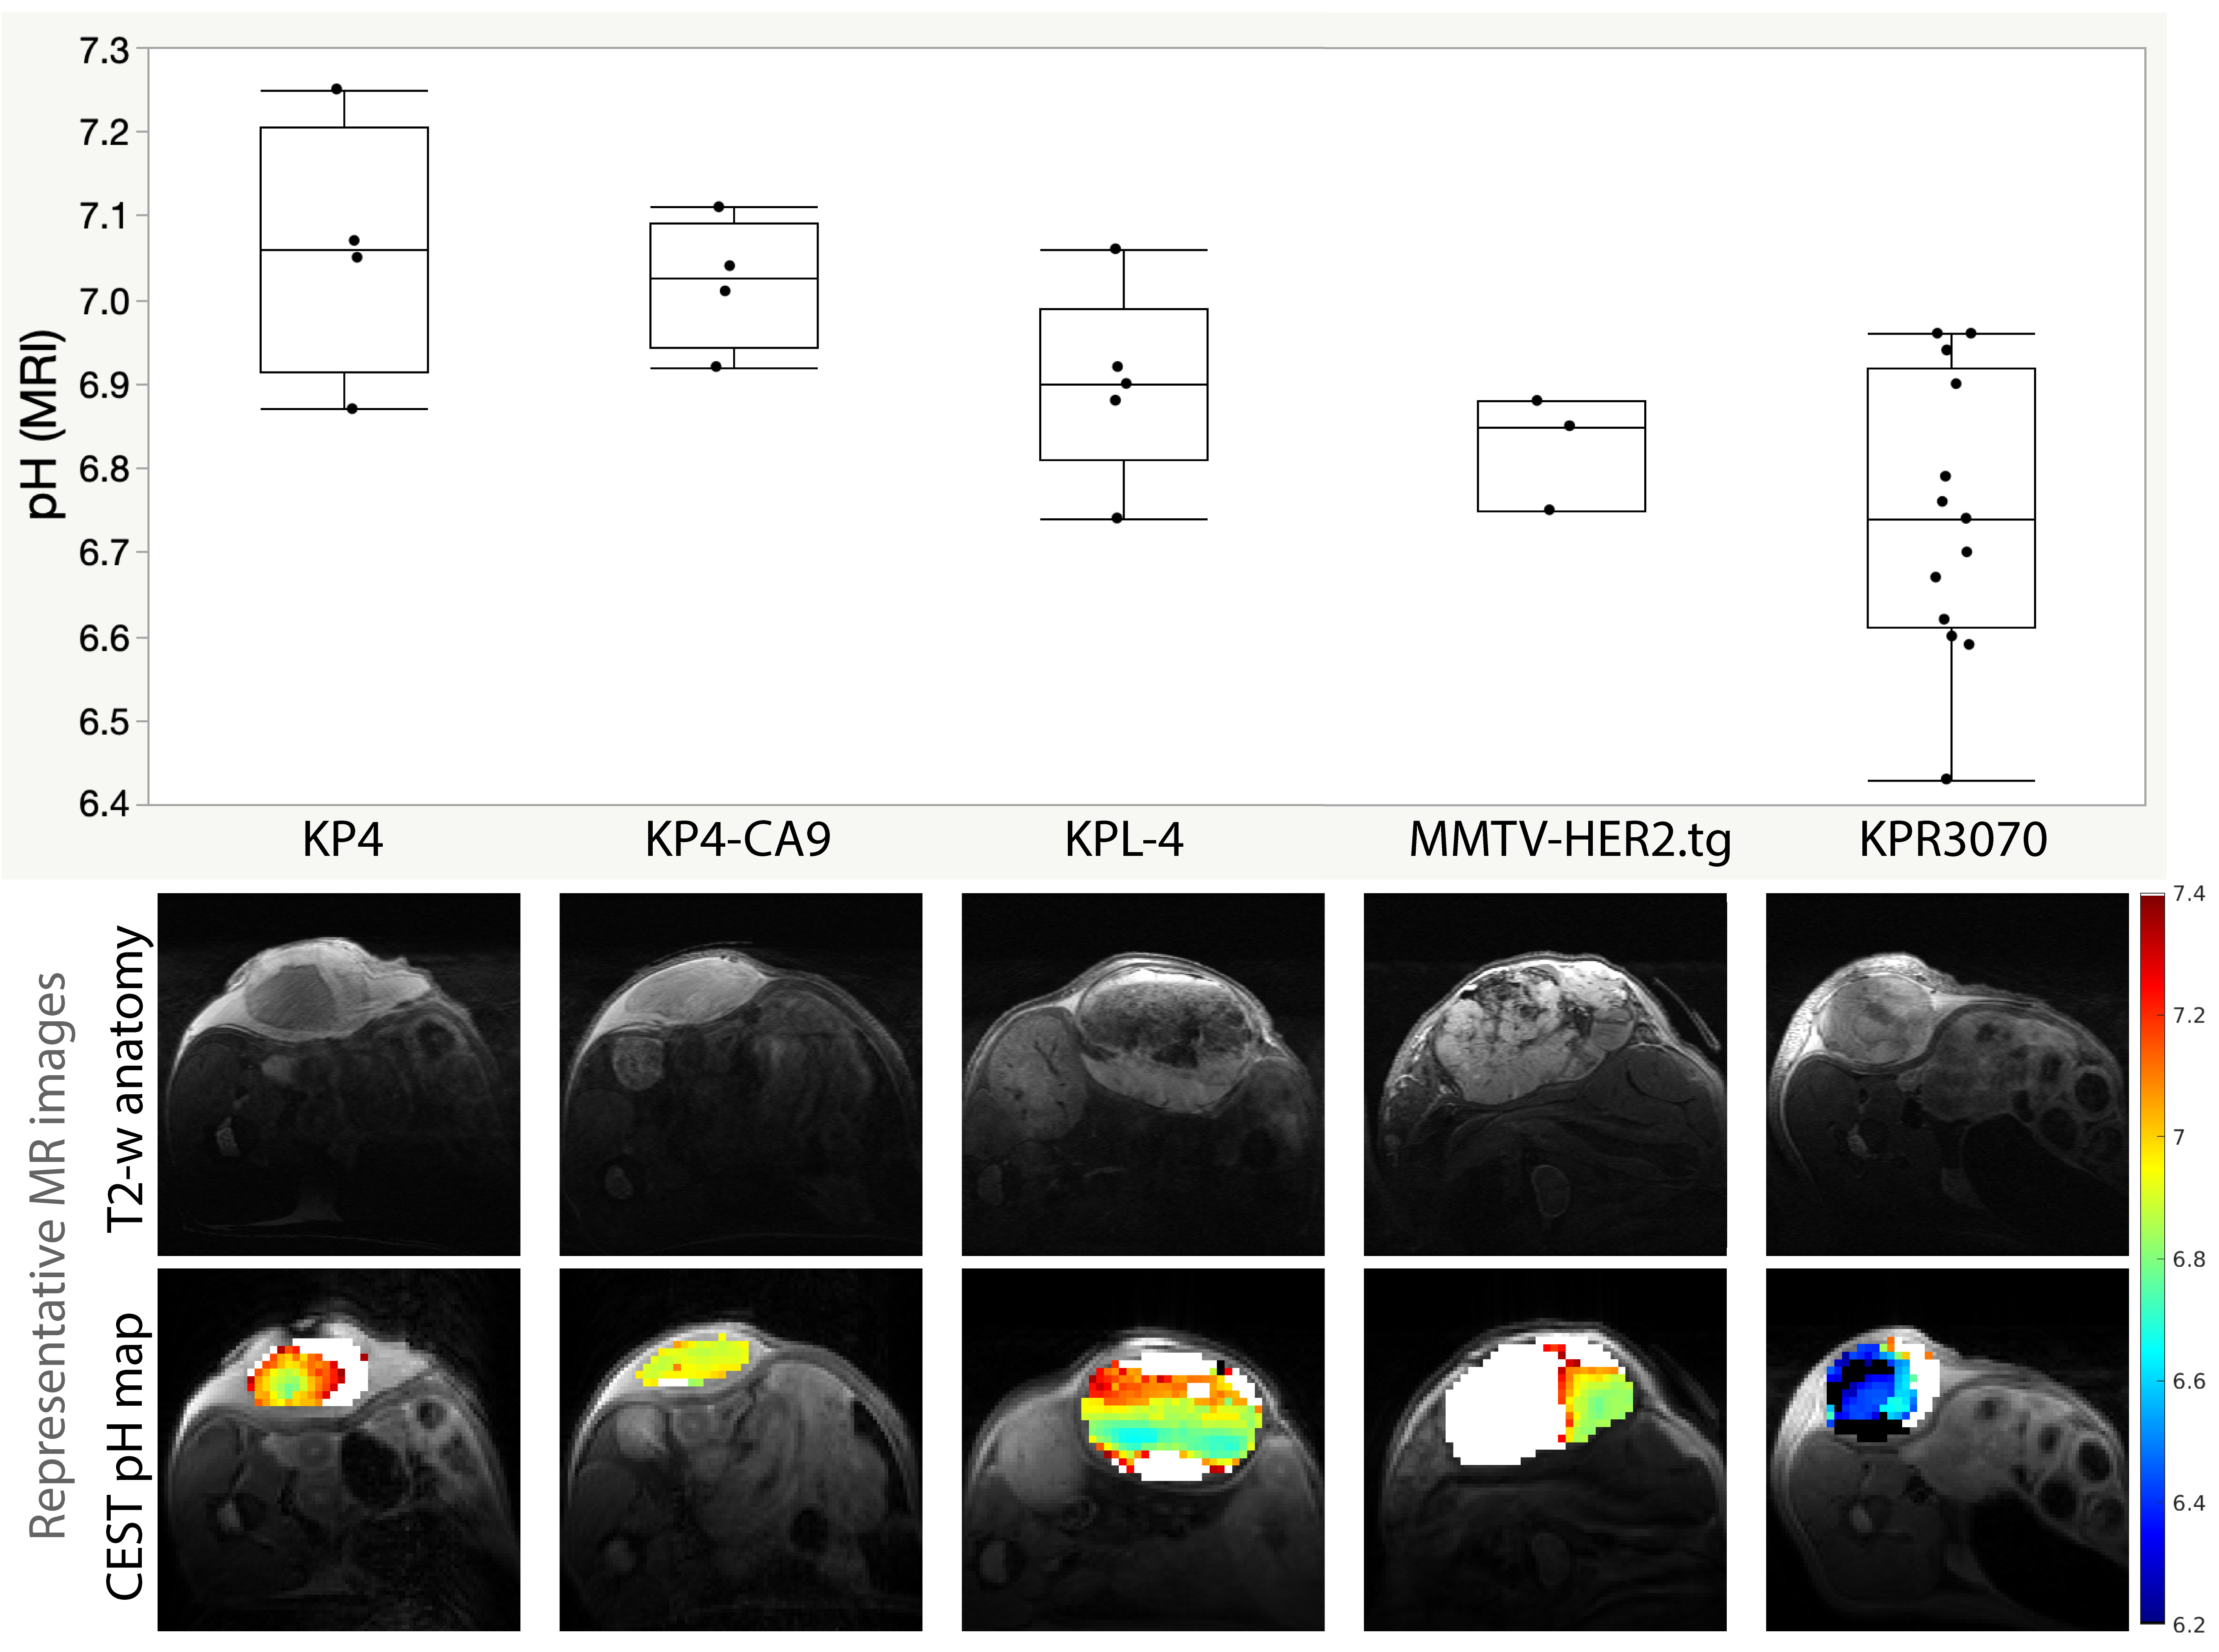
In vivo acidoCEST MRI in 5 different tumor xenograft models (KP4, n=4; KP4-CA9, n=4; KPL-4, n=5; MMTV-HER2.tg, n=3; KPR3070, n=13) with intratumoral delivery of isovue-370. Box and whisker plots show the median pH in the tumor. Also shown are acidoCEST MRI pH maps and slice-matched anatomical T2-weighted images. pH measurements <6.2 and >7.4 were discarded due to lack of CEST spectral information at these values.
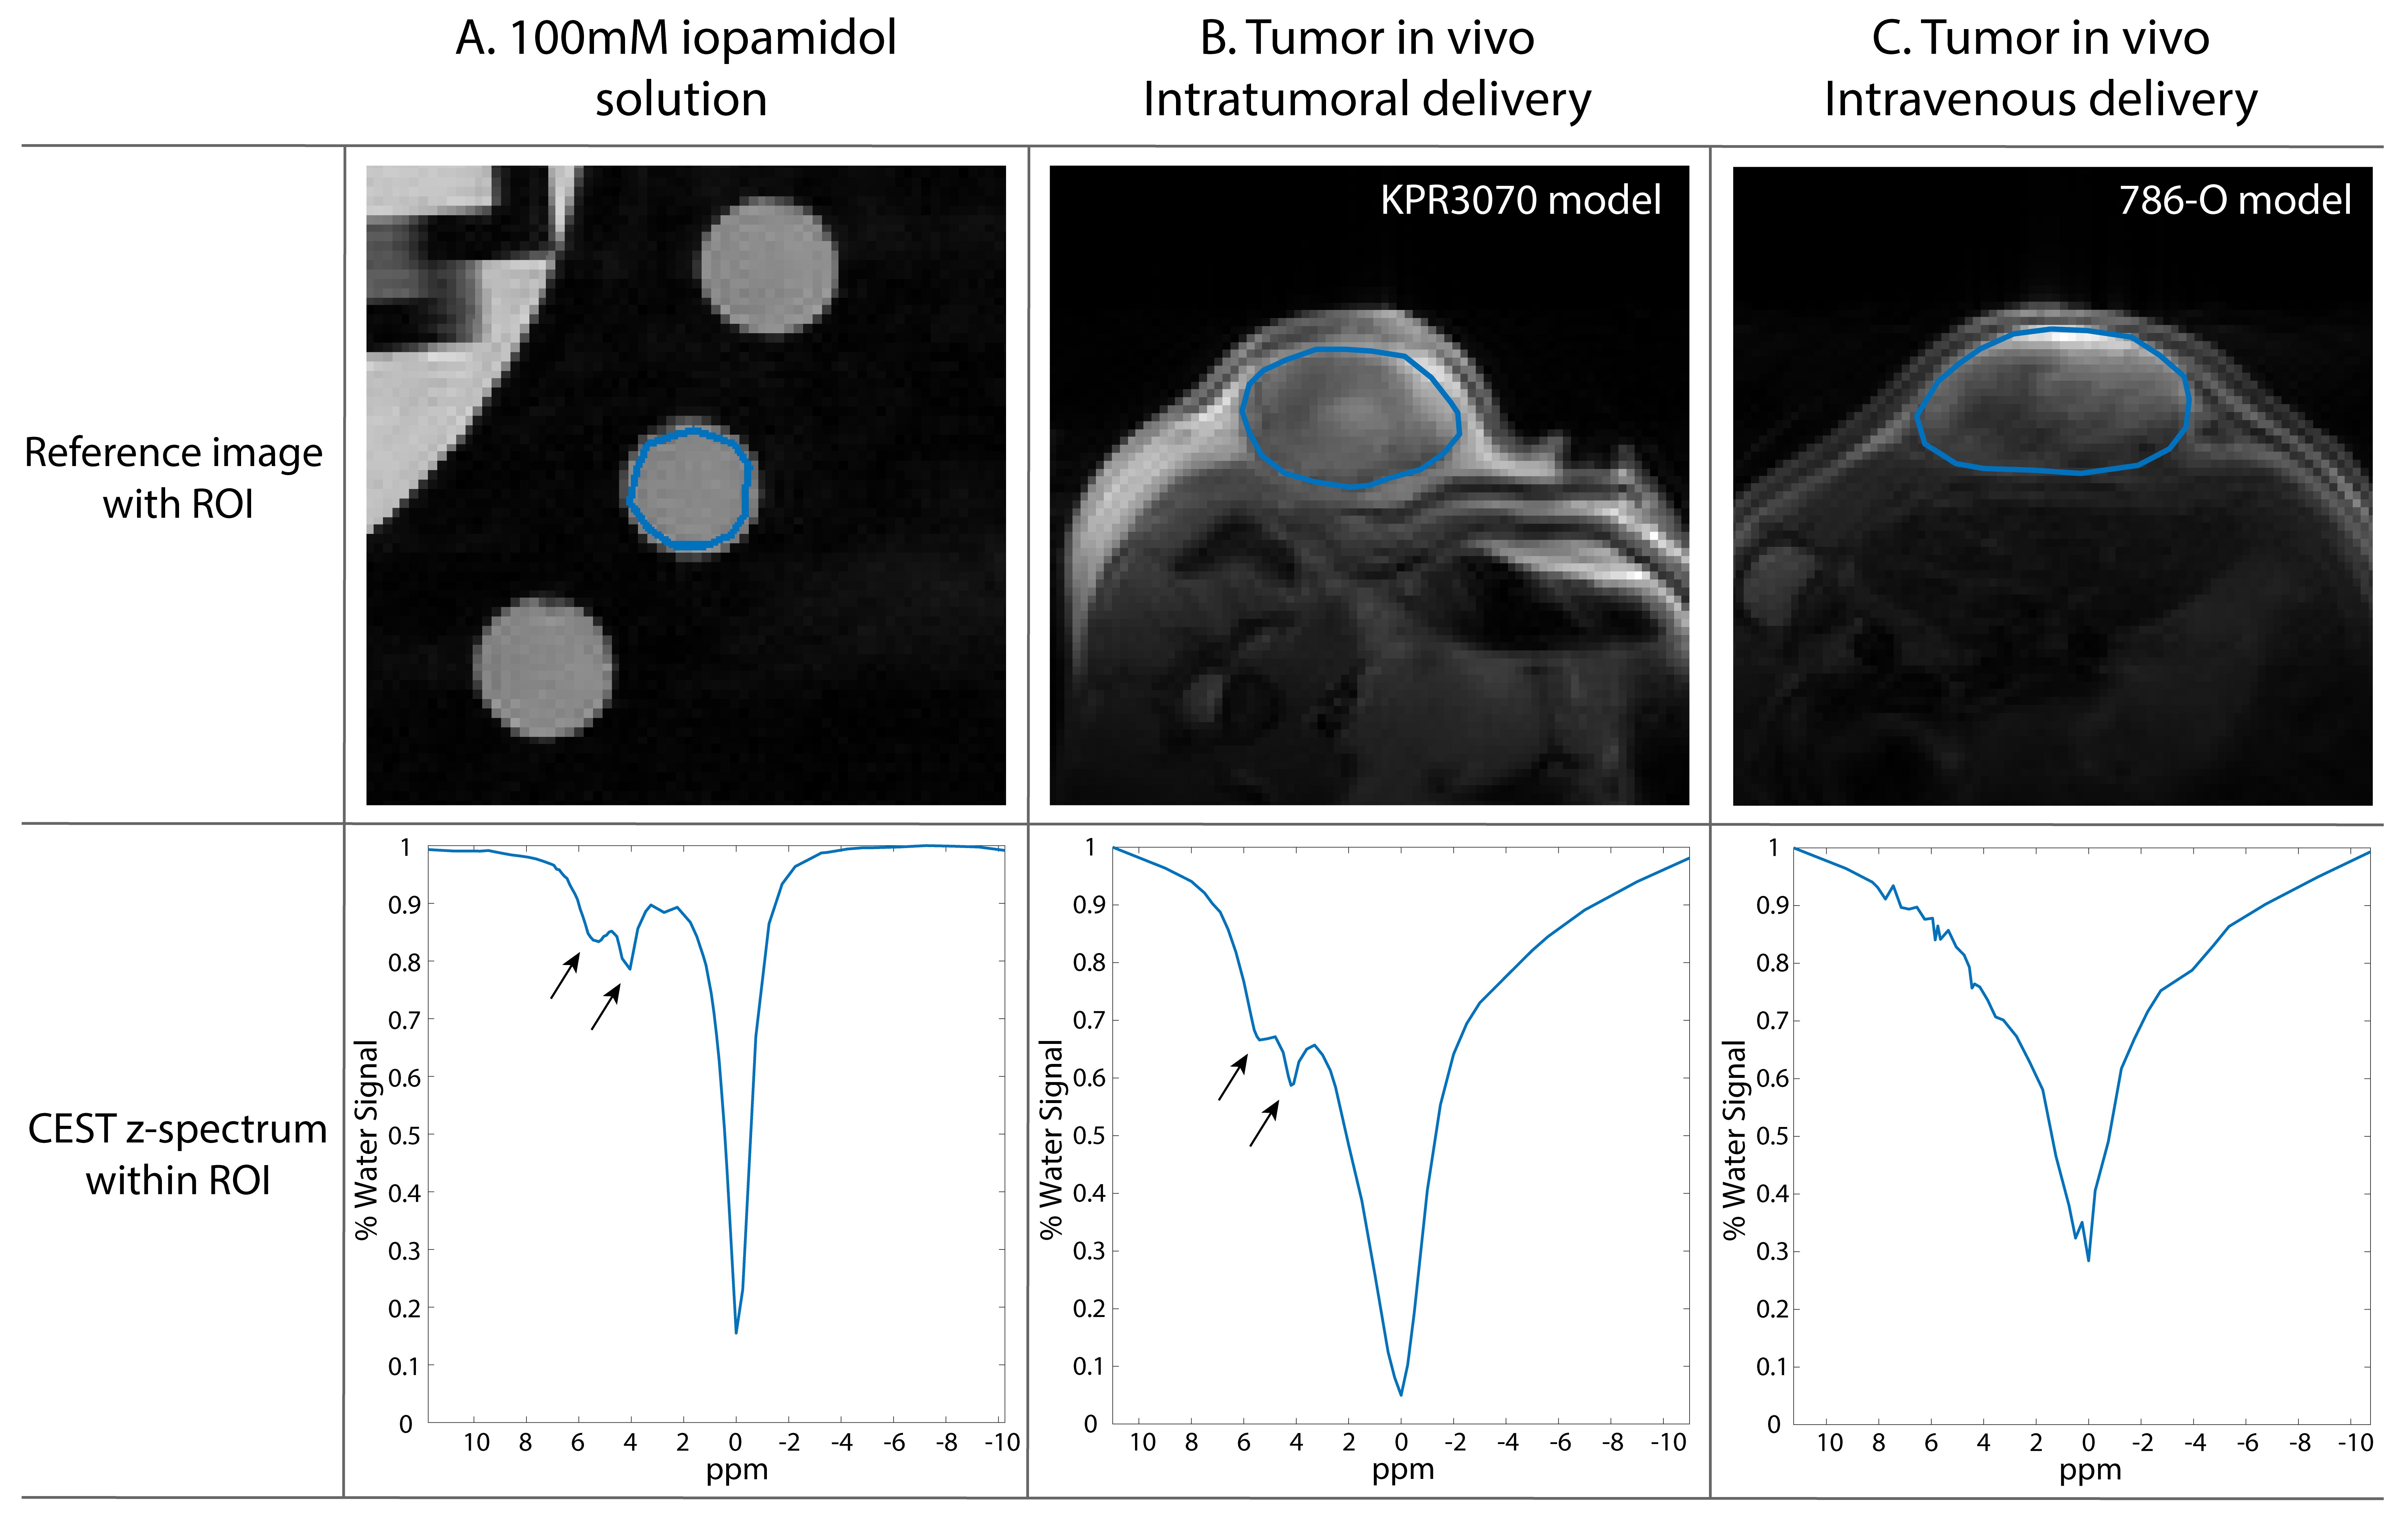
T2-weighted reference images and CEST z-spectra in a 100-mM iopamidol solution (A), and in tumors in vivo with intratumoral (B) and intravenous (C) delivery of isovue-370. The CEST resonances at 4.2 and 5.6 ppm are apparent in A and B, but are inconspicuous in C.

AcidoCEST MRI parameters
DOI: https://doi.org/10.58530/2022/4451