4448
High-Performance 0.55T Supports Contrast-Optimal SMS bSSFP Cardiac Imaging1Ming Hsieh Department of Electrical and Computer Engineering, University of Southern California, Los Angeles, CA, United States, 2Siemens Medical Solutions USA, Inc., Los Angeles, CA, United States, 3Biomedical Engineering, University of Southern California, Los Angeles, CA, United States
Synopsis
Balanced steady-state free precession (bSSFP) cardiac cine MRI at 1.5T and 3T is routinely used for cardiac function assessment. Simultaneous multi-slice (SMS) imaging significantly reduces the number of required breath holds, but is typically performed with suboptimal flip angles (FA) due to SAR constraints and banding artifacts, both of which are significantly relaxed at 0.55T. In this work, we demonstrate blipped-CAIPI bSSFP cine imaging combined with spiral sampling for ventricular function at 0.55T with optimal FA for blood-myocardium contrast (100o-120o) at SMS factors of 2 and 3.
Introduction
Cardiac cine MRI is routinely used to evaluate ventricular function, wall motion, and regional wall thickening. bSSFP imaging is typically used because it offers excellent SNR efficiency and blood-myocardium contrast. Standardized protocols1 acquire a stack of short-axis slices that cover the whole heart with multiple breath-holds (one per slice, 10-12 in total). Recently, SMS bSSFP techniques2-4 have been utilized to reduce the number of breath holds. However, contrast-optimal FA could not be used due to SAR constraints and banding artifacts, resulting in compromised image quality. Our hypothesis in this study is that contemporary 0.55T scanners5 offer improved B0 homogeneity and relaxed SAR constraints, allowing contrast-optimal FA being used for SMS bSSFP.In-vivo studies have suggested contrast-optimal FA of 130o for 0.35T6 and 105o for 1.5T7. Note that blood inflow contributes to the contrast between left ventricle (LV) blood and myocardium7. 3D bSSFP excites a thick slab and typically has reduced contrast compared to 2D bSSFP8. To our knowledge, the contrast-optimal FA has not been documented at 0.55T and effects of blood saturation have not been characterized for 2D SMS bSSFP.
In this study, we demonstrate a blipped-CAIPI SMS bSSFP3 combined with spiral sampling for ventricular function assessment. SMS image quality is comparable with single band acquisition at SMS factor of 2 and 3. Contrast-optimal FA has been experimentally determined to be 120o-140o for single band and 100o-120o for SMS from 6 healthy volunteers.
Methods
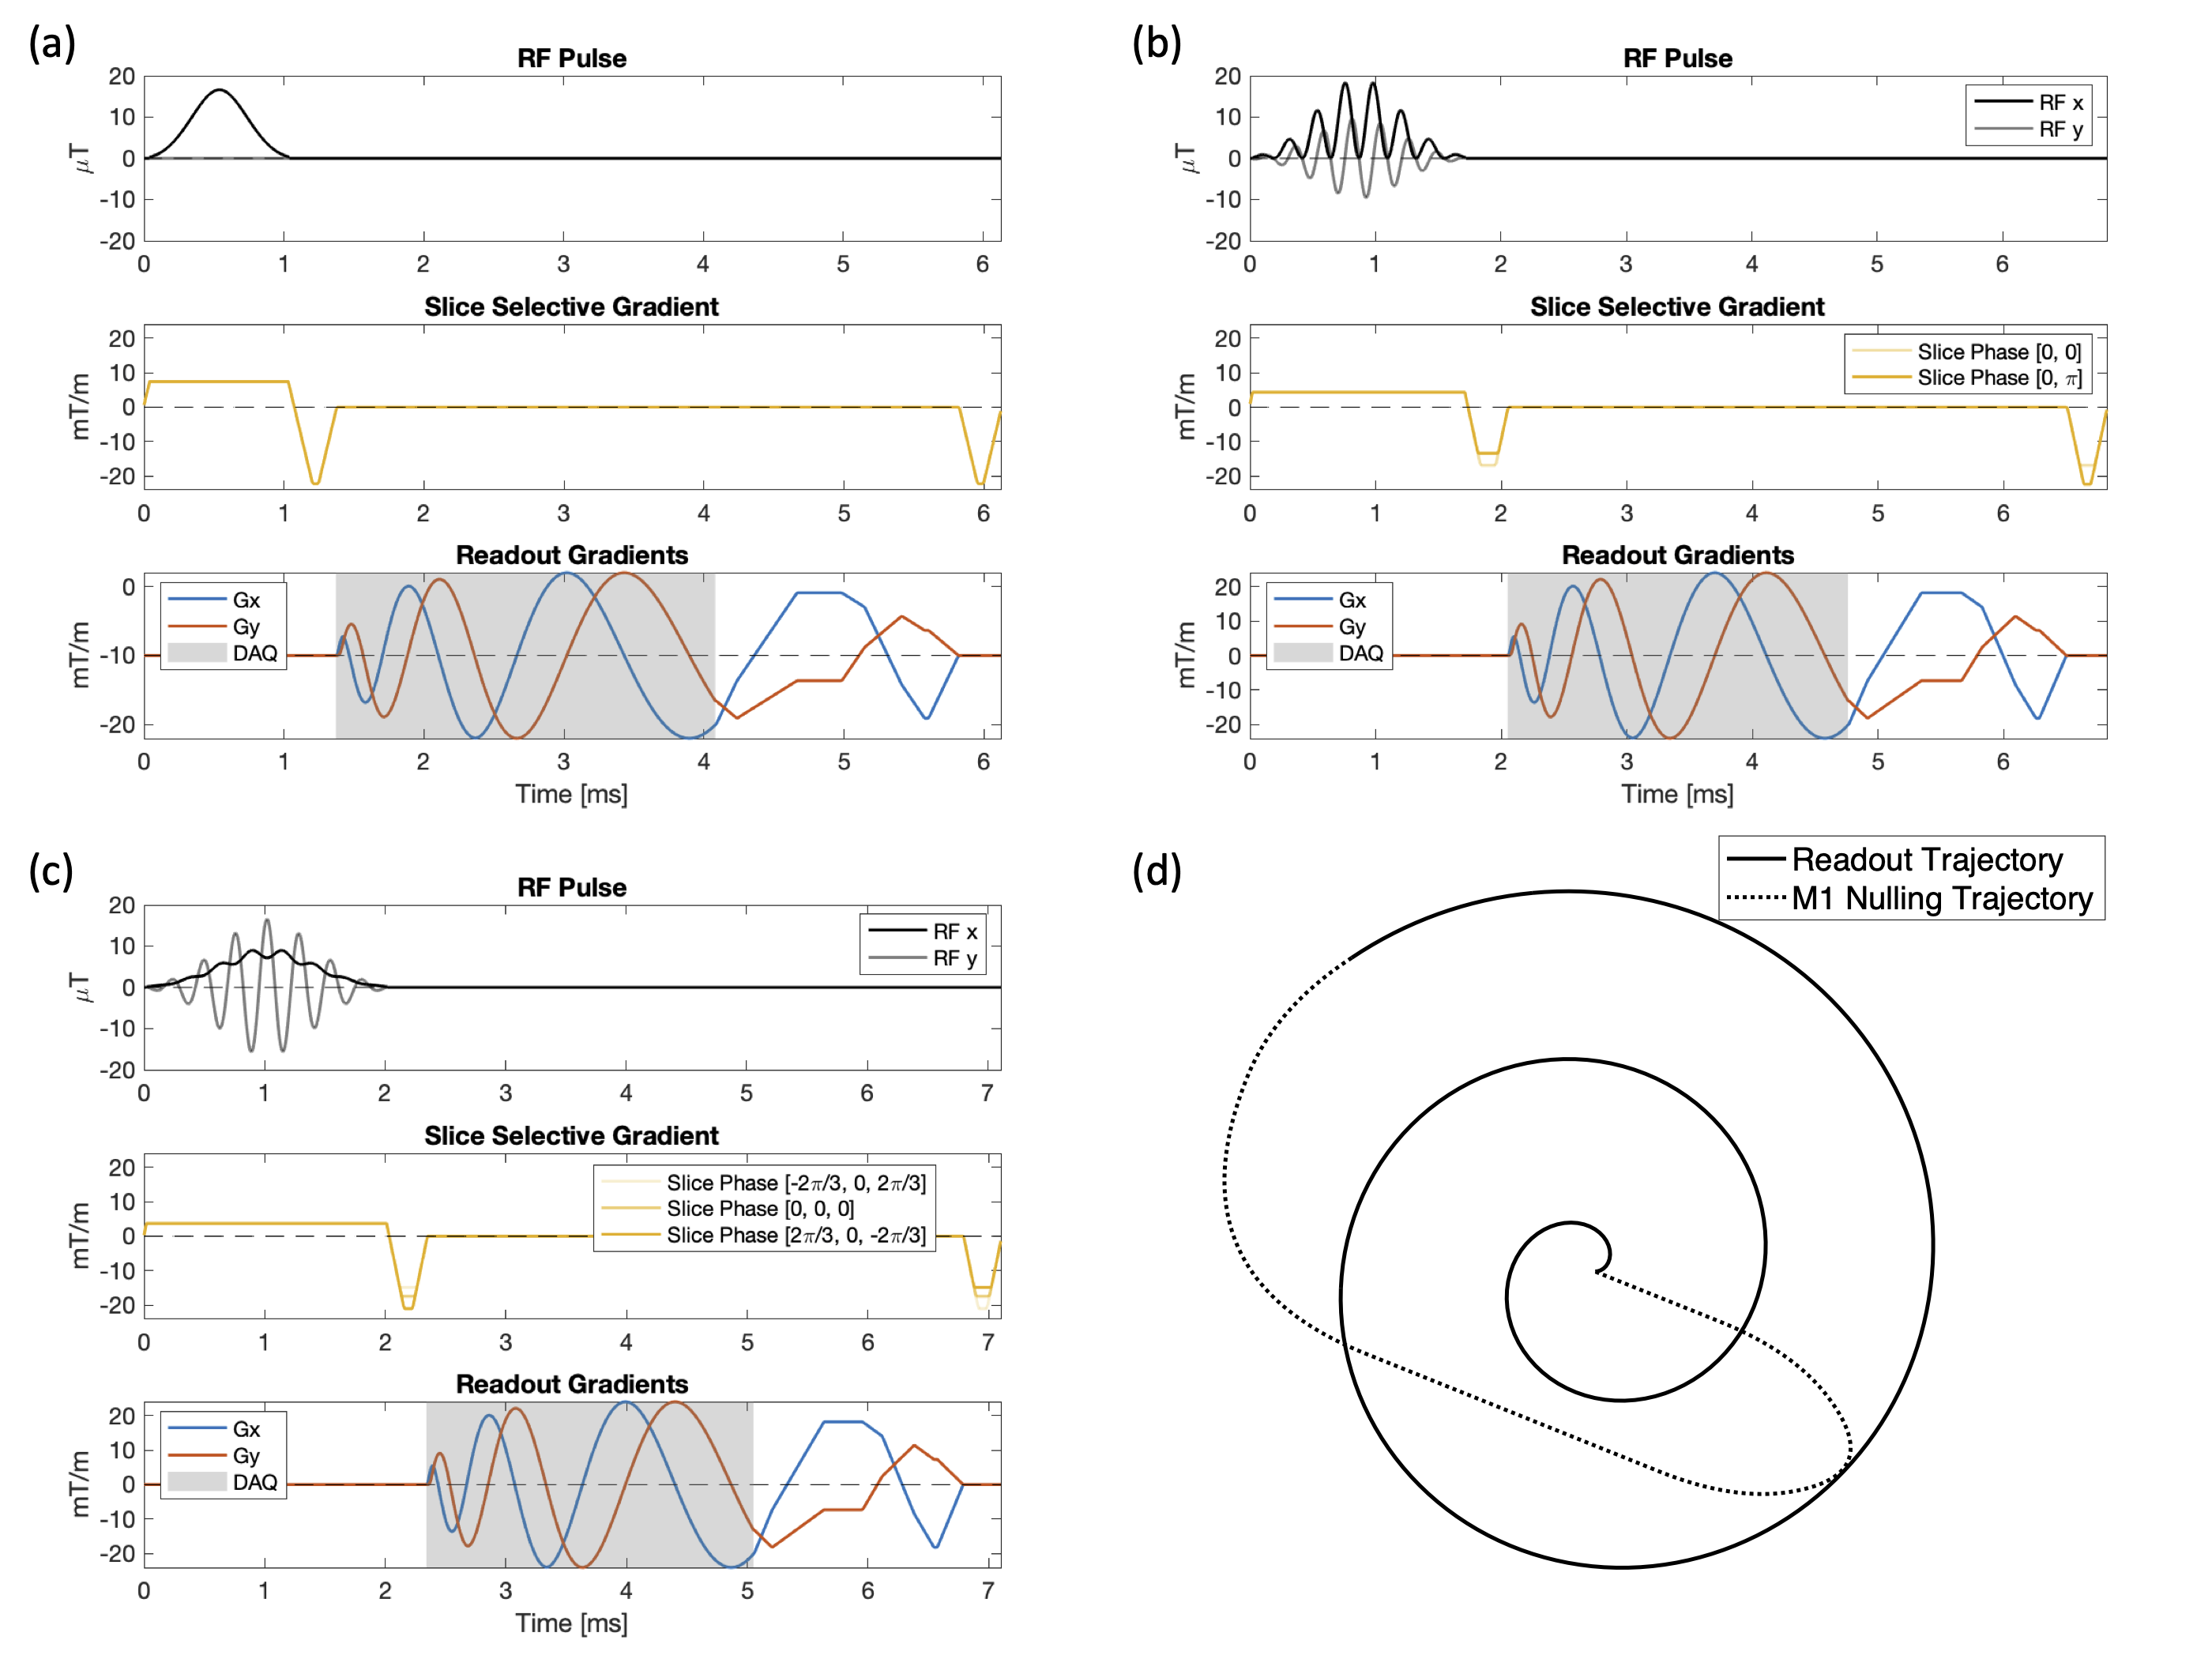
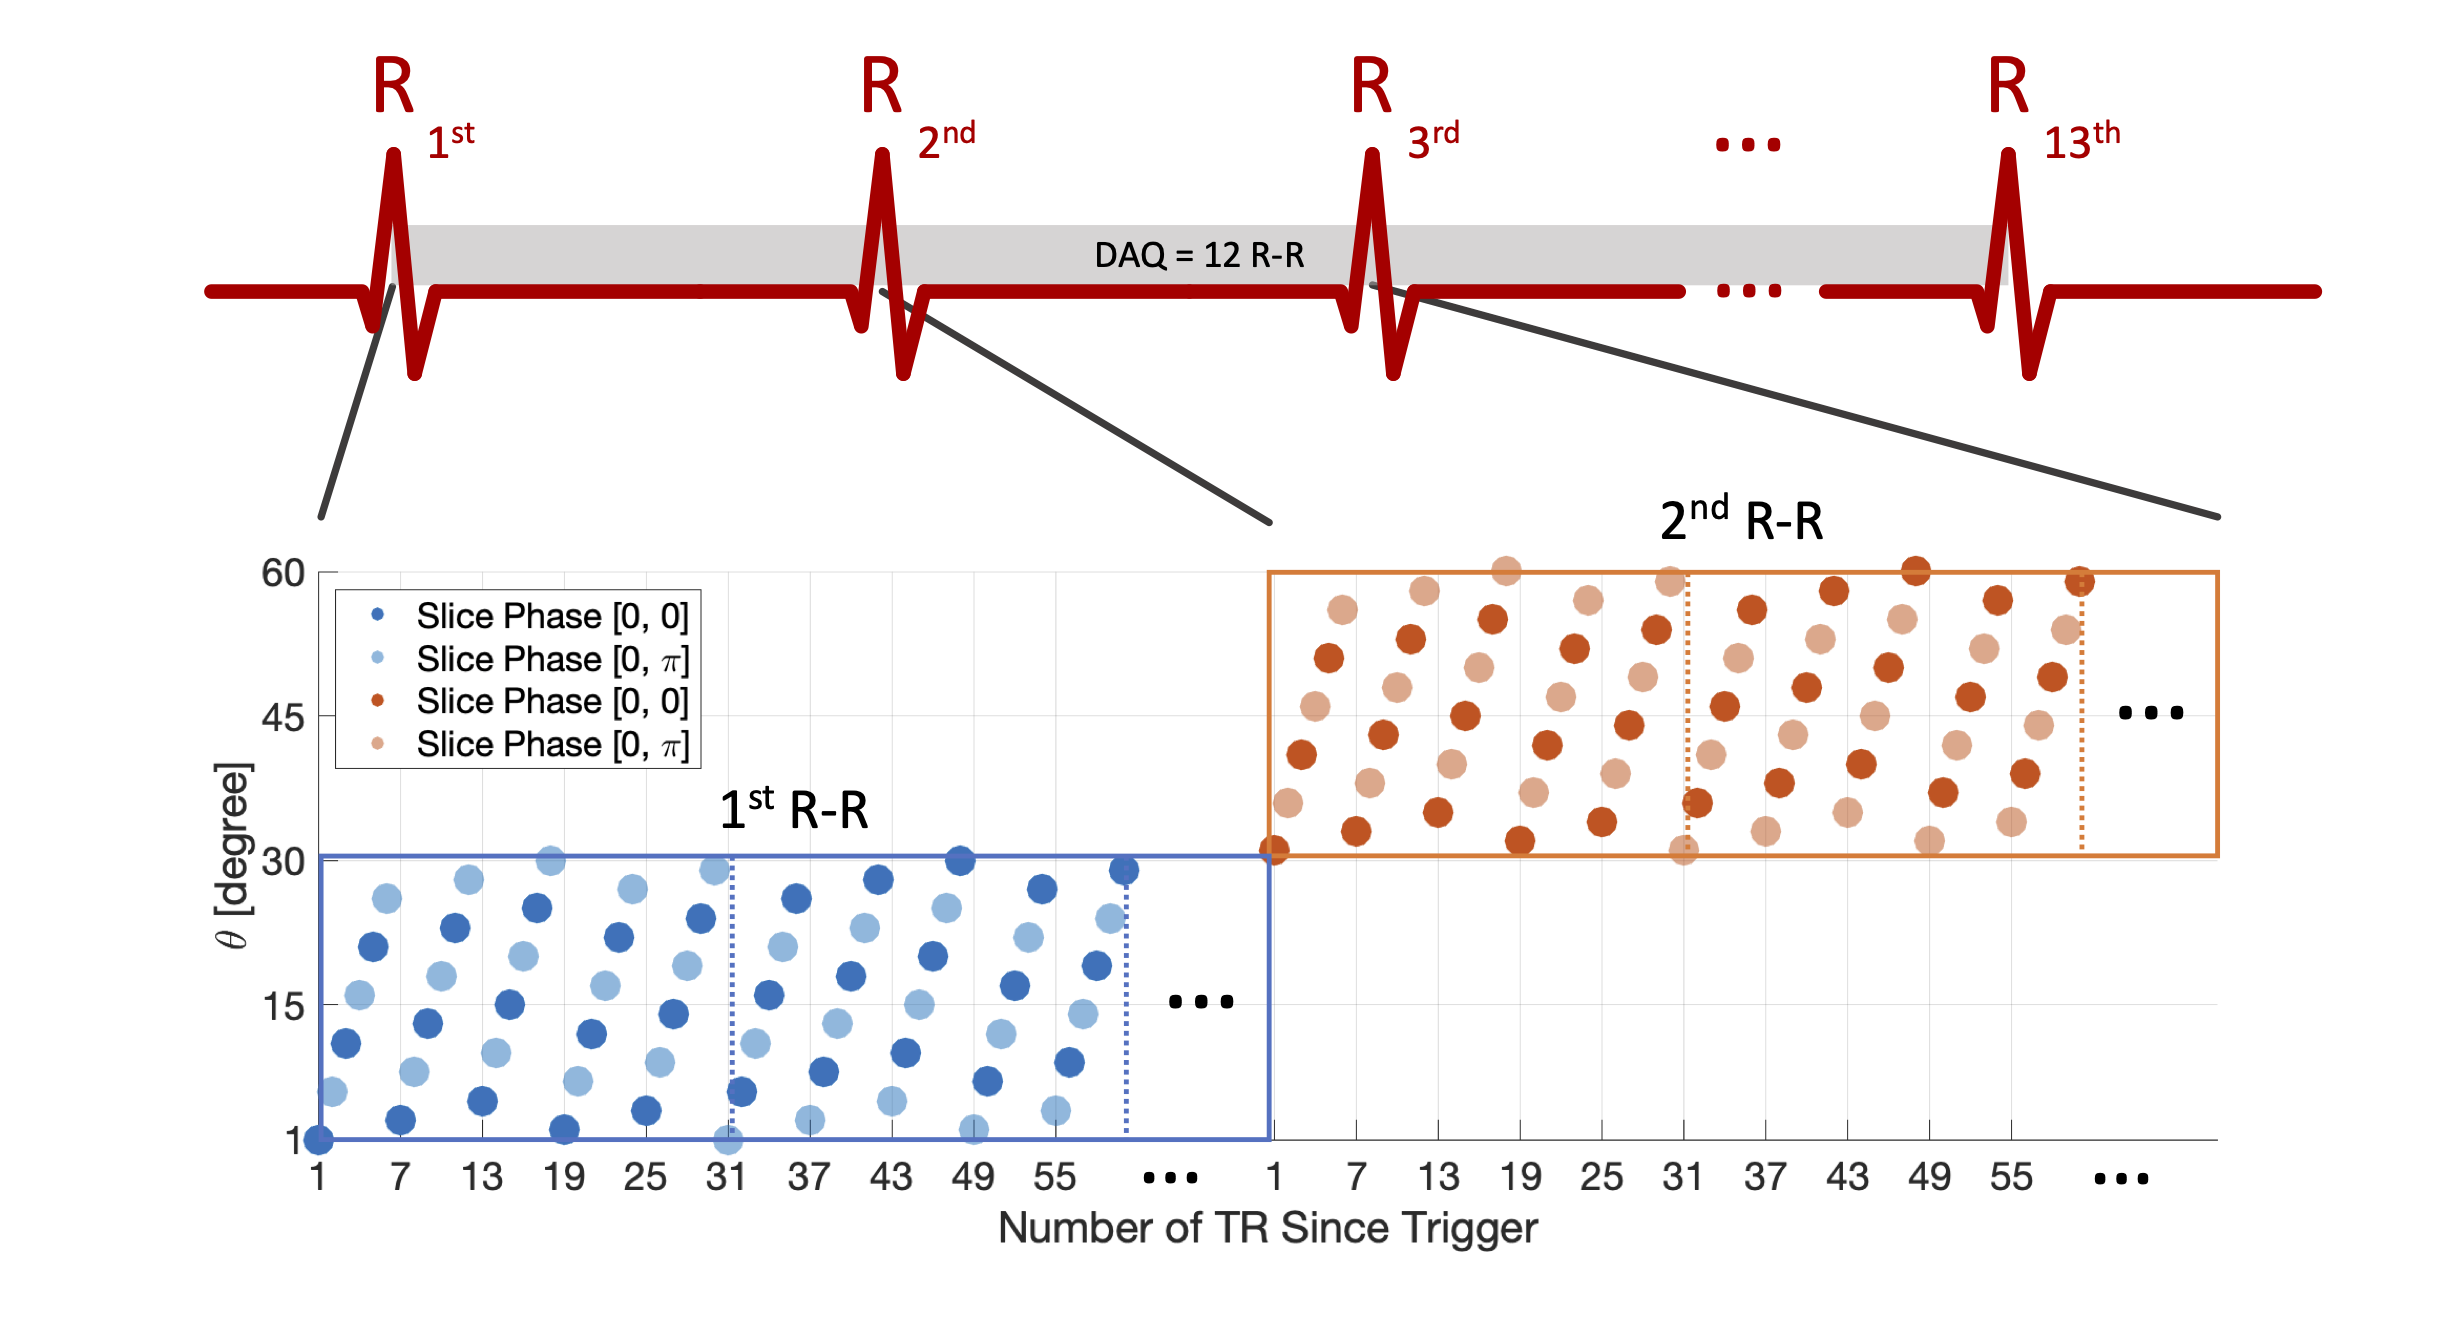
Pulse SequenceWe implemented a blipped-CAIPI SMS bSSFP sequence3 combined with spiral readout for cardiac cine as shown in Figure 1. Slice encoding gradient blips are incorporated into the pre-winder and re-winder of the slice-selective gradients (Figure 1(b-c)) to minimize TR. Single slice RF excitation pulse was designed with the SLR algorithm9 and then superimposed to form an SMS RF pulse with optimized slice phases10 to reduce the peak B1. Spiral trajectory with M1 nulling (Figure 1(d)), fully sampled with 68 spirals for FOV=48cm, and a readout duration of 2.7 ms was used to acquire k-space data. Sampling order for ECG-triggered cine is illustrated in Figure 2.
Acquisition
Experiments were performed using a whole body 0.55T system (prototype Magnetom Aera, Siemens Healthineers, Erlangen, Germany) equipped with high-performance shielded gradients (45 mT/m amplitude, 200 T/m/s slew rate). Imaging was performed using the RTHawk system (HeartVista Inc., Menlo Park, CA). Six healthy volunteers (three males, three females, age 27±4) were scanned with parameters: voxel size=1.5x1.5x8 mm3, TR and TE varied from 5.8ms-7.1ms and 0.9ms-1.4ms due to RF duration differences. FA=60o-140o (20o increment) were acquired for all SMS factors, and single band cine acquired additional FA=160o. A short-axis slice in the middle of the LV myocardium was prescribed for single band. SMS cines simultaneously acquired two slices at 0 and -2.4cm (SMS=2) or three slices at 0, ±2.4cm (SMS=3) away from the middle slice.
Reconstruction
Image reconstruction used gradient impulse response function11 corrected spiral trajectory and spatiotemporal constrained reconstruction12 with modification for SMS13. K-space data was sorted to have six TR from each R-R for each cardiac phase (~40 ms/cardiac phase). The number of cardiac phases was determined form the minimal duration R-R.
Analysis
One systolic and one diastolic phase were selected in the middle slice of each acquisition. Manual ROIs for LV blood and myocardium were drawn conservatively on an averaged image after translation-only registration, and were applied to each image individually. Averaged SI within LV and myocardial ROIs were reported, and their difference was reported as blood-myocardial contrast.
Results
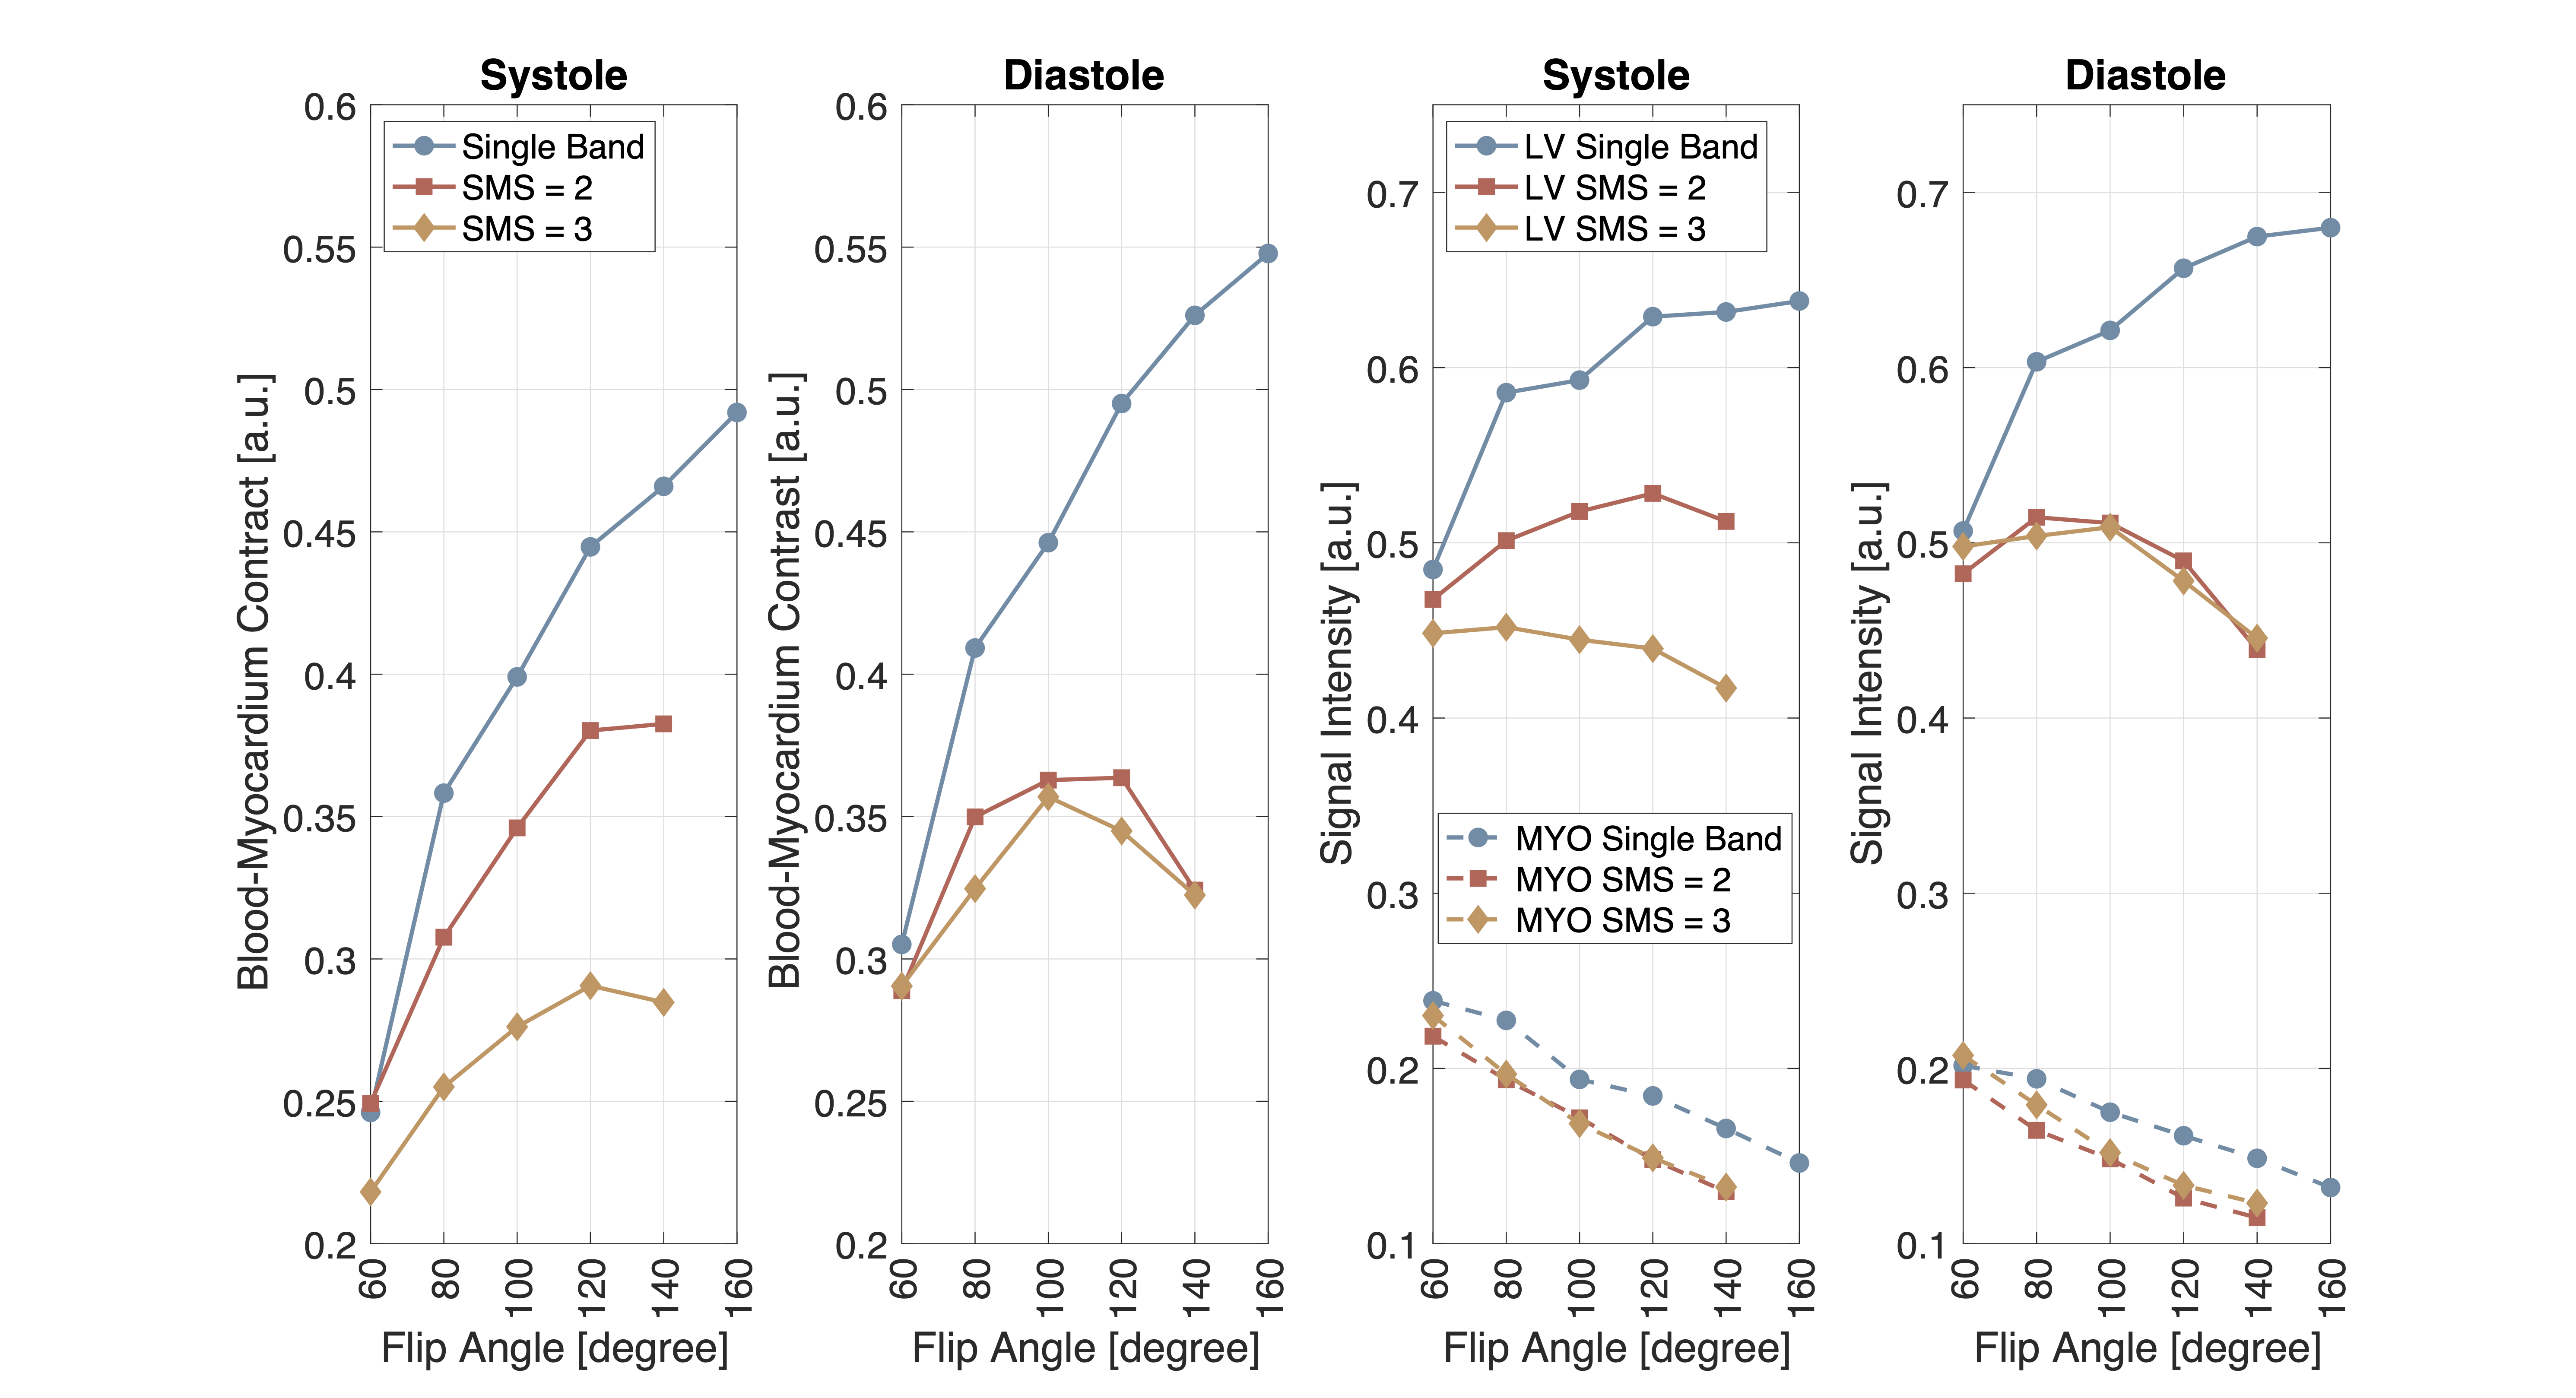
Figures 3 compares the image quality between single band and SMS cines at FA=120o. The flow effects appear differently since SMS used additional slice encoding blips and RF durations were different.Figure 4 compares the mid-slice cine movies acquired with different FAs and SMS factors for one volunteer. Figure 5 shows the quantitative blood-myocardium contrasts and signal intensities averaged across 6 volunteers. For single band, blood-myocardium contrast is higher as FA increases. For SMS=2 and 3, contrast drops at FA=100o-120o and higher. SMS generally have lower blood signal and lower contrast due to the blood suppression effects.
Discussions
In this study, we have demonstrated a blipped-CAIPI SMS bSSFP spiral sequence for cardiac function assessment at 0.55T. The reduced SAR and B0 inhomogeneity at 0.55T allow for contrast-optimal FA being used for SMS (100o-120o), which is not possible at higher field strengths. The SMS image quality is comparable with single band and has slightly lower blood-myocardium contrast at the same FA, due to inflow blood being saturated by SMS excitations.For cardiac cine, a large portion of the contrast is contributed by the inflow of blood that has equilibrium magnetization. This has been simulated and studied at 1.5T7, and the authors also showed the contrast-optimal FA is lower with reduced ejection fraction. Volunteers involved in this study were all healthy (ejection fraction ~60%). We expect that the contrast-optimal FA is changing with blood flow speed at 0.55T.
Conclusion
We demonstrate that cardiac function imaging at 0.55 Tesla can be expedited using SMS techniques (rate 2 or rate 3) without detected compromised image quality. Contrast-optimal FA at 0.55T was found to be 140o-160o for single band and 100o-120o for SMS = 2 or 3.Acknowledgements
We acknowledge grant support from the National Science Foundation (#1828736) and National Institute of Health (R01-HL130494) and research support from Siemens Healthineers.References
1. Kramer CM, Barkhausen J, Bucciarelli-Ducci C, Flamm SD, Kim RJ, Nagel E. Standardized cardiovascular magnetic resonance imaging (CMR) protocols: 2020 update. J Cardiovasc Magn Reson 2020;22(1):17.
2. Nazir MS, Neji R, Speier P, Reid F, Stab D, Schmidt M, Forman C, Razavi R, Plein S, Ismail TF, Chiribiri A, Roujol S. Simultaneous multi slice (SMS) balanced steady state free precession first-pass myocardial perfusion cardiovascular magnetic resonance with iterative reconstruction at 1.5 T. J Cardiovasc Magn Reson 2018;20(1):84.
3. Price AN, Cordero-Grande L, Malik SJ, Hajnal JV. Simultaneous multislice imaging of the heart using multiband balanced SSFP with blipped-CAIPI. Magn Reson Med 2020;83(6):2185-2196.
4. Stäb D, Speier P. Gradient-controlled local Larmor adjustment (GC-LOLA) for simultaneous multislice bSSFP imaging with improved banding behavior. Magn Reson Med 2019;81(1):129-139.
5. Campbell-Washburn AE, Ramasawmy R, Restivo MC, Bhattacharya I, Basar B, Herzka DA, Hansen MS, Rogers T, Bandettini WP, McGuirt DR, Mancini C, Grodzki D, Schneider R, Majeed W, Bhat H, Xue H, Moss J, Malayeri AA, Jones EC, Koretsky AP, Kellman P, Chen MY, Lederman RJ, Balaban RS. Opportunities in Interventional and Diagnostic Imaging by Using High-Performance Low-Field-Strength MRI. Radiology 2019;293(2):384-393.
6. Rashid S, Han F, Gao Y, Sung K, Cao M, Yang Y, Hu P. Cardiac balanced steady-state free precession MRI at 0.35 T: a comparison study with 1.5 T. Quantitative Imaging in Medicine and Surgery 2018;8(7):627-636.
7. Srinivasan S, Ennis DB. Optimal flip angle for high contrast balanced SSFP cardiac cine imaging. Magn Reson Med 2015;73(3):1095-1103.
8. Mascarenhas NB, Muthupillai R, Cheong B, Pereyra M, Flamm SD. Fast 3D cine steady-state free precession imaging with sensitivity encoding for assessment of left ventricular function in a single breath-hold. AJR Am J Roentgenol 2006;187(5):1235-1239.
9. Pauly J, Le Roux P, Nishimura D, Macovski A. Parameter relations for the Shinnar-Le Roux selective excitation pulse design algorithm [NMR imaging]. IEEE Trans Med Imaging 1991;10(1):53-65.
10. Wong E. Optimized Phase Schedules for Minimizing Peak RF Power in Simultaneous Multi-Slice RF Excitation Pulses. 2012; Melbourne , Australia. p 2209.
11. Campbell-Washburn AE, Xue H, Lederman RJ, Faranesh AZ, Hansen MS. Real-time distortion correction of spiral and echo planar images using the gradient system impulse response function. Magn Reson Med 2016;75(6):2278-2285.
12. Adluru G, McGann C, Speier P, Kholmovski EG, Shaaban A, Dibella EV. Acquisition and reconstruction of undersampled radial data for myocardial perfusion magnetic resonance imaging. J Magn Reson Imaging 2009;29(2):466-473.
13. Tian Y, Mendes J, Pedgaonkar A, Ibrahim M, Jensen L, Schroeder JD, Wilson B, DiBella EVR, Adluru G. Feasibility of multiple-view myocardial perfusion MRI using radial simultaneous multi-slice acquisitions. PLoS One 2019;14(2):e0211738.
Figures