4445
Accelerated MRI of epicardial adipose tissue fatty acid composition in mice using a compressed-sensing and dictionary-based reconstruction1Biomedical Engineering, University of Virginia, Charlottesville, VA, United States
Synopsis
Epicardial adipose tissue (EAT) and its fatty acid composition (FAC) have been implicated in numerous cardiovascular diseases as saturated fatty acids are known to promote inflammation. FAC MRI techniques, while prominent, have not been applied to EAT due to extended scan times, thus, image acceleration is essential. Here, we demonstrate compressed sensing with a signal model-based dictionary (CS-DICT) to reconstruct psuedo-random undersampled images. Using CS-DICT, we achieve rate-3 acceleration while maintaining accurate EAT FAC maps and estimations in obese mice. These methods facilitate the application of FAC MRI to the EAT.
Introduction
There is growing interest in understanding the role of epicardial adipose tissue (EAT) in cardiovascular diseases, as the EAT has been described as a transducer of metabolic inflammation to the coronary vessels and tissue1–4. While most EAT imaging aims to quantify EAT volume, the EAT fatty acid composition (FAC) may also be important, as saturated fatty acids are known to promote inflammation. This latter point is salient, because to date, noninvasive imaging does not determine whether EAT is proinflammatory. Multi-echo gradient echo MRI with methods like VARPRO5 and IDEAL6,7 can map adipose tissue saturated fatty acid (SFA), poly-unsaturated fatty acid (PUFA), and mono-unsaturated fatty acid (MUFA) fractions, and they have been validated in phantoms8–10 and in-vivo in several organs8,11–15. To date, FAC MRI has not been widely applied to EAT as, due to the need for ECG gating, scan times are extended. For ECG-gated FAC MRI, acceleration is essential, and here, we demonstrate acceleration of FAC MRI using a compressed-sensing approach and application to the EAT in a mouse model of obesity.Methods
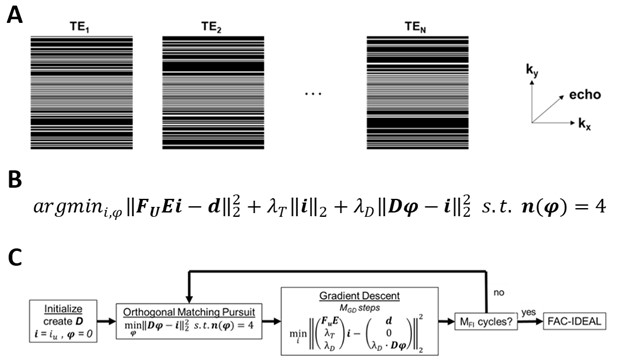
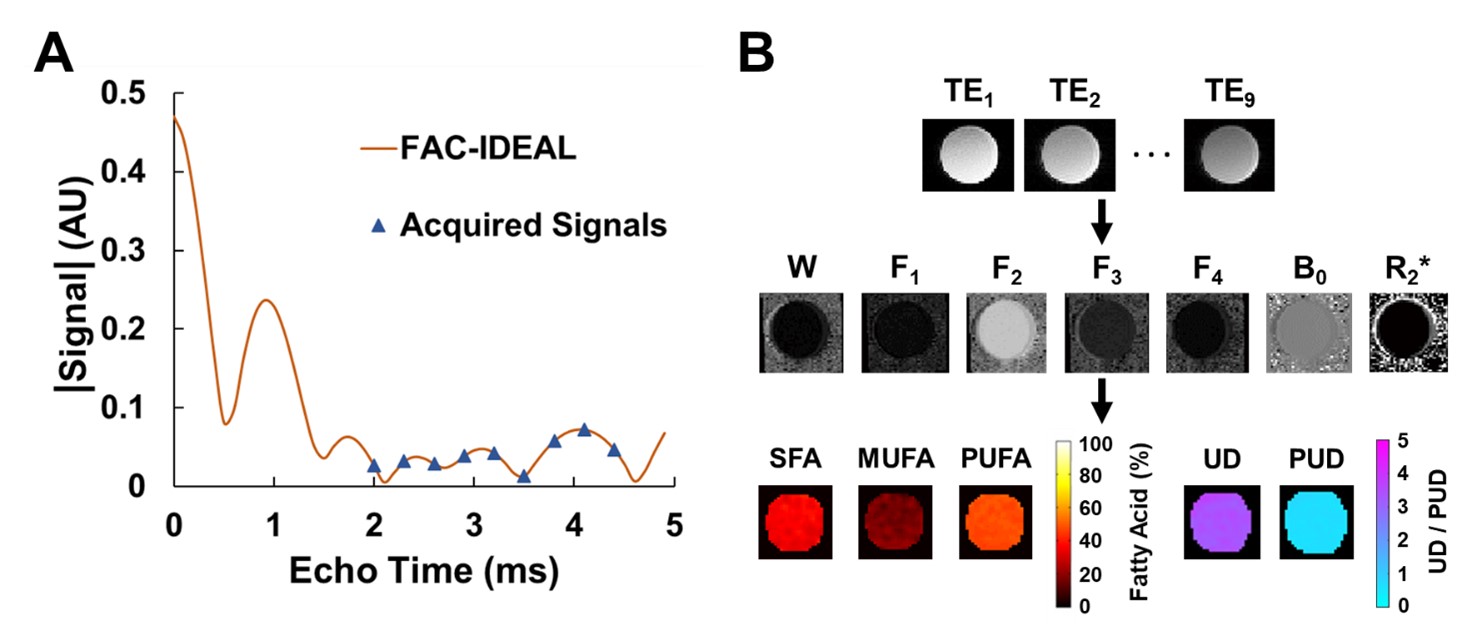
A pseudo-random undersampling pattern, as shown in Figure 1A, was used for retrospective and prospective rate 2, 2.5, 3, and 3.5 image acceleration. The undersampling pattern used uniform rate-2 undersampling in the center (33%) of k-space and Poisson-disc undersampling for the outer (67%) part of k-space, providing a mix of coherent and incoherent artifacts. Undersampled images were reconstructed by solving a minimization equation containing a data fidelity term, Tikhonov regularization, and an overcomplete signal-model based dictionary term as shown in Figure 1B and 1C. The signal model is described in the next section. We refer to this method as CS-DICT.After image reconstruction, for FAC quantification/mapping, multiecho data were fit to a “mean triglyceride” signal model8 as: S(TE[n]) = (2W + α1F1 + α2F2 + α3F3 + α4F4) * e(i*2π*B0 – R2*)*TE[n] where α1 through α4 represent the four triglyceride components with multiple resonances and W, and F1 through F4 represent the amount of signal from the water and triglyceride components respectively. An IDEAL algorithm16 was used to quantify the five signal components, and linear combinations of those were used to calculate SFA, PUFA, and MUFA fractions as well as the unsaturated degree (UD) and poly-unsaturated degree (PUD)8. This method, referred to as FAC-IDEAL, is shown in Figure 2.
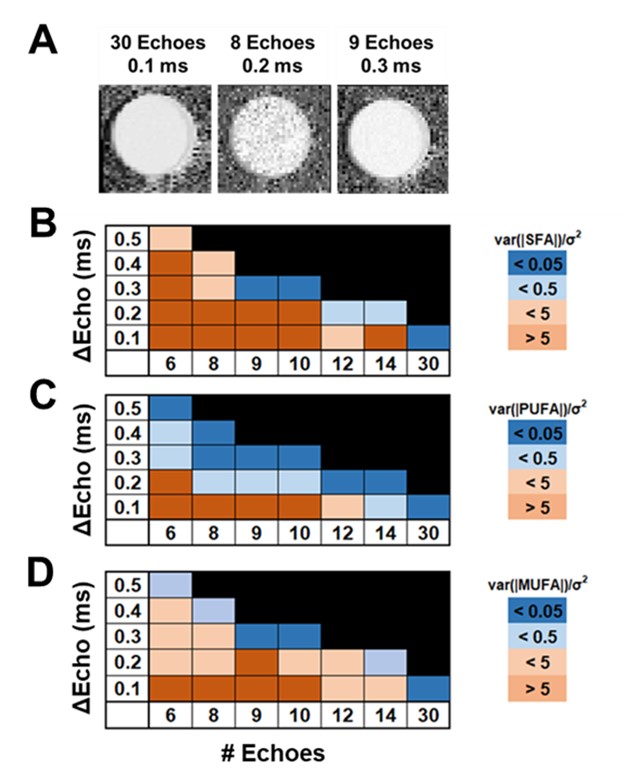
An important consideration for FAC imaging is choosing the number of echoes, interecho spacing, and SNR necessary for efficient FAC estimations. Using Cramer-Rao lower bounds analysis on oil phantom, as shown in Figure 3, the optimal number of echoes and interecho spacing was found to be 9 echoes with 0.3ms spacing. Also, an SNR of 24, corresponding to 8 averages, was required for accurate FAC estimations.
MRI was performed using a 7T system (Clinscan, Bruker) and a 4-channel phased-array RF coil. Wild-type male mice (n=10) fed a high-fat high-sucrose diet (HFHSD) for 6 weeks were studied. Fully-sampled and prospectively undersampled images for FAC-IDEAL were acquired using an ECG-gated flyback double-echo gradient-echo sequence with 9 echoes, initial echo time (TE) = 2.0ms, echo spacing (ΔTE) = 0.3ms, repetition time (TR) = R-R interval, flip angle = 15°, averages = 8, bandwidth = 390 Hz/pixel, slice thickness = 1 mm, acquisition matrix = 128 x 128 and resolution = 0.2*0.2 mm2. Coil sensitivity maps were calculated as described17.
RMSE and SSIM were used for error quantification and assessment between fully-sampled and retrospectively-undersampled CS-DICT reconstructed images at different acceleration rates. Thresholds of RMSE < 5% and SSIM > 0.85 were used as cut-offs for the selection of an optimal acceleration rate. After acceleration rate selection, RMSE and SSIM were used again to compare FAC-IDEAL maps from fully-sampled, retrospectively-undersampled, and prospectively-undersampled images.
Results
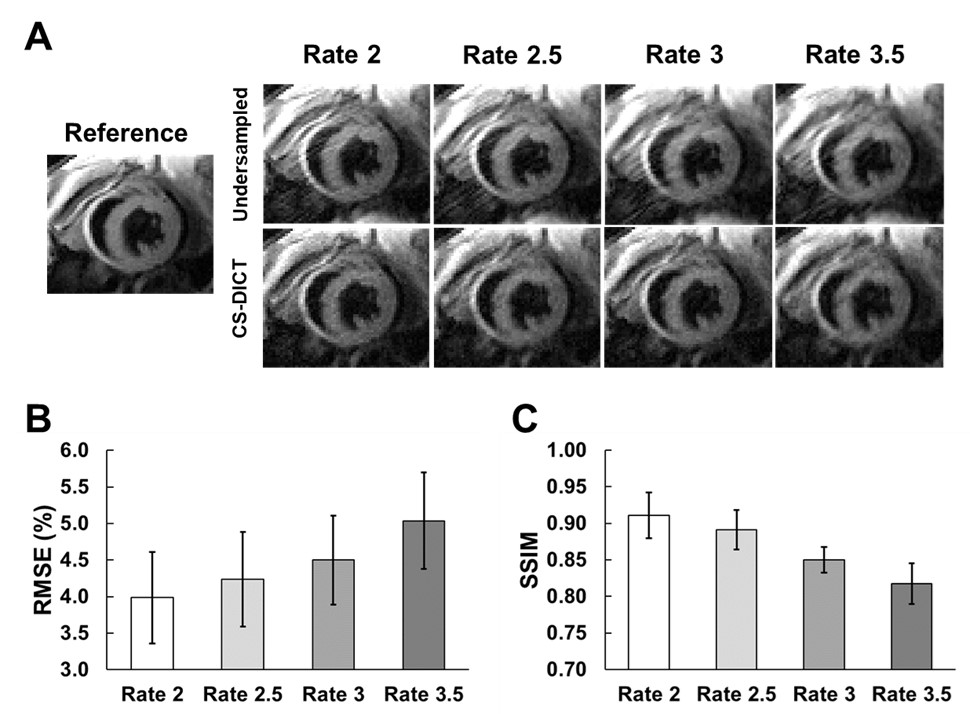
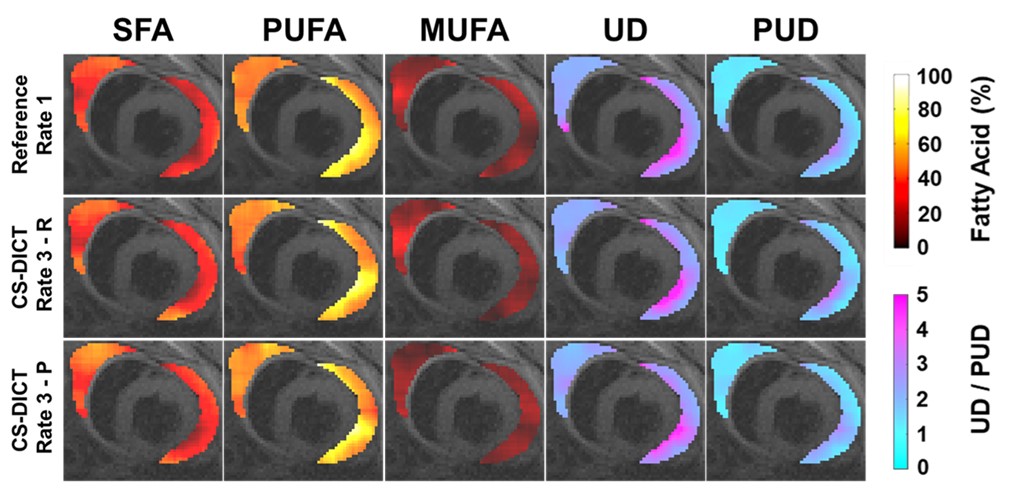
Figure 4A demonstrates CS-DICT reconstructions at multiple accelerations rates showing good suppression of artifacts and maintenance of sharpness up to rate-3 acceleration in retrospectively undersampled images, with image blurring becoming problematic with rate-3.5 acceleration. Figures 4B and 4C show RMSE and SSIM for each acceleration rate. Rate-3 acceleration was used for latter experiments as the RMSE of 4.50±0.61% and SSIM of 0.85±0.02 were within our thresholds.Figure 5 shows excellent similarity between EAT FAC-IDEAL maps from fully-sampled, and rate-3 retrospectively and prospectively-undersampled CS-DICT. Average RMSE of all five FAC-IDEAL maps was 3.55±0.58% and 4.15±0.32% for retrospectively and prospectively-undersampled data, respectively. SSIM was 0.92±0.03 and 0.89±0.03, respectively. There was less than 5% error for SFA, PUFA, MUFA, UD, and PUD values between fully-sampled and rate-3 undersampled data.
Discussion and Conclusions
To the best of our knowledge, this is the first study to demonstrate the acceleration of FAC MRI and to apply accelerated imaging to quantification the FAC of EAT. Using rate-3 undersampling with a double-echo sequence, EAT FAC MRI scan time was reduced from 25 to 12 minutes resulting in a total acceleration rate of 2.1 as one fully sampled image was required for sensitivity map calculation. This method may be useful to accelerate FAC MRI for any adipose tissue depot and may also facilitate breathhold MRI of EAT FAC in humans.Acknowledgements
This work was supported by NIH NIBIB R01 EB001763.References
1. Ansaldo, A. M., Montecucco, F., Sahebkar, A., Dallegri, F. & Carbone, F. Epicardial adipose tissue and cardiovascular diseases. International journal of cardiology 278, 254–260 (2019).
2. Nagy, E., Jermendy, A. L., Merkely, B. & Maurovich-Horvat, P. Clinical importance of epicardial adipose tissue. Archives of medical science: AMS 13, 864 (2017).
3. Packer, M. Epicardial adipose tissue may mediate deleterious effects of obesity and inflammation on the myocardium. Journal of the American College of Cardiology 71, 2360–2372 (2018).
4. Matloch, Z., Kotulák, T. & Haluzík, M. The role of epicardial adipose tissue in heart disease. Physiological research 65, 23 (2016).
5. Hernando, D. et al. Joint estimation of water/fat images and field inhomogeneity map. Magnetic Resonance in Medicine: An Official Journal of the International Society for Magnetic Resonance in Medicine 59, 571–580 (2008).
6. Reeder, S. B. et al. Multicoil Dixon chemical species separation with an iterative least‐squares estimation method. Magnetic Resonance in Medicine: An Official Journal of the International Society for Magnetic Resonance in Medicine 51, 35–45 (2004).
7. Reeder, S. B. et al. Iterative decomposition of water and fat with echo asymmetry and least‐squares estimation (IDEAL): application with fast spin‐echo imaging. Magnetic Resonance in Medicine: An Official Journal of the International Society for Magnetic Resonance in Medicine 54, 636–644 (2005).
8. Berglund, J., Ahlström, H. & Kullberg, J. Model‐based mapping of fat unsaturation and chain length by chemical shift imaging—phantom validation and in vivo feasibility. Magnetic resonance in medicine 68, 1815–1827 (2012).
9. Peterson, P. & Månsson, S. Simultaneous quantification of fat content and fatty acid composition using MR imaging. Magnetic resonance in medicine 69, 688–697 (2013).
10. Leporq, B., Lambert, S. A., Ronot, M., Vilgrain, V. & Van Beers, B. E. Quantification of the triglyceride fatty acid composition with 3.0 T MRI. NMR in Biomedicine 27, 1211–1221 (2014).
11. Nemeth, A. et al. 3D chemical shift‐encoded MRI for volume and composition quantification of abdominal adipose tissue during an overfeeding protocol in healthy volunteers. Journal of Magnetic Resonance Imaging 49, 1587–1599 (2019).
12. Schneider, M. et al. Accurate fatty acid composition estimation of adipose tissue in the abdomen based on bipolar multi‐echo MRI. Magnetic resonance in medicine 81, 2330–2346 (2019).
13. Leporq, B. et al. Hepatic fat fraction and visceral adipose tissue fatty acid composition in mice: Quantification with 7.0 T MRI. Magnetic resonance in medicine 76, 510–518 (2016).
14. Martel, D. et al. Chemical shift-encoded MRI for assessment of bone marrow adipose tissue fat composition: pilot study in premenopausal versus postmenopausal women. Magnetic resonance imaging 53, 148–155 (2018).
15. Martel, D. et al. 3T chemical shift‐encoded MRI: Detection of altered proximal femur marrow adipose tissue composition in glucocorticoid users and validation with magnetic resonance spectroscopy. Journal of Magnetic Resonance Imaging 50, 490–496 (2019).
16. Yu, H. et al. Multiecho reconstruction for simultaneous water‐fat decomposition and T2* estimation. Journal of Magnetic Resonance Imaging: An Official Journal of the International Society for Magnetic Resonance in Medicine 26, 1153–1161 (2007).
17. Walsh, D. O., Gmitro, A. F. & Marcellin, M. W. Adaptive reconstruction of phased array MR imagery. Magnetic Resonance in Medicine: An Official Journal of the International Society for Magnetic Resonance in Medicine 43, 682–690 (2000).
Figures