4444
Simultaneous T1, T2, and T1ρ Mapping of the Myocardium with Multi-Parametric SASHA1Cardiovascular MR R&D, Siemens Healthineers, Chicago, IL, United States, 2National Heart, Lung, and Blood Institute, National Institutes of Health, Bethesda, MD, United States
Synopsis
Parametric T1 and T2 mapping can provide valuable insight into myocardial tissue microstructure. T1ρ is a complimentary technique that is sensitive to macromolecular content and may potentially enable non-contrast scar visualization. Characterization with all parameters is desirable as they may have different sensitivities to pathology but is time consuming with separate acquisitions for each. We propose a novel mSASHA sequence with T1, T2, and T1ρ maps in a single 13 HB breath-hold or free-breathing acquisition. mSASHA had superior T1 and T2 accuracy and similar precision to conventional MOLLI and T2p-bSSFP in phantoms and data is presented from 3 volunteers.
Introduction
Parametric mapping provides valuable insight into myocardial tissue microstructure and T1 and T2 mapping abnormalities have been associated with fibrosis and edema (1). T1ρ, the spin-lattice relaxation time in the rotating frame, is a complimentary technique that is sensitive to macromolecular content and thus may be more sensitive to collagen accumulation in myocardial infarctions (2). This may enable the characterization of myocardial scar without the need for gadolinium-based contrast agents. However, comprehensive characterization with all 3 techniques is often time consuming as they are generally performed in separate acquisitions. We propose an extension to the multi-parametric SAturation-recovery single-SHot Acquisition (mSASHA) technique (3) that provides co-registered T1, T2, and T1ρ maps in either a single 13-heartbeat breath-hold or 51 heartbeats of free breathing.Methods
The multi-parametric SASHA sequence consists of a series of single-shot images with various magnetization preparations (Fig. 1). The first image is unweighted, followed by images with saturation recovery (SR) T1-weighting, SR plus T2-preparation (SR+T2p) weighting, and SR plus T1ρ-preparation (SR+T1ρ) weighting. T2 weighting is achieved using an adiabatic T2 preparation module with a specified echo time (TE). T1ρ weighting is achieved using rectangular tip down/up pulses with 2 composite refocusing pulses and continuous wave excitation in between them with a specified spin-lock time (TSL).The mSASHA sequence can be acquired in a single 13-heartbeat breath-hold (Fig. 1a) or as a free-breathing acquisition (Fig. 1b). With free breathing, the reference image is SR prepared with a long TS (>4 HBs) and the basic scheme is repeated 3 times, improving both imaging precision and patient comfort. High-contrast images were used improve the quality of motion correction (4).
T1, T2, and T1ρ are simultaneously calculated from all images using a 4-parameter model (Fig. 2). The effect of linear k-space ordering on the signal intensity is modeled as a period of T1 recovery, enabled by the use of the variable flip angle (VFA) modulation previously described (3,5).
The mSASHA prototype sequence was evaluated in a NiCl2-doped agarose T1MES phantom (6) on a 1.5T system (MAGNETOM Sola, Siemens Healthcare, Erlangen, Germany) with comparison to gold standard spin-echo and commonly used SASHA, Modified Look-Locker Inversion recovery (MOLLI) and T2p balanced steady-state free precession (T2p-bSSFP) sequences. mSASHA was acquired with both breath-hold and free breathing protocols with a basic sampling scheme consisting of a reference image, 5 SR images (TS = 600 ms), 2 SR+T2 images (TS = 600+RR ms, TE = 35, 55 ms), and 2 SR+T1ρ images (TS = 600+RR ms, spin-lock time (TSL) = 35, 55 ms). Other sequence parameters were 360×270 mm2 field of view, 1.4×1.9 mm2 in-plane resolution, 8 mm slice thickness, 1.26/2.93 ms bSSFP TE/TR and variable flip angle with 100° maximum. SASHA, 5(3)3 MOLLI, and T2p-bSSFP were acquired with flip angles of 70° VFA, 35° CFA, and 70° CFA respectively and other parameters matched.
The mSASHA, SASHA, MOLLI, and T2p-bSSFP sequences were also evaluated in 3 volunteers (40±1 yrs, 1 female) in a single short-axis slice on both Sola and Aera 1.5T systems. The left ventricular myocardium was segmented avoiding regions with visible artifact and T1, T2, and T1ρ values are reported as mean±standard deviation of pixels within the ROIs.
Results
In the NiCl2-agarose T1MES phantom, breath-hold mSASHA T1 and T2 maps had good agreement with gold standard spin echo (0.3±0.4% and 2.7±1.9% error respectively) while reference MOLLI and T2p-bSSFP had substantial errors (Fig. 3). mSASHA T1ρ values were 6.1±0.8% higher than T2. Free-breathing mSASHA T1, T2, and T1ρ values were not statistically significantly different than breath-hold mSASHA values (p>0.05). Breath-hold mSASHA T1 and T2 maps had similar coefficient of variation (CoV) compared to reference MOLLI and T2p-bSSFP respectively (p>0.05). Free breathing mSASHA reduced the CoV by 24±16%, 30±10%, and 36±12% in T1, T2, and T1ρ respectively.In-vivo breath-hold mSASHA T1, T2, and T1ρ maps had good image quality with the exception of artifacts present in the inferolateral wall for T1ρ, corresponding to a region of significant off-resonance (Fig. 4). Average myocardial mSASHA values of 1203±17 ms for T1, 41.4±1.0 ms for T2, and 46.9±0.3 ms for T1ρ (Fig. 5). Free-breathing and breath-hold mSASHA values were not different for all parameters (p>0.05) and similar to T1-only SASHA (p>0.05). In-vivo breath-hold mSASHA T1 and T2 pixel map precision was similar to MOLLI and T2p-bSSFP techniques (p>0.05) and free-breathing mSASHA had lower myocardial CoV in all cases.
Discussion
The proposed mSASHA sequence provides simultaneous T1, T2, and T1ρ maps in a single acquisition with either breath-hold or free-breathing protocols. Breath-hold mSASHA T1 and T2 maps had similar precision to conventional MOLLI and T2p-bSSFP with superior accuracy in only a single breath-hold. mSASHA T1ρ maps had good precision similar to T2 maps, but off-resonance sensitivity of the T1ρ preparation module requires additional optimization. The free-breathing mSASHA protocol improved precision and may also be preferable in patient populations where breath-holds are challenging.Conclusion
mSASHA provides multi-parametric characterization of the myocardium in a single acquisition, potentially replacing 3 separate breath-holds for T1, T2, and T1ρ mapping. Further study in patients with edema, focal fibrosis, and diffuse fibrosis are required to determine the sensitivity of T1, T2, and T1ρ to various pathologies.Acknowledgements
No acknowledgement found.References
1. Leiner T, Bogaert J, Friedrich MG, Mohiaddin R, Muthurangu V, Myerson S, Powell AJ, Raman SV, Pennell DJ. SCMR Position Paper (2020) on clinical indications for cardiovascular magnetic resonance. J Cardiovasc Magn Reson 2020;22:1–37.
2. Han Y, Liimatainen T, Gorman RC, and Witschey WRT. Assessing Myocardial Disease Using T1ρ MRI. Curr Cardiovasc Imaging Rep. 2014;7:9248.
3. Chow K, Hayes G, Flewitt JA, Feuchter P, Lydell C, Howarth A, Pagano JJ, Thompson RB, Kellman P, White JA. Improved Accuracy and Precision In Simultaneous Myocardial T1 and T2 mapping with Multi-Parametric SASHA (mSASHA). arXiv:2104.00729
4. Chow K, Yang Y, Shaw P, Kramer CM, Salerno M. Robust free-breathing SASHA T1 mapping with high-contrast image registration. J Cardiovasc Magn Reson 2016;18:47.
5. Chow K, Spottiswoode B, Pagano JJ, Thompson R. Improved precision in SASHA T1 mapping with a variable flip angle readout. J Cardiovasc Magn Reson 2014;16:M9.
6. Captur G, Gatehouse PD, Heslinga FG, et al. A medical device-grade T1 and ECV phantom for global T1 mapping quality assurance—the T1 Mapping and ECV Standardization in cardiovascular magnetic resonance (T1MES) program. J Cardiovasc Magn Reson 2016;18:58
Figures
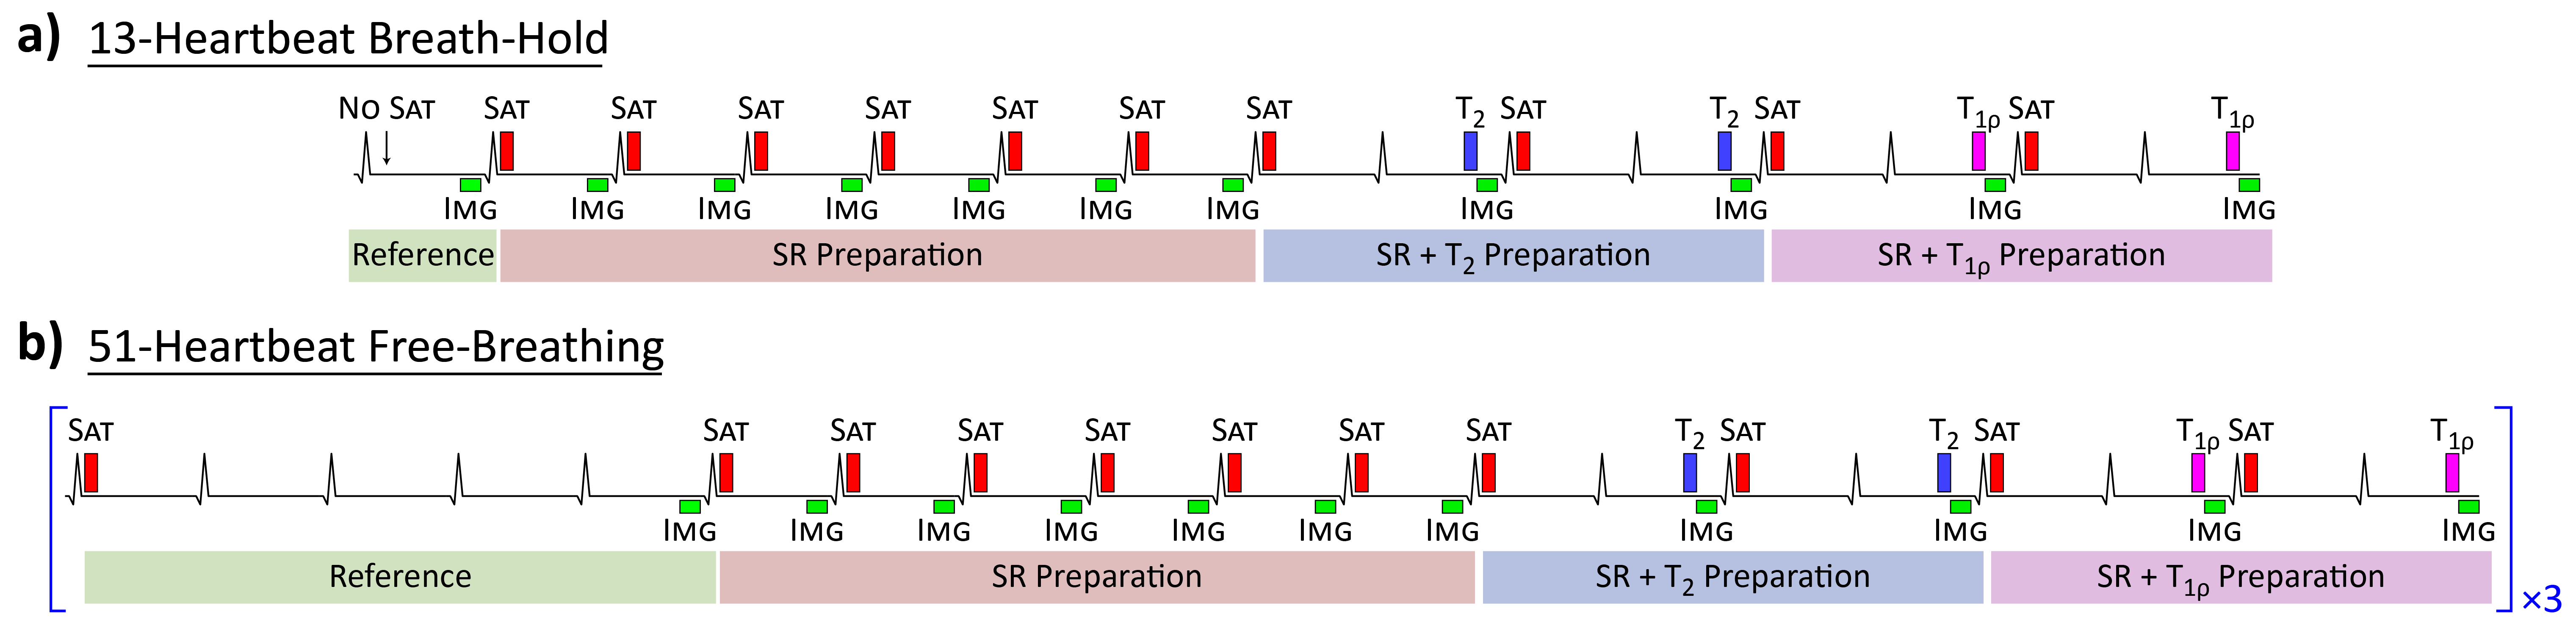
Fig. 1. Sequence diagram for multi-parametric SASHA (mSASHA) as a) a 13-heartbeat breath-hold and b) a 54-heartbeat free-breathing protocol.
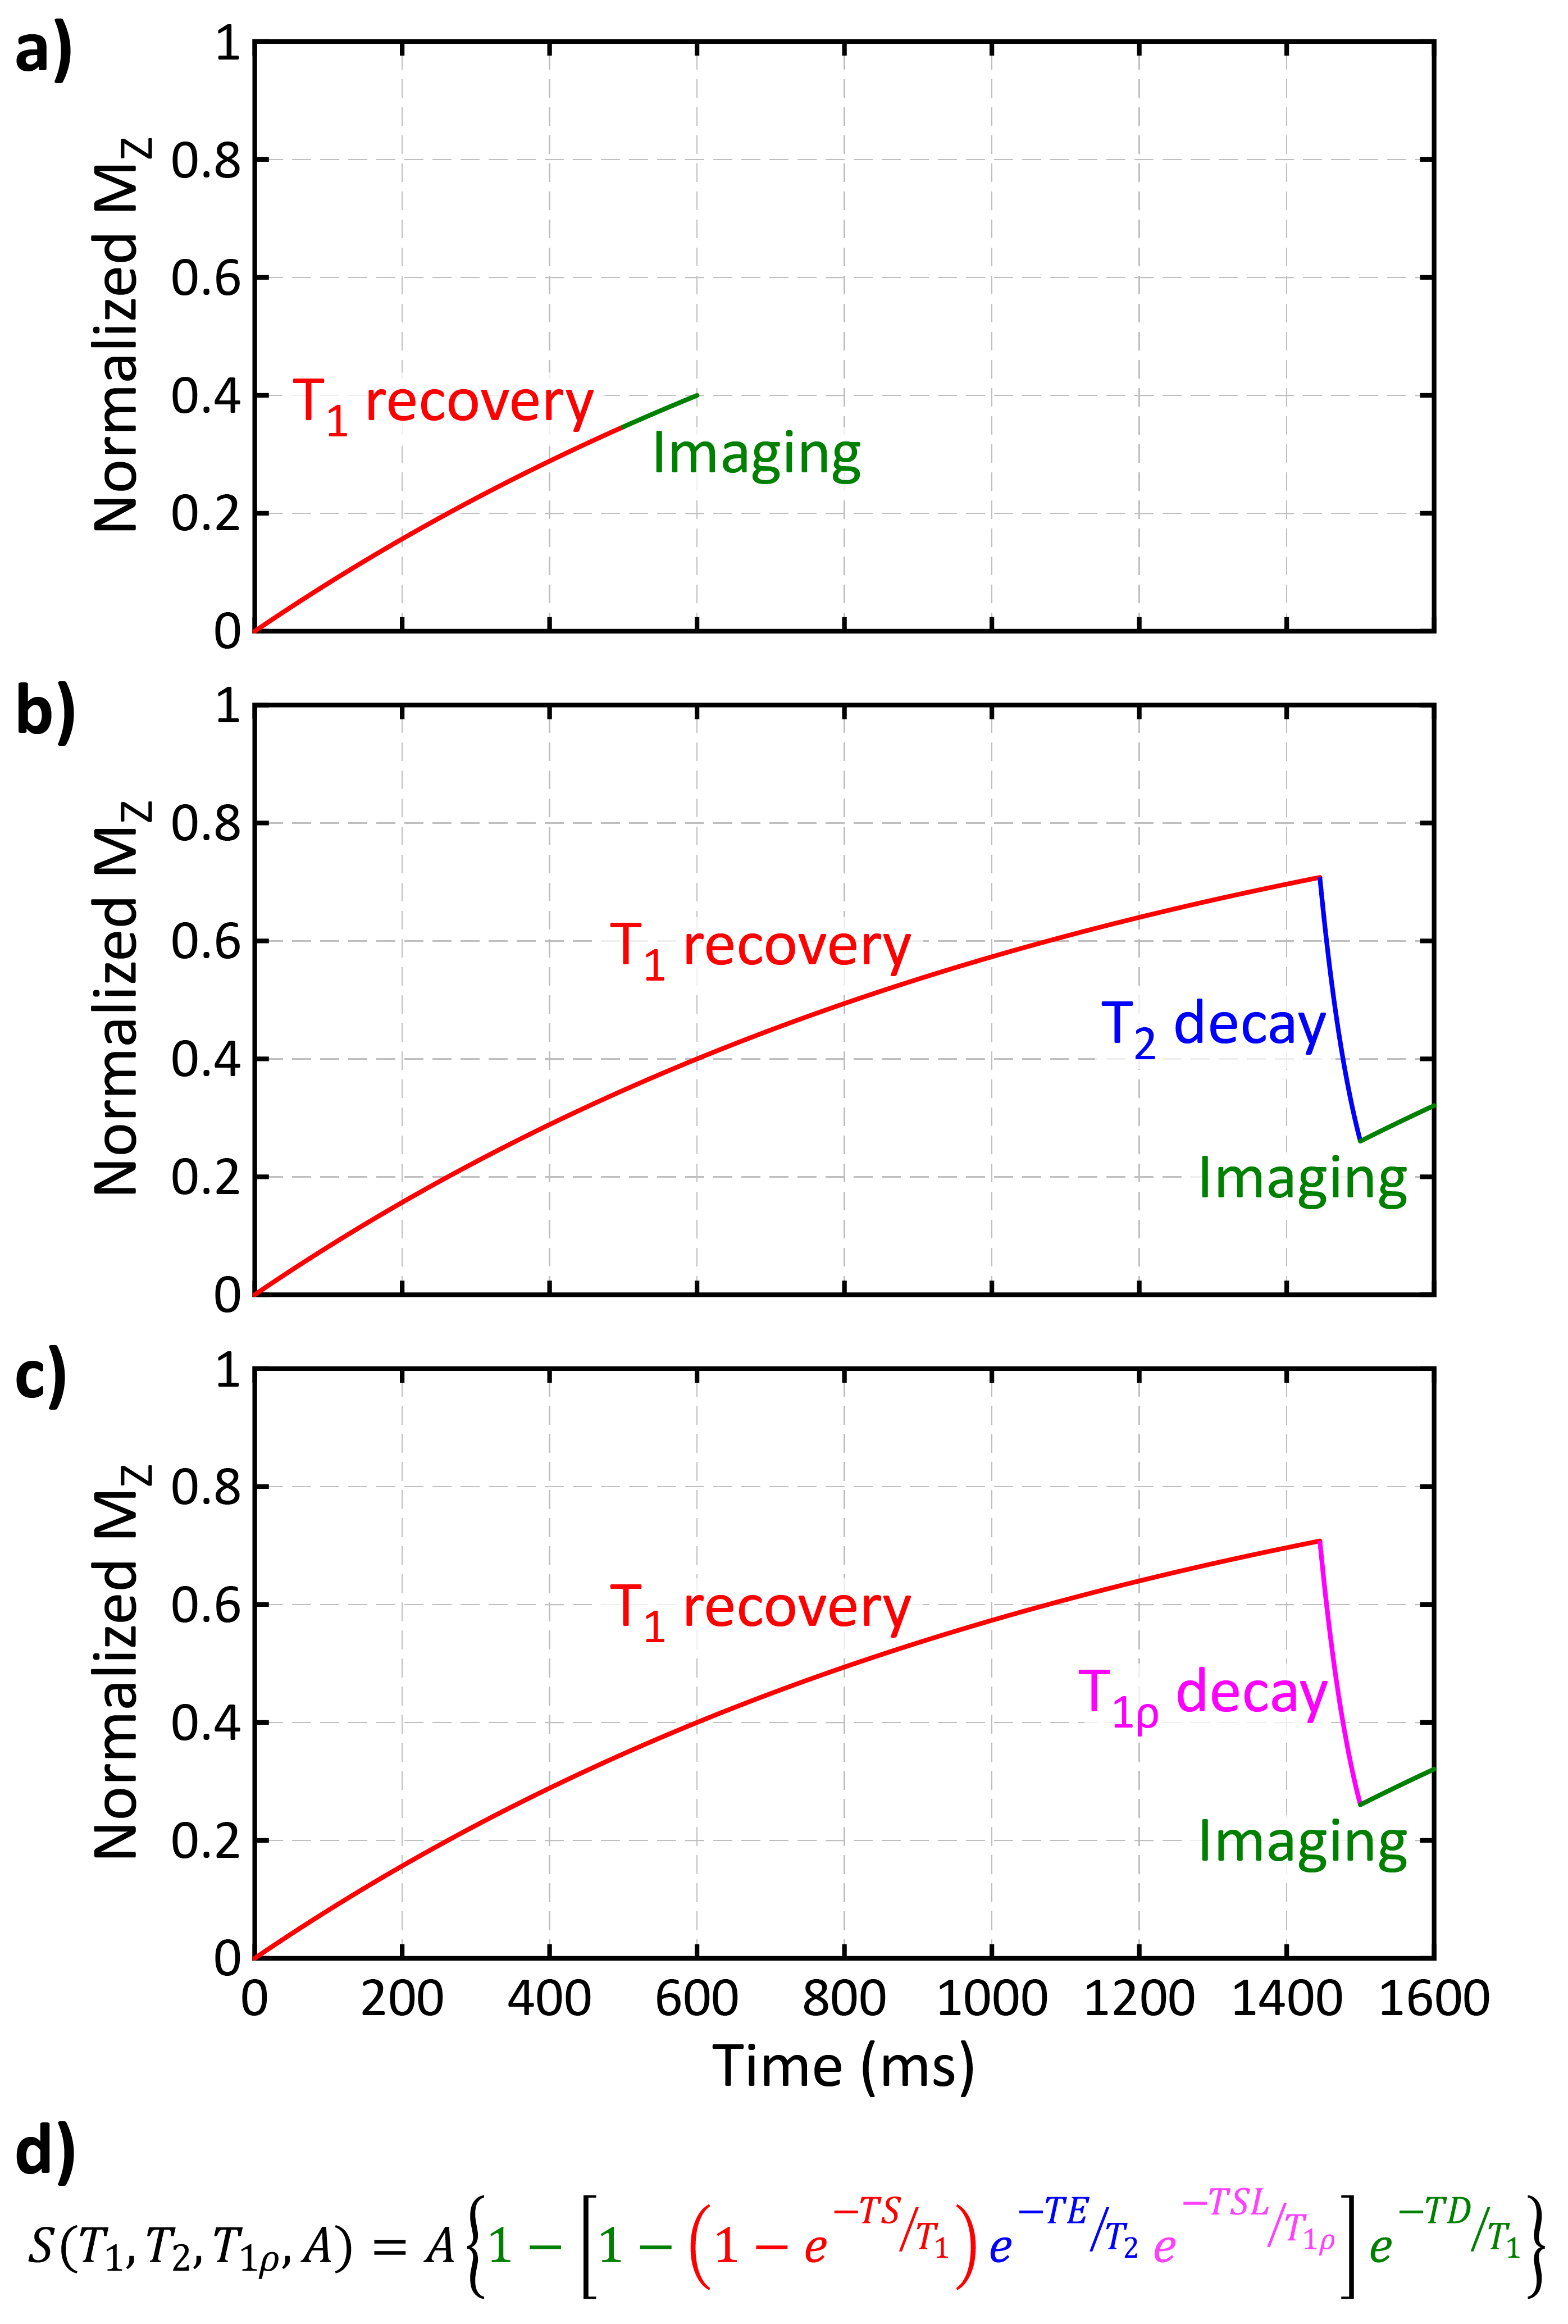
Fig. 2. The signal evolution of a) saturation-recovery (SR) images, b) SR plus T2-prepared images, and c) SR plus T1ρ prepared images. d) The signal intensity for every image can be represented as a 4-parameter model with variable combinations of T1 recovery, T2 decay, T1ρ decay, and imaging effects.

Fig. 3. Accuracy of mSASHA (breath-hold and free-breathing), SASHA, MOLLI, and T2p-bSSFP sequences as compared to spin-echo in a NiCl2-doped agarose T1MES phantom.

Fig. 4. T1, T2, and T1ρ maps from a volunteer at 1.5T using breath-hold and free-breathing mSASHA, SASHA, MOLLI, and T2p-bSSFP. An artifact in the T1ρ map at the inferolateral wall coincides with a region of off-resonance.
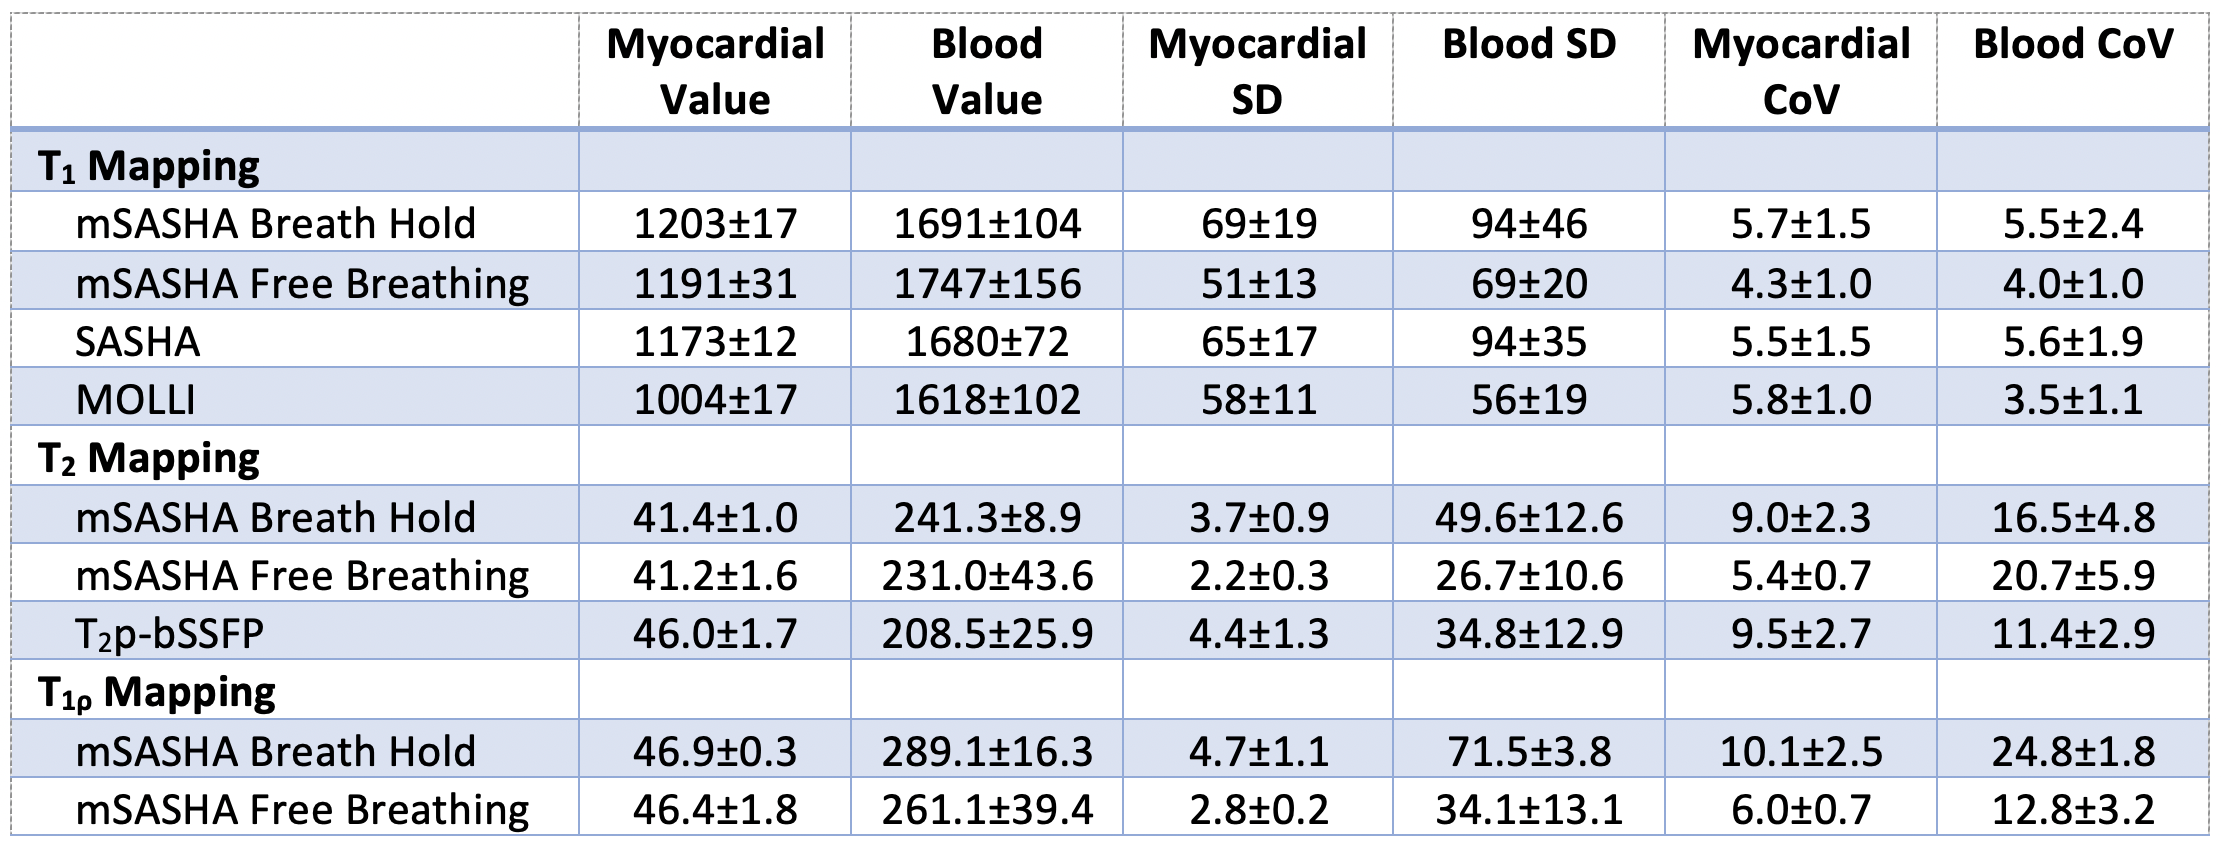
Fig. 5. T1, T2, and T1ρ measurements from 3 volunteers at 1.5T using breath-hold and free-breathing mSASHA, SASHA, MOLLI, and T2p-bSSFP. Standard deviation (SD) and coefficient of variation (CoV) values are also reported over the myocardial and blood ROIs.