4443
Influence of Spatial Resolution in T2* Maps of Intramyocardial Hemorrhage1Biomedical Imaging Research Institute, Cedars-Sinai Medical Center, Los Angeles, CA, United States, 2Bioengineering Department, UCLA, Los Angeles, CA, United States, 3Krannert Cardiovascular Research Center, Indiana University School of Medicine, Indianapolis, IN, United States
Synopsis
The influence of spatial resolution on T2*-based characterization of hemorrhage within myocardial infarctions (MI) has not been investigated. We hypothesized that partial volume could play a critical role in the detection and quantification of hemorrhagic remnants. Ex-vivo pig hearts with 8-week old MI were imaged with multi-gradient echo sequences with various in-plane and through-plane spatial resolutions. Our findings show that optimal detection of hemorrhagic remnants with T2* MRI at 3T requires imaging voxels to be between 5 and 7 mm3.
Background
T2* CMR is the preferred method for detecting and characterizing hemorrhagic myocardial infarction (MI)1; however, the influence of spatial resolution on T2*-based characterization of hemorrhagic remnants has not been investigated. While partial volume effects are not of major concern in the acute phase of MI, the wall thinning that accompanies chronic MI can challenge the characterization of hemorrhagic remnants within the infarct wall2,3.We hypothesized that in the presence of myocardial wall thinning in chronic MI, hemorrhagic remnants are not accurately quantified due to strong partial volume effects. We investigated our hypothesis in a pig model. To remove other confounding factors (motion, flow, and off-resonance artifacts) present in-vivo, we used excised pig hearts.
Methods
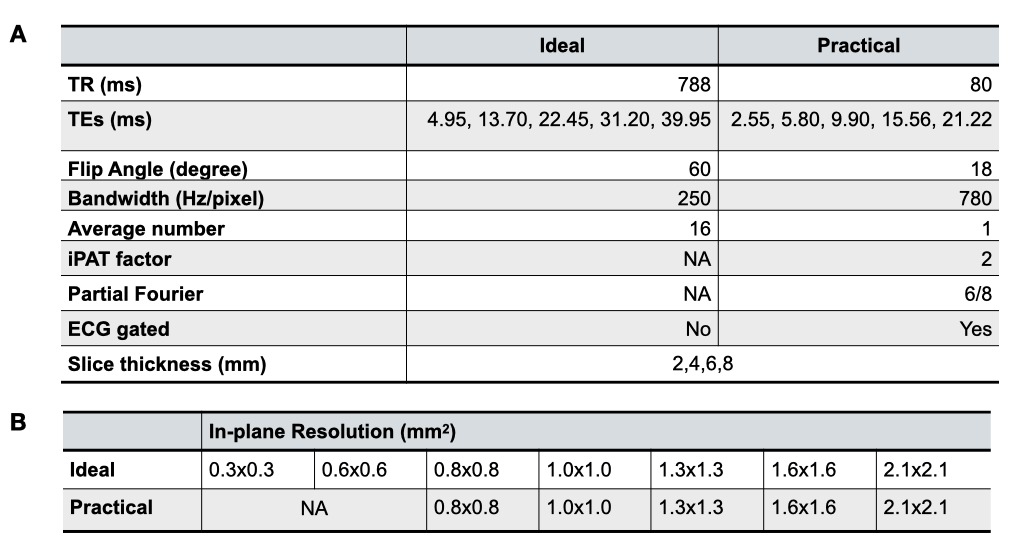
Animal study and sample preparation: Reperfused MIs were created in 10 farm pigs by complete occlusion of the LAD artery and reperfusion 90-minutes thereafter. Animals were euthanized at 8 weeks post-MI and the hearts were collected, rinsed and preserved in formalin.CMR Acquisitions: CMR was performed on a 3T whole-body MRI system (Siemens MAGNETOM, Erlangen, Germany). The hearts were placed in a formalin bath and were imaged with 2D multi-gradient echo sequences with varying in-plane and through-plane spatial resolutions (for scan parameters see Table 1A; Ideal corresponds to ignoring practical limitations such as scan duration, whereas Practical acquisitions are performed with realistic parameter sets). 28 Ideal and 20 Practical image data sets were available for analysis (Table-1B).
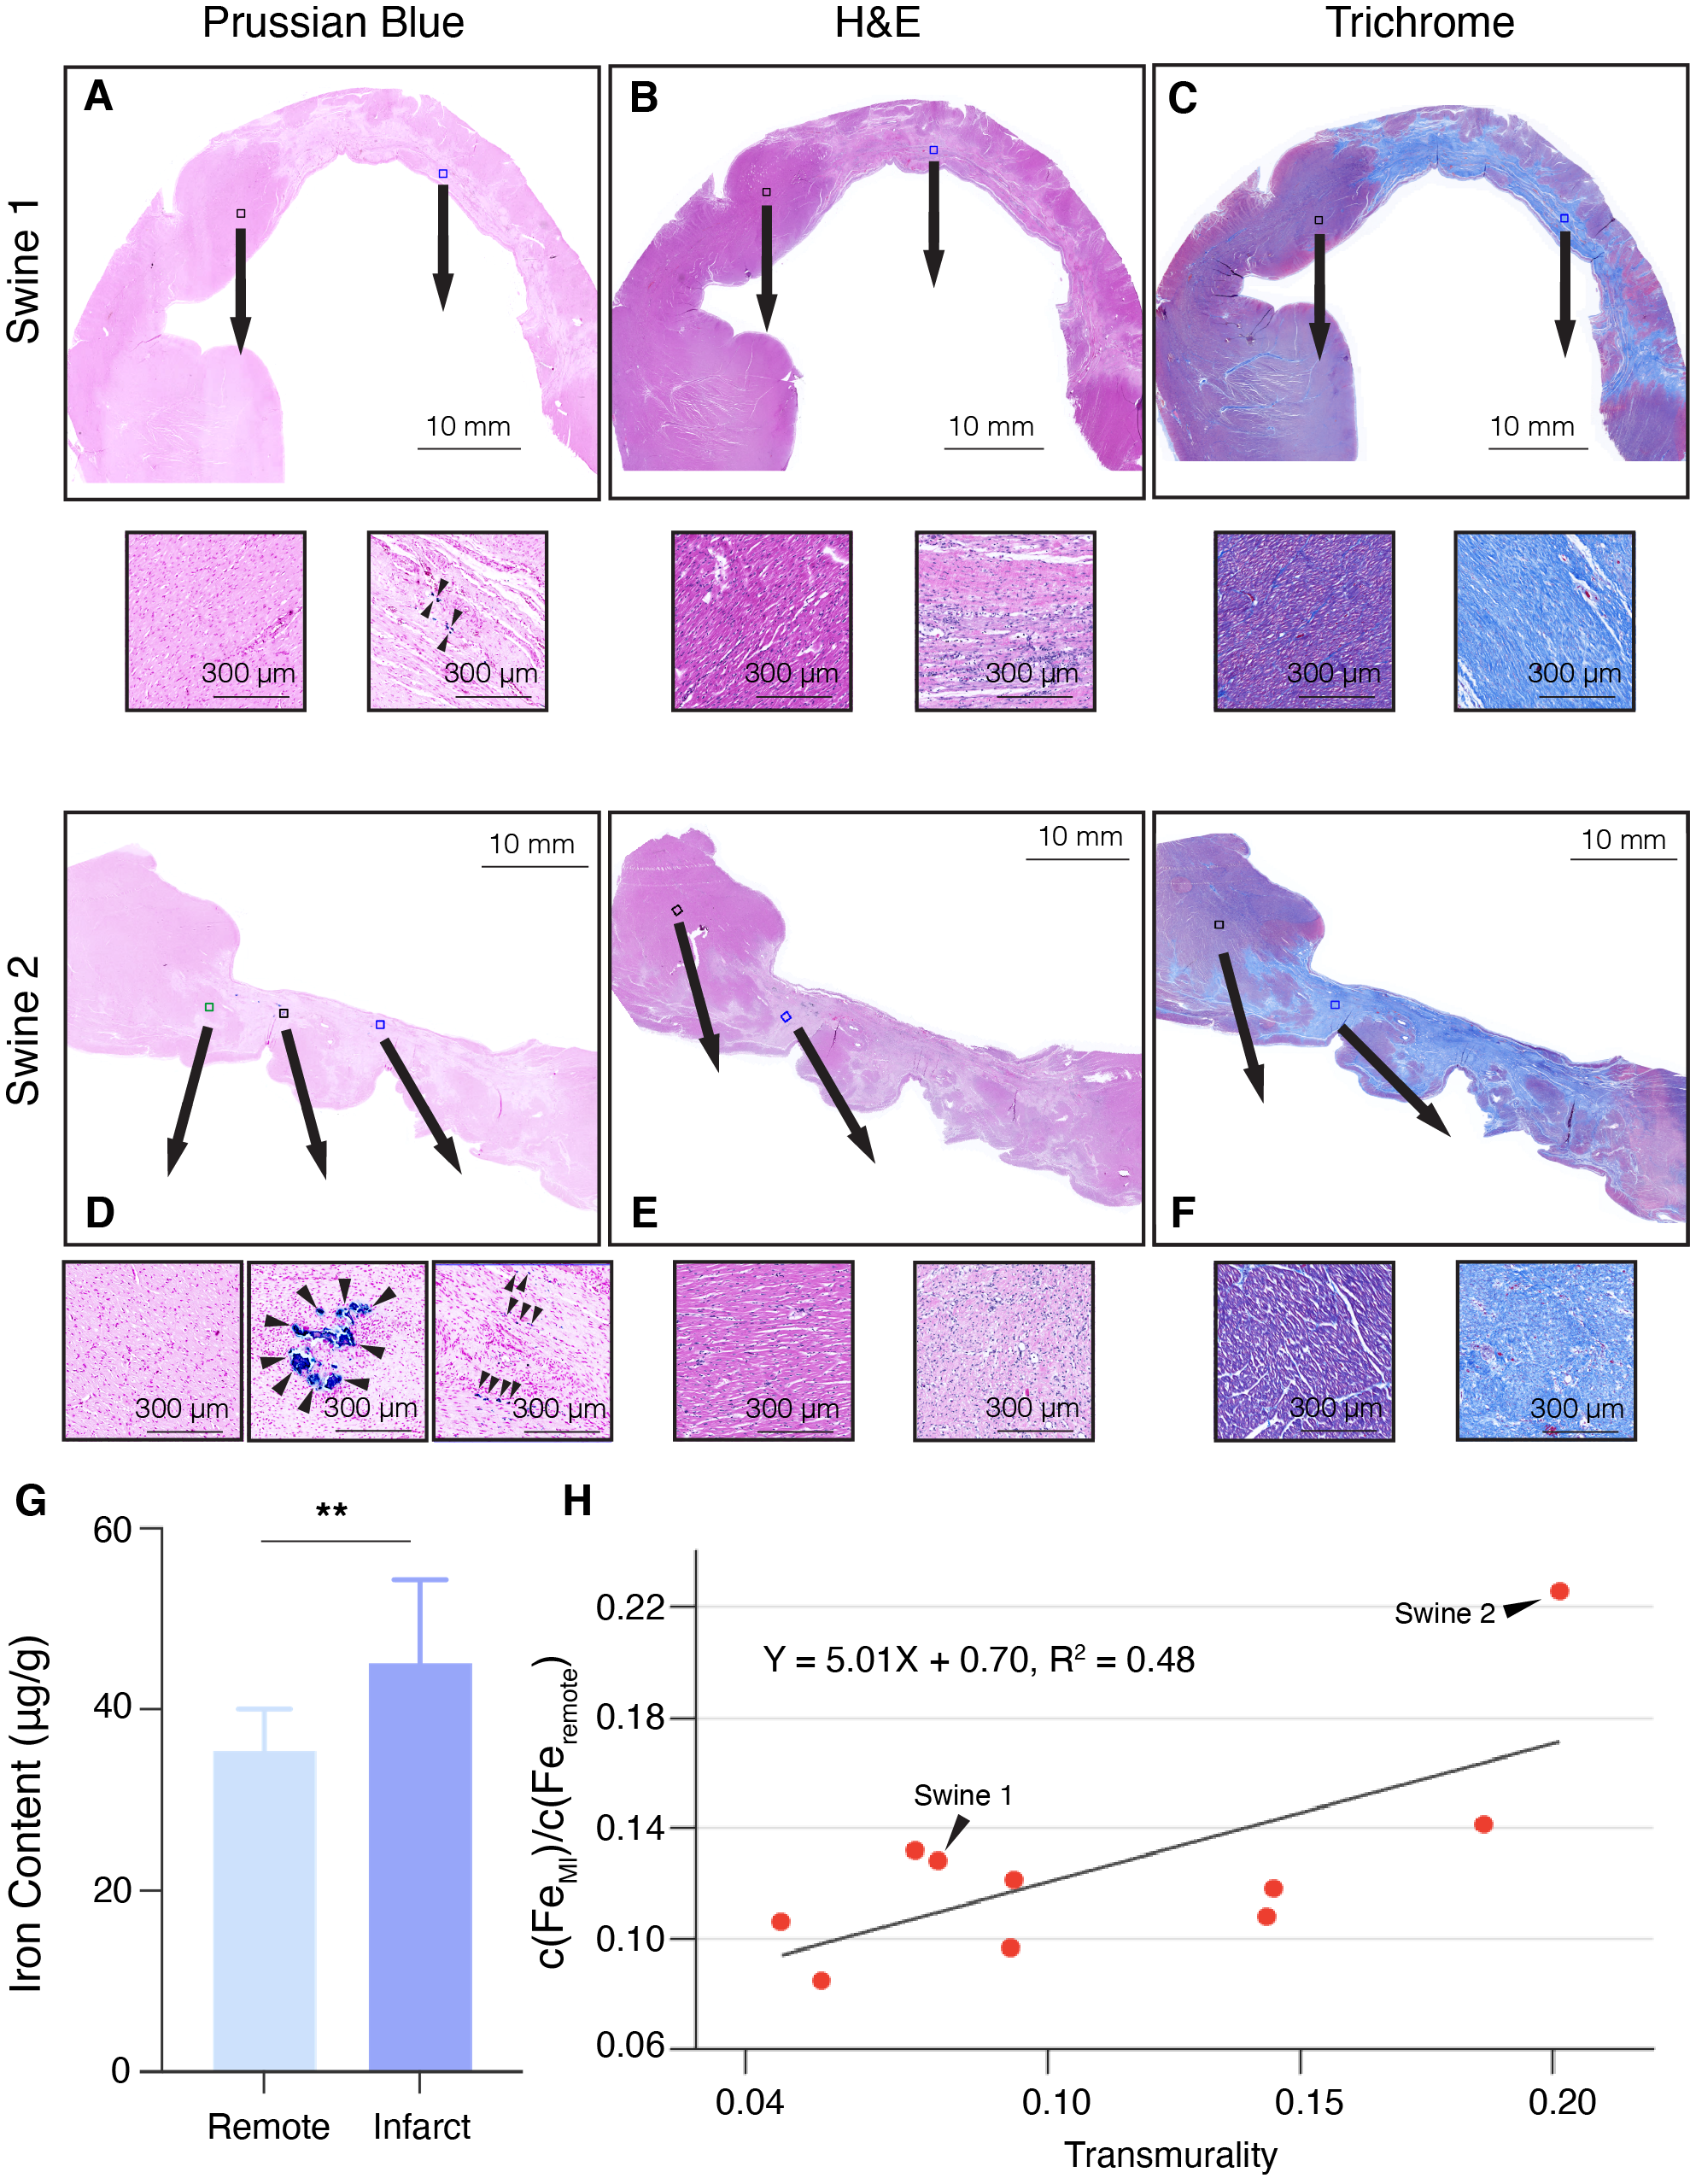
Histology and ICP-MS analysis: Region that includes whole IMH zone and partial remote myocardium was sectioned. 5 µm sections were stained with H&E, Masson Trichrome, and Prussian Blue and digitally imaged at 40x magnification. The total amount of iron deposited within each remote and IMH myocardial sample was measured using Inductively coupled plasma mass spectrometry (ICP-MS, NexION 2000, PerkinElmer) analysis.
Image Analysis: Endo- and epi-cardial contours were used to delineate the myocardial region. Subsequently, a mean-2SD criterion was used to delineate the hemorrhage core. The myocardium was evenly segmented into 50 segments and then mapped to the hemorrhage core. The data from the Ideal group with 0.3x0.3x2 mm3 served as the ground truth with the remaining datasets serving as variables.
Statistical Analysis: R2 of T2* fitting was computed and averaged within the myocardium region. The receiver operating characteristic (ROC) curve and its area under the curve (AUC) were computed. T-test was conducted between the Ideal and Practical groups. And two-way ANOVA was done on AUCs of all subjects in in-plane and through-plane dimensions.
Results
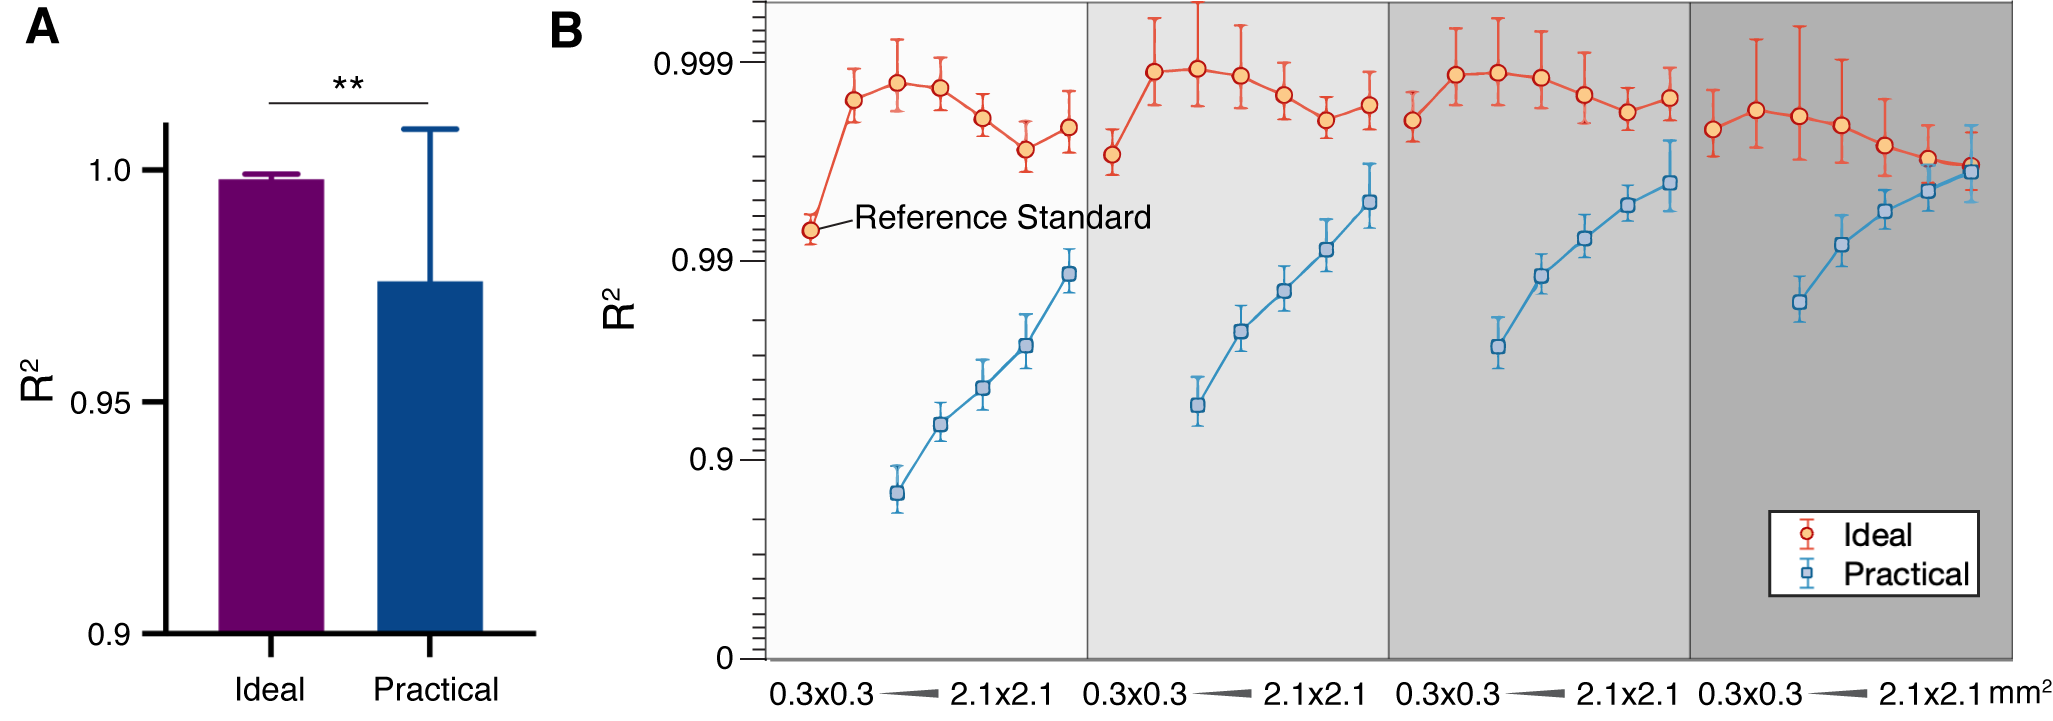
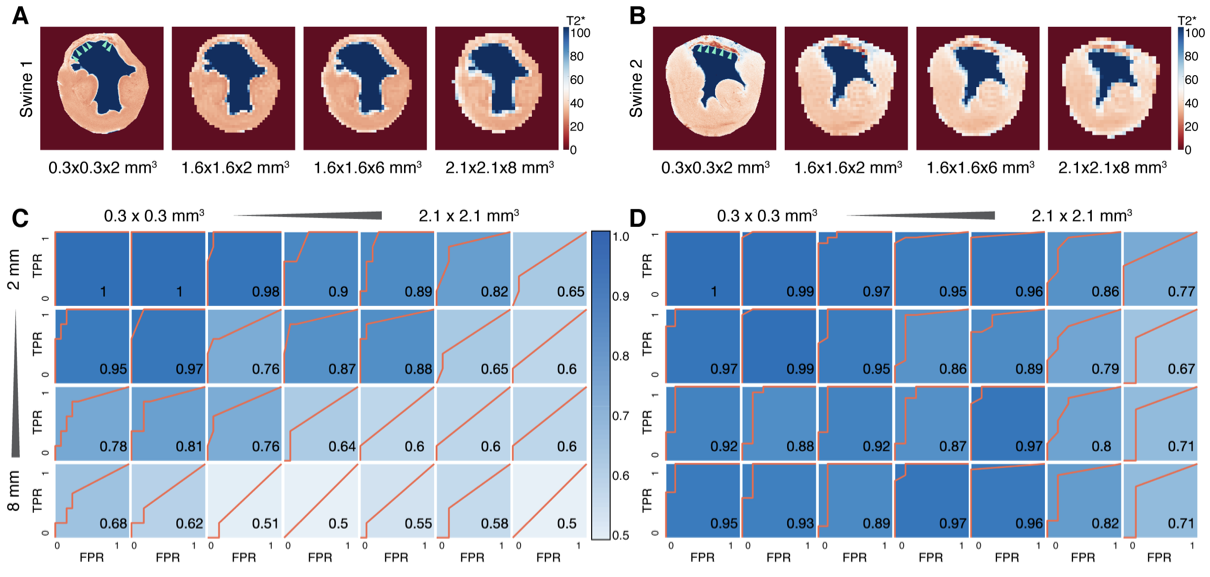
Fitting accuracy in the Ideal group is significantly better than the Practical group (Fig. 1A), indicating better SNR in the Ideal group. Notably, R2 of 0.3x0.3x2 m3 images is 0.9932±0.0012 (Fig. 1B). The finest resolution from the Ideal group can be used as ground truth and reference standard.Representative images from two animals (Swine 1 and Swine 2) are shown in Figure 2. Note that in both animals, the band of hemorrhagic remnants disappeared with coarser resolution. ROC analysis of both animals from Ideal data sets showed a trend toward lower AUC for both coarser in-plane and through-plane resolutions for swine 1 (Fig. 2C) and swine 2 (Fig. 2D).
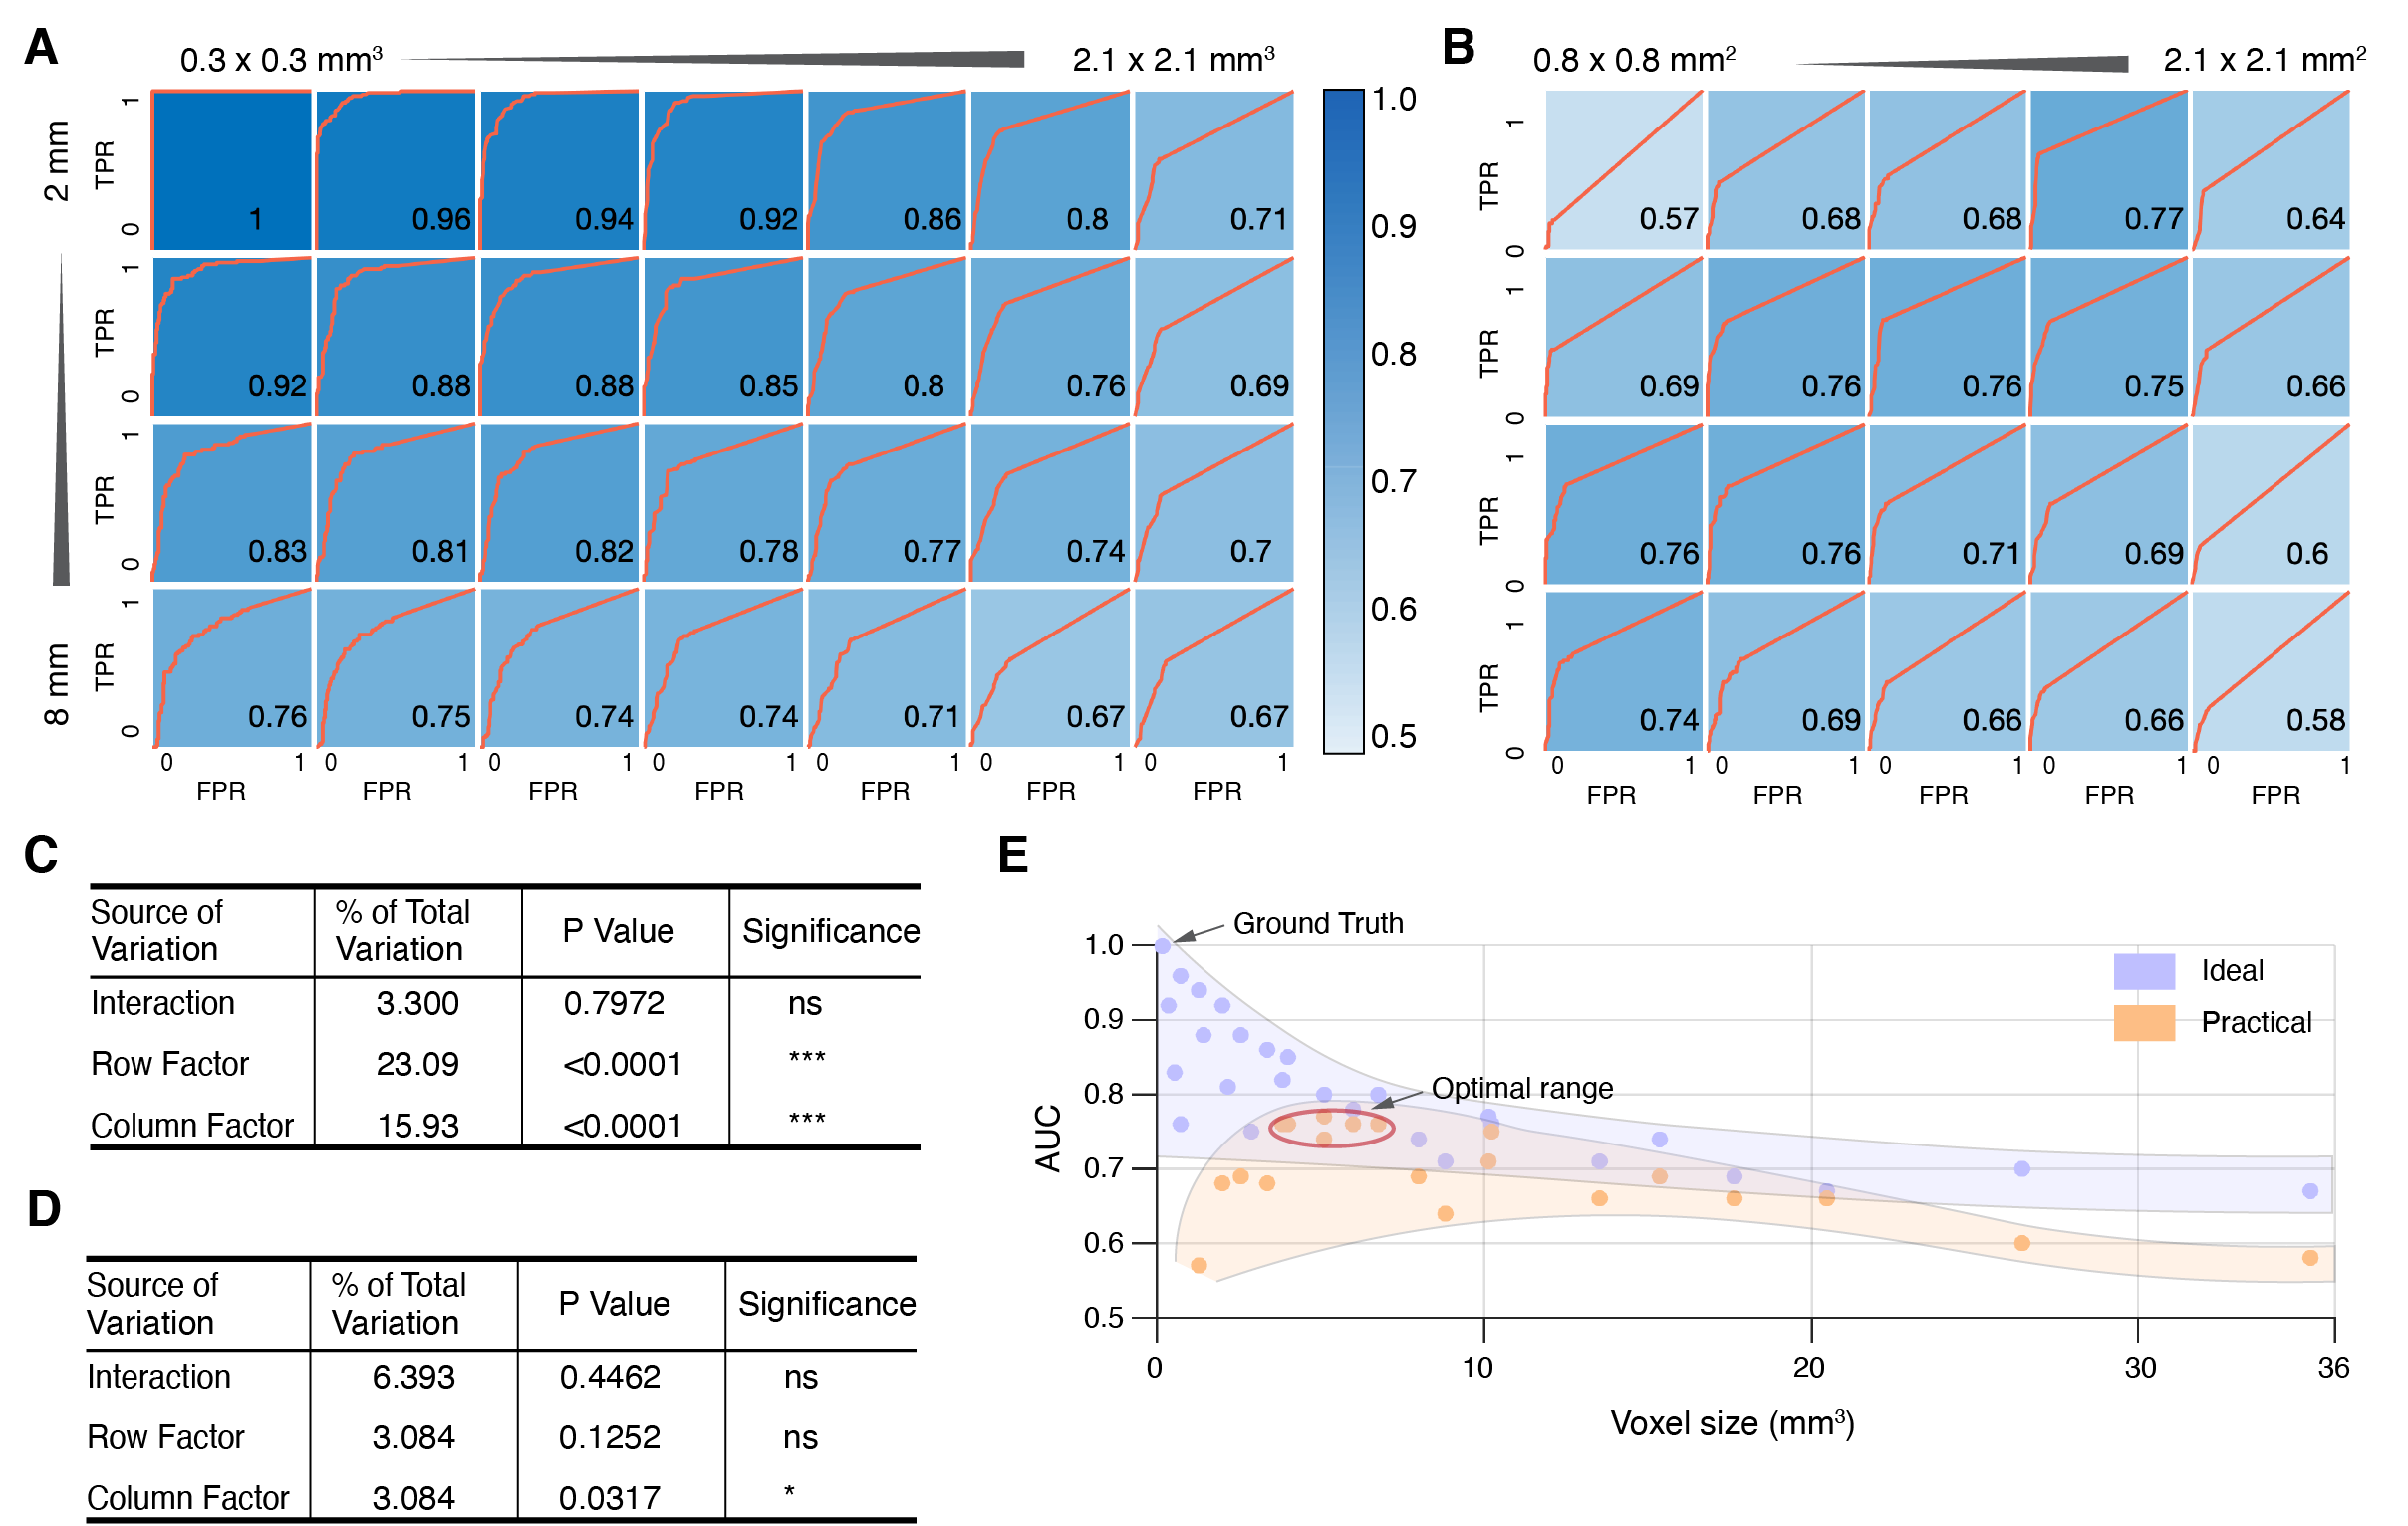
ROC analysis across all Ideal datasets showed that AUC is strongly dependent on both in-plane and through-plane resolution (Fig. 3A and 3C). Interestingly, ROC analysis of Practical datasets showed that through-plane resolution plays a prominent role in identifying hemorrhage bands than in-plane resolution (Fig. 3B and 3D). In Practical acquisitions, optimal AUC was observed from 1.6x1.6x2 to 0.8x0.8x8 mm3 anti-diagonally. This behavior is further evident in Fig. 3E, where peak AUC was achieved for voxel sizes between 5.12 to 6.76 mm3.
Pathological histology of two representative subjects (Fig. 4A-F) illustrate stained fibrotic and necrotic tissue with scattered iron deposition in the MI region. More iron stains from Swine 2 are shown than Swine 1 (Fig. 4A and Fig. 4D). The difference of iron deposition corroborated the MRI results between the two subjects, where larger IMH transmurality was observed in Swine 2 (Fig. 2A). Iron concentration is elevated in infarct regions. The iron content of the MI region is correlated with the transmurality of IMH (R2 = 0.48, Fig. 4H).
Discussion
Optimal performance was found from voxel size 5.12 to 6.76 mm3 in the Practical group. Specifically, highest performance is found from 1.6x1.6x2, 1.3x1.3x4, 1.0x1.0x4, 1.0x1.0x6 to 0.8x0.8x6 mm3 in Practical group (Fig. 3B). The total scan time for 0.8x0.8 mm2 is 19 seconds in the Practical group setting. For a patient with potential cardiovascular diseases, breath-holding for 20 seconds for a continuous period can be painfully demanding, suggesting that spatial resolution at 1.6x1.6x2 or 1.3x1.3x4 mm2 are more preferable in a practical CMR setting.Conclusion
We conclude that the accuracy of detecting hemorrhagic remnants with T2* maps at 3T within chronic MIs is strongly dependent on spatial resolution. Specifically, the optimal detection of hemorrhagic remnants with T2* CMR requires imaging voxels to between 5 and 7 mm3 with through-plane resolution of 2-4 mm and in-plane resolution 1.3x1.3-1.6x1.6 mm2.Acknowledgements
We greatly appreciate the support from Translational Pathology Core Laboratory at UCLA for histology staining, and use of ICP-MS facility within the UC Center for Environmental Implications of Nanotechnology in CNSI at UCLA.References
1. Kali A, Tang RL, Kumar A, Min JK, Dharmakumar R. Detection of acute reperfusion myocardial hemorrhage with cardiac MR imaging: T2 versus T2. Radiology. 2013; 269:387–395.
2. Dipan JS, Kim HW, James O, et al. Prevalence of Regional Myocardial Thinning andRelationship With Myocardial Scarring in Patients With Coronary Artery Disease. J AmMed Assoc. 2013 March 6; 309(9): 909–9182.
3. Takigawa M, Martin R, Cheniti G, et al. Detailed comparison between the wallthickness and voltages in chronic myocardial infarction. J Cardiovasc Electrophysiol.2019; 30:195-204.
Figures