4441
Restored Torsion and Longitudinal Strain in ACE Inhibitor Treated Hypertension1Stanford Cardiovascular Institute, Stanford University, Stanford, CA, United States, 2Department of Radiology, Stanford University, Stanford, CA, United States, 3Auckland Bioengineering Institute, University of Auckland, Auckland, New Zealand, 4Department of Anatomy and Medical Imaging, University of Auckland, Auckland, New Zealand, 5Department of Biomedical Engineering, King's College London, London, United Kingdom, 6Department of Engineering Science, University of Auckland, Auckland, New Zealand
Synopsis
Tagged CMR was used to measure torsion and longitudinal strain in a rodent model of hypertensive heart disease. Long-term ACE inhibitor treatment restored ejection fraction, torsion and longitudinal strain by 24 months of age. Longitudinal strain was the first functional measure to be restored, and this may indicate that longitudinal strain is a sensitive imaging biomarker for assessing the efficacy of treatment with regards to reverse remodeling in hypertension.
Introduction
Cardiac performance is routinely assessed through left ventricular (LV) ejection fraction, measured using cardiac magnetic resonance (CMR). However, emerging evidence points towards the prognostic value of alternate metrics of cardiac function such as LV torsion and global longitudinal strain [1]–[3]. Longitudinal strain has been demonstrated to be lower in hypertensive patients [4], [5], and torsion is lower in hypertensive patients with eccentric hypertrophy [6].Angiotensin converting enzyme (ACE) inhibitors are one type of routinely prescribed treatments for hypertension. ACE inhibitors reduce blood pressure through the renin-angiotensin-aldosterone system, and can reverse hypertrophy, as well as myocardial fibrosis [7]. To our knowledge no studies have assessed the impact of ACE inhibitor treatment on LV longitudinal strain and torsion.
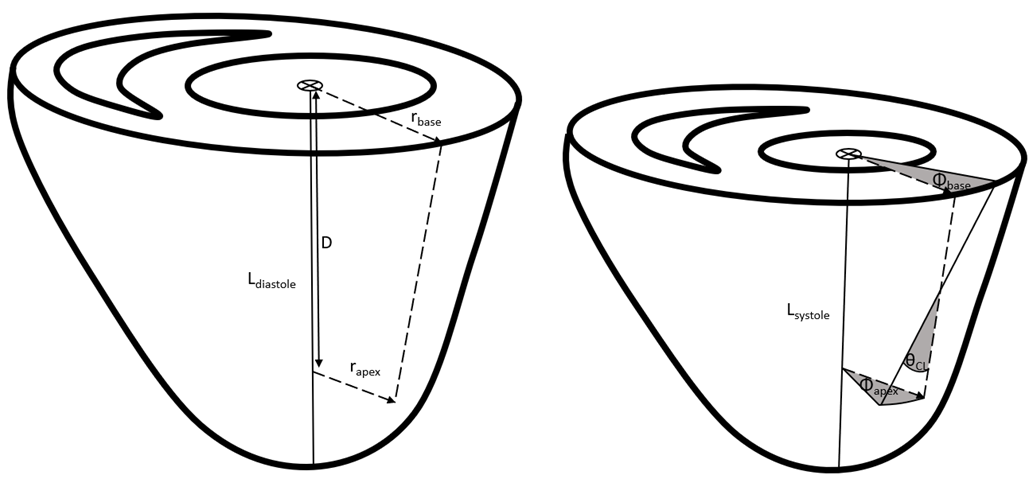
Herein, we measured LV torsion and longitudinal strain (Figure 1) in rodents using tagged CMR. We used the spontaneously hypertensive rat (SHR) model of hypertensive heart disease, and at 3 months of age we began ACE inhibitor treatment (quinapril) in a subset of SHRs. Our hypotheses were: (i) that ACE inhibitor treatment reduces hypertrophy and hypertension in the SHRs; and (ii) that ACE inhibitor treatment restores torsion and longitudinal strain.
Methods
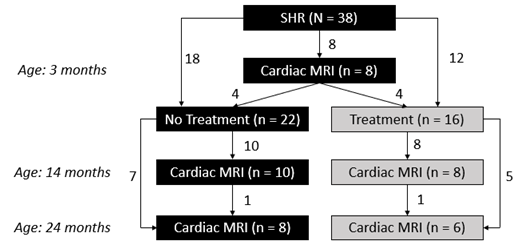
This study was approved by the Animal Ethics Committee of the University of Auckland (Ref: 001119). The SHRs (n = 38, all male, Harlan Laboratories IN) underwent CMR at 3 months of age. Subsequently, these SHRs were split into a group receiving no treatment (n = 22) and a treated SHR (TSHR) group receiving the ACE inhibitor quinapril via their drinking water (n = 16). These rats underwent CMR at 14 months and 24 months of age (Figure 2).CMR was performed using a 4.7 T preclinical Varian scanner with a UnityInova spectrometer. A birdcage volume coil (72mm inner diameter) was used for both transmitting and receiving. The acquisitions were gated to the rat’s electrocardiogram, which was monitored (Small Animal Instruments Inc, NY). Anatomical (T1-weighted) and tagged CMR scans were acquired at six short-axis and three long-axis slices (18 cardiac phases).
Both the T1-weighted and tagged CMR data was analyzed using Cardiac Image Modeller software (v 8.1.5, University of Auckland, New Zealand). To measure torsion, one basal short-axis slice and one apical short-axis slice were analyzed. The software calculated a 2D deformation field, which provided the LV rotation within the short-axis plane, and then LV torsion was calculated using Eq. 1. The long-axis slice with the least longitudinal-radial shear was analyzed, and longitudinal strain calculated using Eq. 2.
$$\bf Equation \ 1: \ \it Torsional \ Shear \ Angle \ (\theta_{CL},degrees) = \frac{(\phi_{apex}-\phi_{base})(r_{apex}+r_{base})}{2D}$$$$\bf Equation \ 2: \ \it Global \ Longitudinal \ Strain \ (proportion) \it = \frac{L_{diastole}-L_{systole}}{L_{diastole}} $$
Results
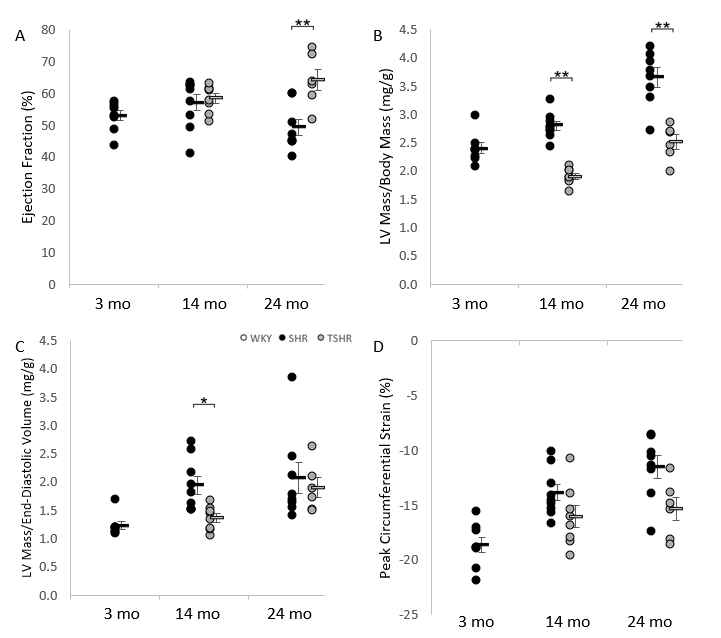
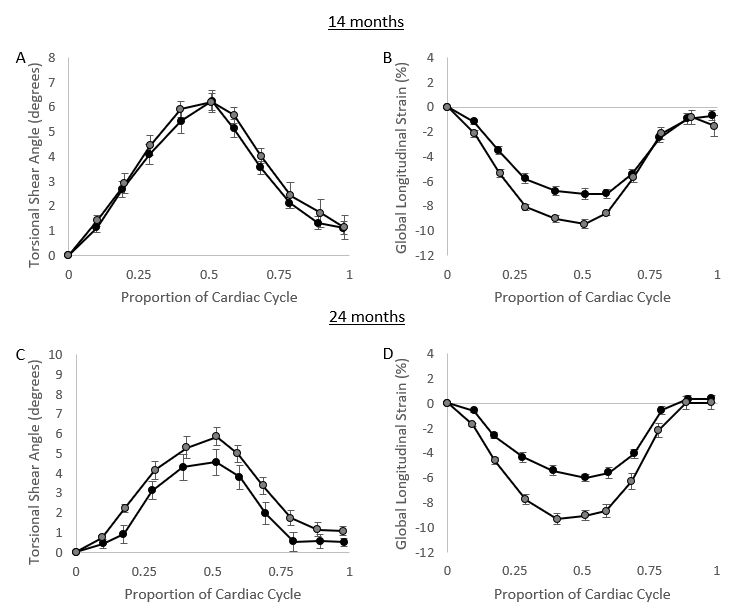
The TSHRs showed similar ejection fraction to the untreated SHRs at 14 months of age, but by 24 months the ACE inhibitor treatment resulted in a significantly greater ejection fraction in the TSHR group compared with the untreated SHRs (Figure 3A). The TSHRs had significantly reduced hypertrophy at both 14 months and 24 months of age as measured as LV mass/body mass (Figure 3B). SHRs had concentric hypertrophy as measured by LV mass/end-diastolic volume (Figure 3C). This concentric hypertrophy was significantly different between treated and untreated SHRs at 14 months of age, but not at 24 months of age. Peak LV circumferential strain was not significantly different between SHR and TSHR groups at 14 months or 24 months. Qualitatively, however, the magnitude of circumferential strain dropped less through time in the TSHR group compared to the untreated SHR group (Figure 3D).1The LV torsion and longitudinal strain measures were examined through the cardiac cycle (Figure 4). At 14 months, the torsion profiles were similar between SHR and TSHR groups. However by 24 months, the TSHR had significantly greater torsion than the untreated SHRs. The difference was more marked in the longitudinal strain, where the TSHR had significantly greater longitudinal strain magnitude than the SHRs at both 14 months and 24 months. In terms of functional biomarkers, longitudinal strain showed significant differences between treated and diseased groups at 14 months, while ejection fraction and torsion only showed significant differences at 24 months of age.
Discussion
ACE inhibitor treatment restored cardiac function, although the effect was delayed. The impaired ejection fraction in the TSHR group at 14 months is interesting as it was not due to hypertension or hypertrophy. This reduced ejection may be due to reduced biomechanical efficiency of the heart, as has been previously reported [8]. Another consideration is that although ACE inhibitor treatment reduces total collagen, endomysial collagen surrounding myocytes is still high in treated SHRs, potentially impairing cardiomyocyte cross-sectional expansion [7]. Additionally, ACE inhibitor treatment prevents the deposition of collagen between sheetlets, which likely contributes to the improved torsion and longitudinal strain in the TSHR group [7].Conclusion
Long-term ACE inhibitor treatment restored LV ejection fraction, torsion, and longitudinal strain by 24 months of age. LV longitudinal strain was the first functional measure to be restored, and this may indicate that longitudinal strain is a sensitive imaging biomarker for assessing the efficacy of treatment with regards to reverse remodeling in hypertension.Acknowledgements
We gratefully acknowledge New Zealand Government funding from the Marsden Fund administered by the Royal Society of New Zealand and from the Health Research Council of New Zealand.References
[1] K. Kalam, P. Otahal, and T. H. Marwick, “Prognostic implications of global LV dysfunction: A systematic review and meta-analysis of global longitudinal strain and ejection fraction,” Heart, vol. 100, no. 21, pp. 1673–1680, 2014, doi: 10.1136/heartjnl-2014-305538.
[2] T. Stanton, R. Leano, and T. H. Marwick, “Prediction of all-cause mortality from global longitudinal speckle strain: Comparison with ejection fraction and wall motion scoring,” Circ. Cardiovasc. Imaging, vol. 2, no. 5, pp. 356–364, 2009, doi: 10.1161/CIRCIMAGING.109.862334.
[3] K. Wan et al., “Left ventricular myocardial deformation on cine MR images: Relationship to severity of disease and prognosis in light-chain amyloidosis,” Radiology, vol. 288, no. 1, pp. 73–80, 2018, doi: 10.1148/radiol.2018172435.
[4] T. Yingchoncharoen, S. Agarwal, Z. B. Popović, and T. H. Marwick, “Normal ranges of left ventricular strain: A meta-analysis,” J. Am. Soc. Echocardiogr., vol. 26, no. 2, pp. 185–191, 2013, doi: 10.1016/j.echo.2012.10.008.
[5] L. G. Kearney et al., “Global longitudinal strain is a strong independent predictor of all-cause mortality in patients with aortic stenosis,” Eur. Heart J. Cardiovasc. Imaging, vol. 13, no. 10, pp. 827–833, 2012, doi: 10.1093/ehjci/jes115.
[6] M. Cameli, M. Lisi, F. M. Righini, A. Massoni, and S. Mondillo, “Left ventricular remodeling and torsion dynamics in hypertensive patients,” Int. J. Cardiovasc. Imaging, vol. 29, no. 1, pp. 79–86, 2013, doi: 10.1007/s10554-012-0054-0.
[7] A. J. Wilson et al., “Myocardial Laminar Organization Is Retained in Angiotensin-Converting Enzyme Inhibitor Treated SHRs,” Exp. Mech., 2020, doi: 10.1007/s11340-020-00622-4.
[8] J. C. Han et al., “Reduced mechanical efficiency in left‐ventricular trabeculae of the spontaneously hypertensive rat,” Physiol. Rep., vol. 2, no. 11, pp. 1–13, 2014, doi: 10.14814/phy2.12211.
Figures