4439
Accelerated cardiac T1 mapping with bidirectional LSTMs and cyclic model-based loss1Department of Biomedical Engineering, University of Utah, Salt Lake City, UT, United States, 2Utah Center for Advanced Imaging Research, University of Utah, Salt Lake City, UT, United States, 3Department of Cardiology, University of Utah, Salt Lake City, UT, United States
Synopsis
Cardiac T1 mapping has been shown to be a promising method for assessing different cardiomyopathies. Most cardiac T1 mapping methods require long breath holds during the acquisition which can be difficult for patients particularly during exercise or pharmacologically induced stress. Here we proposed using a multi-layer bidirectional LSTM with fully connected output and a cyclic model-based loss function to reduce the acquisition time of T1 mapping sequences without significant loss of quality.
Introduction
Cardiac T1 mapping has shown promise in differentiating various cardiomyopathies [1-5]. The 11-heartbeat MOLLI-5(3)3 and the MOLLI-4(1)3(1)2 sequences [6] are among the most popular T1 mapping sequences for pre-contrast and post-contrast T1 mapping respectively due to their high precision. Recently, stress and rest native T1 mapping was used to detect obstructive coronary artery disease (CAD) without the use of gadolinium-based contrast agents [7-9]. However, long breath holds during scans can be difficult for patients particularly during exercise or pharmacologically induced stress. These breath holds result in loss of stress time due to longer rest periods and can lead to poor quality T1 maps. Shorter sequences using 9 heart beats [10] and 10 heart beats [11] have been shown but result in reduced precision compared to the MOLLI sequences [12]. To reduce scan times without compromising the quality of the MOLLI sequences, we propose using a multi-layer bidirectional long short-term memory (LSTM) with fully connected output and a cyclic model-based loss function to generate high-quality T1 maps from a reduced number of T1-weighted images.Methods
Data Acquisition and Processing911 pre-contrast datasets from 202 patients and 574 post-contrast datasets from 193 patients were acquired using the MOLLI-5(3)3 sequence and the MOLLI-4(1)3(1)2 sequence respectively. All acquisitions used similar parameters: $$$TR = 2.2\ ms$$$, $$$TE=1.12\ ms$$$,and $$$FA=35^{\circ}$$$. The T1-weighted images were motion compensated, cropped to $$$128\ x\ 128$$$, and vectorized giving dimensions of $$$batch\ x\ T\ x\ 2$$$ as input to the network. $$$T$$$ corresponds to the number of T1-weighted images and inversion times used as input for pre-contrast ($$$T=3$$$) and post-contrast ($$$T=2$$$) acquisitions. Reference T1 maps were generated using the full MOLLI-5(3)3 and MOLLI-4(1)3(1)2 sequences and the three-parameter T1 recovery model [13] shown in Equations 1-2
$$ S(t) = A - B*e^{-TI/T1^{*}} \quad (1) $$
$$ T1 = T1^{*}*(B/A - 1) \quad (2) $$
where $$$A$$$, $$$B$$$, and $$$T1$$$ are the three fitting parameters, $$$S(t)$$$ are the T1-weighted images and $$$TI$$$ are their corresponding inversion times. T1 maps generated using the reduced three-parameter model with $$$T=3$$$ T1-weighted images and inversion times for pre-contrast and $$$T=2$$$ T1-weighted images and inversion times for post-contrast were used for comparison with the proposed network. T1 values greater than $$$5000\ ms$$$ and less than $$$0\ ms$$$ were set to zero.
Network
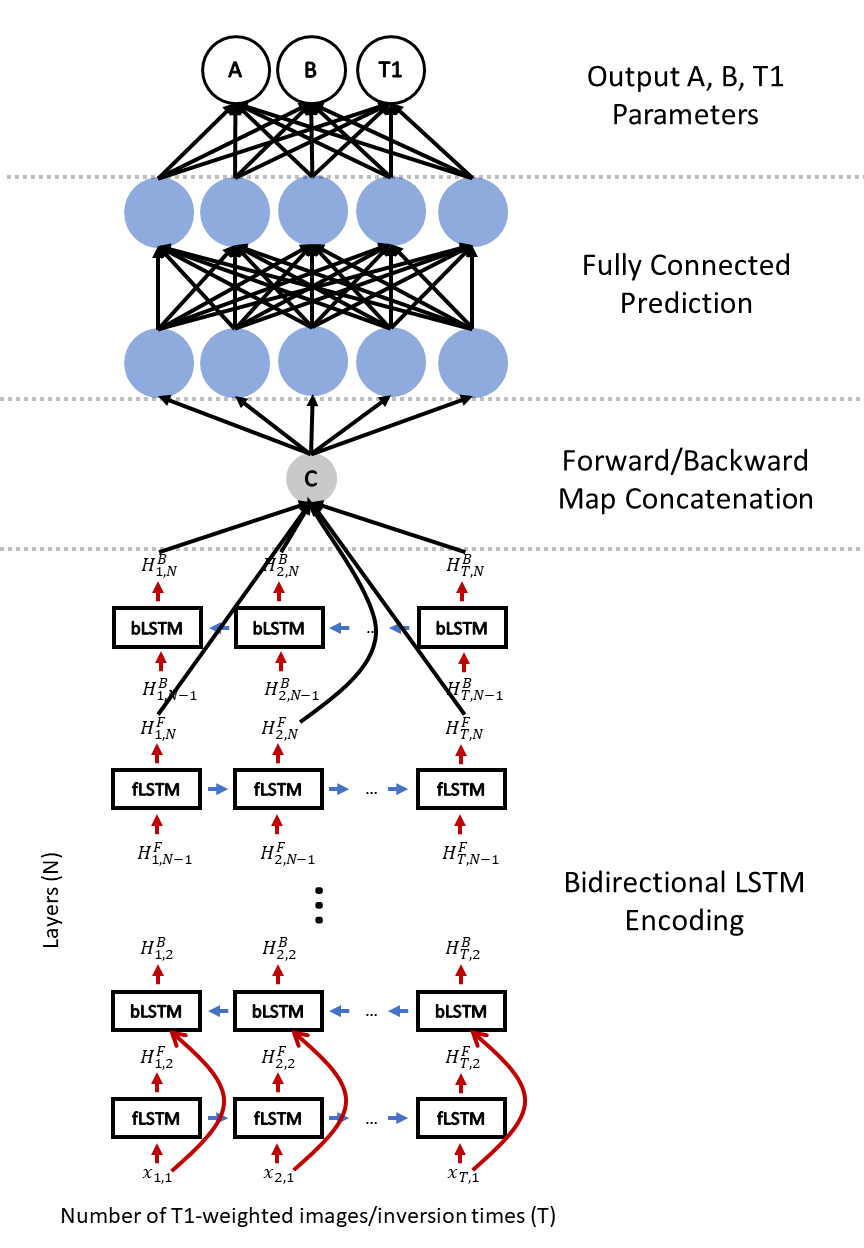
We used a multi-layer ($$$N=7$$$) bidirectional LSTM to generate an encoding of the input T1-weighted images and inversion times. We used learnable initial hidden and cell states to improve the learning procedure and a fully connected output to predict the $$$A$$$, $$$B$$$, and $$$T1$$$ parameters. Figure 1 shows the architecture of the proposed network. Training was done using a cyclic model-based loss function and the L1 loss function for 100 epochs using an NVIDIA P40 GPU on a Linux Fedora 26 operating system with the PyTorch framework and took approximately 8 hours. The loss function is described by Equation 3 below where
$$ L(A,B,T1,\widehat{T1}) = \left \| \widehat{S(t)} - S(t) \right \| + \left \| \widehat{T1} - T1 \right \| \quad (3) $$
$$$A$$$, $$$B$$$, and $$$T1$$$ are the network-generated parameters and $$$S(t)$$$ is the signal intensity generated from the network using the three-parameter model in Equation 1. $$$\widehat{S(t)}$$$ and $$$\widehat{T1}$$$ are the reference signals intensities and T1 maps respectively. The Adam optimizer was used with a learning rate of $$$0.0003$$$ and a batch size of $$$2^{15}$$$. The proposed architecture contains approximately $$$1.35\ million$$$ parameters. Training was performed on 657 datasets, validation was performed on 106 datasets, and testing was performed on 146 datasets for the pre-contrast network. Training was performed on 427 datasets, validation was performed on 63 datasets, and testing was performed on 82 datasets for the post-contrast network.
Results
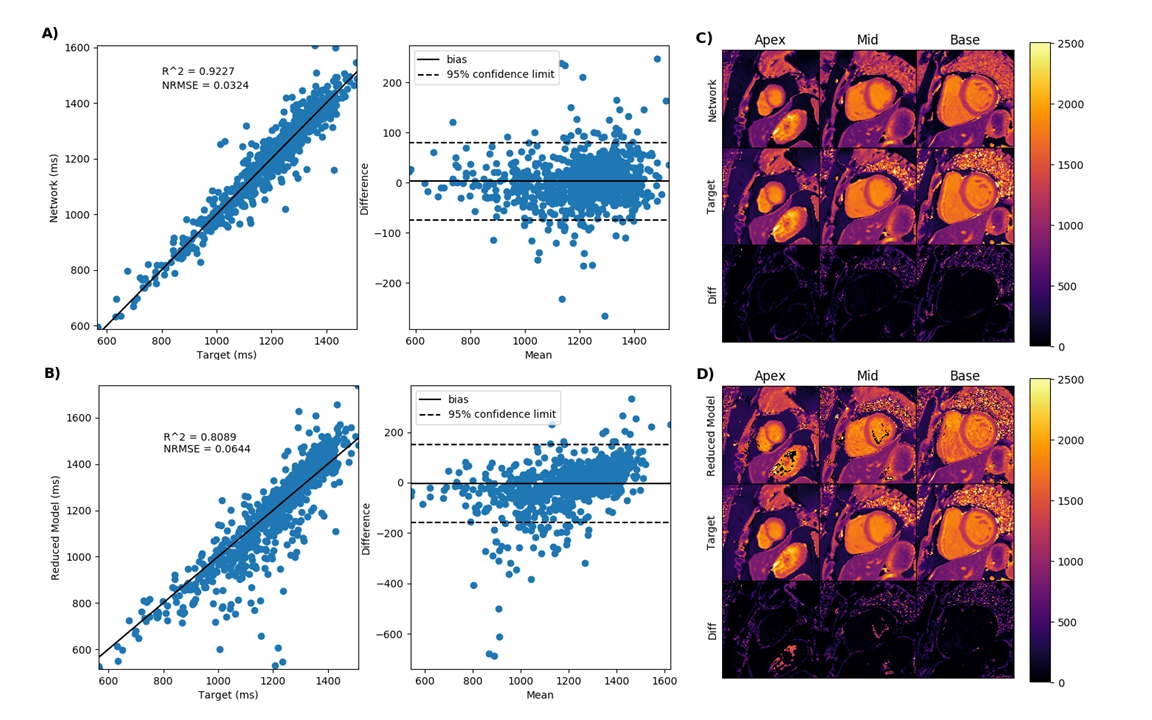
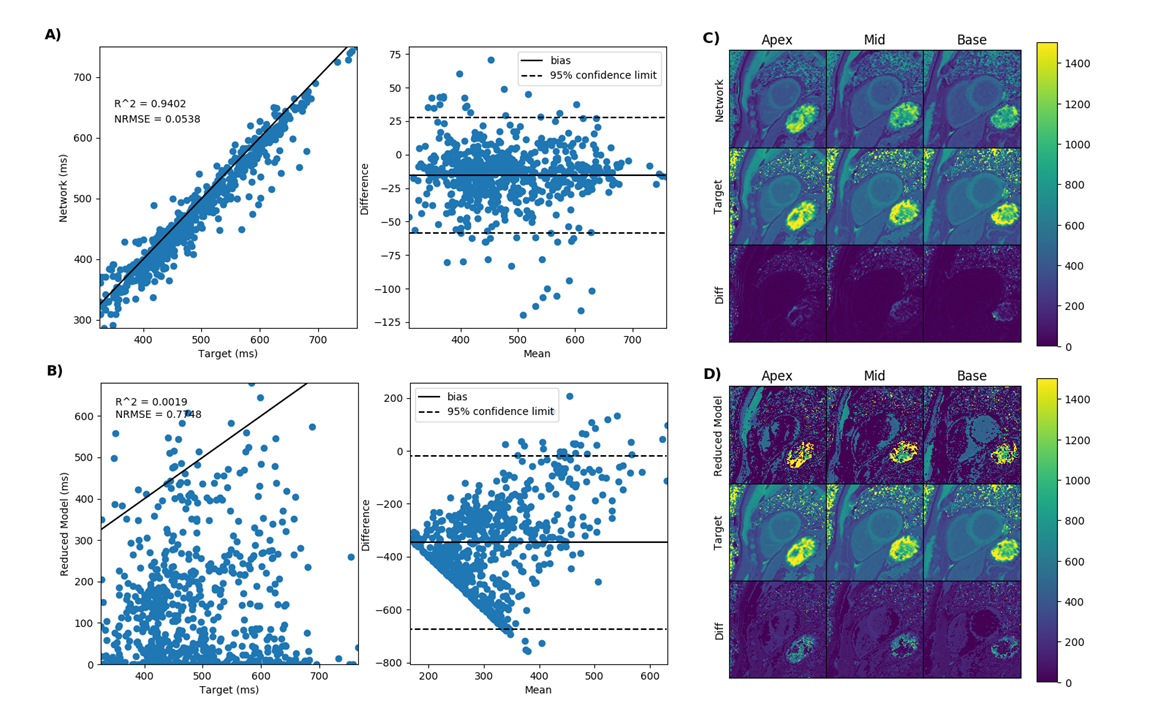
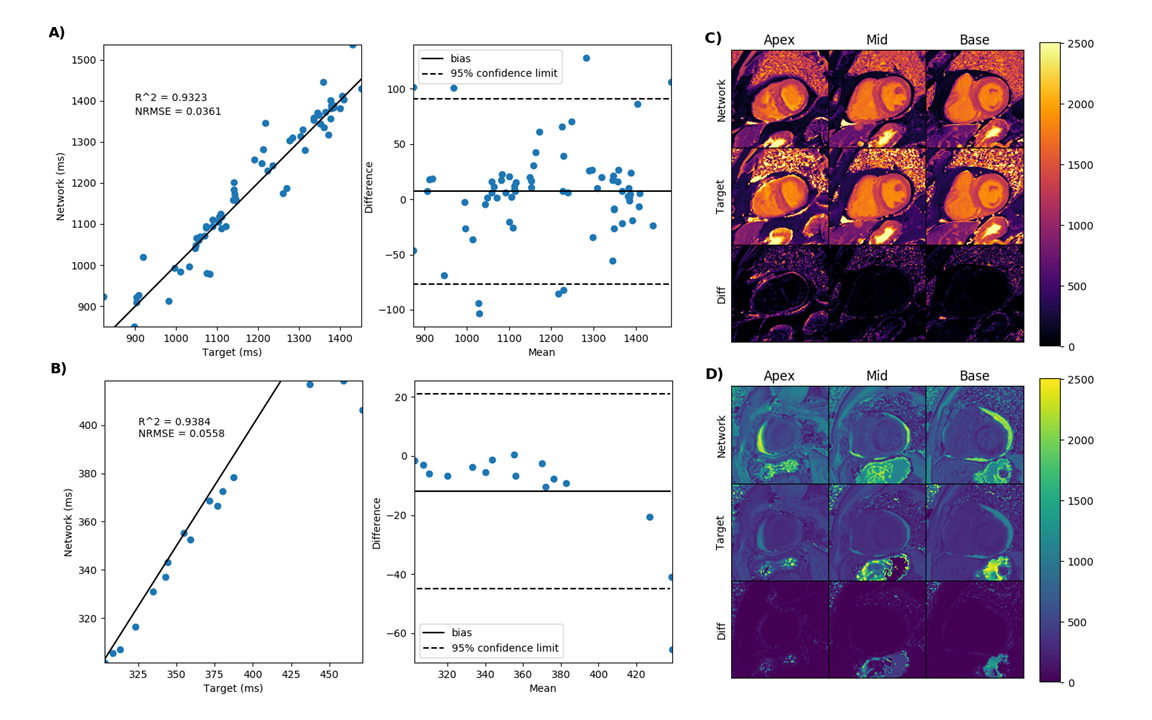
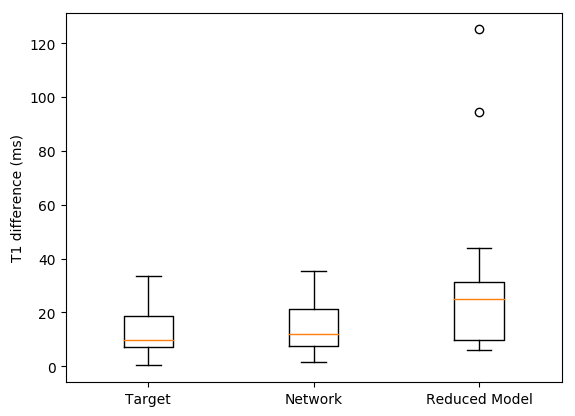
Figure 2 demonstrate the results of the proposed network (A) and the reduced three-parameter model (B) for pre-contrast T1 mapping test sets and (C) and (D) show the corresponding T1 maps respectively. Figure 3 results of the proposed network (A) and the reduced three-parameter model (B) for post-contrast T1 mapping test sets and (C) and (D) show the corresponding T1 maps respectively. Figure 4 demonstrate the results of the proposed network for pre-contrast (A) and post-contrast (B) amyloidosis test sets and (C) and (D) show the corresponding T1 maps. Figure 5 shows precision box plots for network-generated pre-contrast T1 maps and the reduced three-parameter model in comparison to reference T1 maps. Each point represents averaged regions of interest in the myocardium corresponding to the standard American Heart Association (AHA) 16-segment model [14].Discussion and Conclusions
Our results demonstrate promise for the application of deep learning for rapid cardiac T1 mapping. By using a multi-layer bidirectional LSTM and cyclic model-based loss, we have demonstrated that deep learning can be used to accelerate T1 mapping sequences by reducing the number of T1-weighted images required to produce high-quality T1 maps. Deep learning can decrease the MOLLI-5(3)3 sequence to only 3 heart beats and decrease the MOLLI-4(1)3(1)2 sequence to only 2 heart beats without significantly compromising the quality of T1 maps.Acknowledgements
No acknowledgement found.References
[1] Dall'Armellina E, Piechnik SK, Ferreira VM, Si QL, Robson MD, Francis JM, et al. Cardiovascular magnetic resonance by non contrast T1-mapping allows assessment of severity of injury in acute myocardial infarction. J Cardiovasc Magn Reson 2012;14:15.
[2] Karamitsos TD, Piechnik SK, Banypersad SM, Fontana M, Ntusi NB, Ferreira VM, et al. Noncontrast T1 mapping for the diagnosis of cardiac amyloidosis. JACC Cardiovasc Imaging 2013;6(4):488-97.
[3] Sado DM, White SK, Piechnik SK, Banypersad SM, Treibel T, Captur G, et al. Identification and assessment of Anderson-Fabry disease by cardiovascular magnetic resonance noncontrast myocardial T1 mapping. Circ Cardiovasc Imaging 2013;6(3):392-8.
[4] Taylor AJ, Salerno M, Dharmakumar R, Jerosch-Herold M. T1 Mapping: Basic Techniques and Clinical Applications. JACC Cardiovasc Imaging 2016;9(1):67-81.
[5] Schelbert EB, Messroghli DR. State of the Art: Clinical Applications of Cardiac T1 Mapping. Radiology 2016;278(3):658-76.
[6] Kellman P, Wilson JR, Xue H, Ugander M, Arai AE. Extracellular volume fraction mapping in the myocardium, part 1: evaluation of an automated method. J Cardiovasc Magn Reson 2012;14:63.
[7] Liu A, Wijesurendra RS, Francis JM, Robson MD, Neubauer S, Piechnik SK, et al. Adenosine Stress and Rest T1 Mapping Can Differentiate Between Ischemic, Infarcted, Remote, and Normal Myocardium Without the Need for Gadolinium Contrast Agents. JACC Cardiovasc Imaging 2016;9(1):27-36.
[8] Liu D, Borlotti A, Viliani D, Jerosch-Herold M, Alkhalil M, De Maria GL, et al. CMR Native T1 Mapping Allows Differentiation of Reversible Versus Irreversible Myocardial Damage in ST-Segment-Elevation Myocardial Infarction: An OxAMI Study (Oxford Acute Myocardial Infarction). Circ Cardiovasc Imaging 2017;10(8).
[9] Nakamori S, Fahmy A, Jang J, El-Rewaidy H, Neisius U, Berg S, et al. Changes in Myocardial Native T1 and T2 After Exercise Stress: A Noncontrast CMR Pilot Study. JACC Cardiovasc Imaging 2020;13(3):667-80.
[10] Piechnik SK, Ferreira VM, Dall'Armellina E, Cochlin LE, Greiser A, Neubauer S, et al. Shortened Modified Look-Locker Inversion recovery (ShMOLLI) for clinical myocardial T1-mapping at 1.5 and 3 T within a 9 heartbeat breathhold. J Cardiovasc Magn Reson 2010;12:69.
[11] Chow K, Flewitt JA, Green JD, Pagano JJ, Friedrich MG, Thompson RB. Saturation recovery single-shot acquisition (SASHA) for myocardial T(1) mapping. Magn Reson Med 2014;71(6):2082-95.
[12] Roujol S, Weingartner S, Foppa M, Chow K, Kawaji K, Ngo LH, et al. Accuracy, precision, and reproducibility of four T1 mapping sequences: a head-to-head comparison of MOLLI, ShMOLLI, SASHA, and SAPPHIRE. Radiology 2014;272(3):683-9.
[13] Messroghli DR, Radjenovic A, Kozerke S, Higgins DM, Sivananthan MU, Ridgway JP. Modified Look-Locker inversion recovery (MOLLI) for high-resolution T1 mapping of the heart. Magn Reson Med 2004;52(1):141-6.
[14] Cerqueira MD, Weissman NJ, Dilsizian V, Jacobs AK, Kaul S, Laskey WK, et al. Standardized myocardial segmentation and nomenclature for tomographic imaging of the heart. A statement for healthcare professionals from the Cardiac Imaging Committee of the Council on Clinical Cardiology of the American Heart Association. Int J Cardiovasc Imaging 2002;18(1):539-42.
Figures