4436
Stochastic Fibrosis Signatures from 3D LGE: Novel Threshold-Free Quantification of Left Atrial Fibrosis1Radiology, Northwestern University, Chicago, IL, United States, 2Biomedical Engineering, Northwestern University, Chicago, IL, United States, 3Johns Hopkins University, Baltimore, MD, United States, 4Cardiology, Northwestern University, Chicago, IL, United States, 5Electrical and Computer Engineering, Northwestern University, Chicago, IL, United States, 6Computer Science, Northwestern Universiy, Chicago, IL, United States, 7Division of Cardiovascular Medicine, Perelman School of Medicine, University of Pennsylvania, Philadelphia, PA, United States
Synopsis
Assessment of left atrial (LA) fibrosis in atrial fibrillation (AF) patients from 3D LGE MRI have shown promise in evaluating atrial myopathy for selecting patients for catheter ablation and to predict AF recurrence post intervention. Nevertheless, current methods for fibrosis quantification suffer from lack of standardization and reproducibility as they rely on different thresholds for defining fibrosis. Hence, limiting the clinical translation of 3D LA LGE MRI. Here, we propose the first threshold-free technique to quantify LA fibrosis burden using novel stochastic fibrosis signature technique. We demonstrated feasibility and correlations to four of the previously published methods for fibrosis quantification.
Introduction
Left atrial (LA) fibrosis assessment in atrial fibrillation (AF) from 3D LGE MRI has shown promise in evaluating atrial myopathy, and predicting AF recurrence [1, 2]. Nevertheless, current methods for fibrosis quantification suffer from a lack of standardization and reproducibility as they rely on different thresholds for defining fibrosis. Hence, hindering effective clinical translation. To address these limitations, here we introduce the first threshold-free technique for objectively quantifying fibrosis burden from 3D LGE: stochastic fibrosis signatures. The rationale behind the proposed signature technique is to utilize the entire rich 3D LGE data dimensionality (i.e. all voxels within the LA volume) to identify unique reliable standardized fibrosis profiles (signatures). This is achieved by stochastically encoding multi-million voxel intensity co-disparities, throughout the LA volume (not LA wall only). This study aimed at evaluating the feasibility of the proposed technique in assessing fibrosis burden in AF patients and comparing it to four previously published methods.Methods
We analyzed 3D LA LGE of 52 pre-ablation patients (age=67±10yrs, 24 Female) from publicly available database of Utah CARMA LGE MRI that were indicated to have at least ‘good’ quality score by the publishers [3]. The data also included 3D LA wall and LA pool segmentations excluding the pulmonary veins and the mitral valve. In brief, acquisition parameters were: reconstructed voxel size= 0.625 × 0.625 × 1.25 mm, TR/TE= 5.4/2.3 ms, FA=20o, TI = 270-310 ms [3].Stochastic Fibrosis Signature from 3D LA LGE: Our proposed three-stage technique is summarized in Figures 1, 2, and 3.
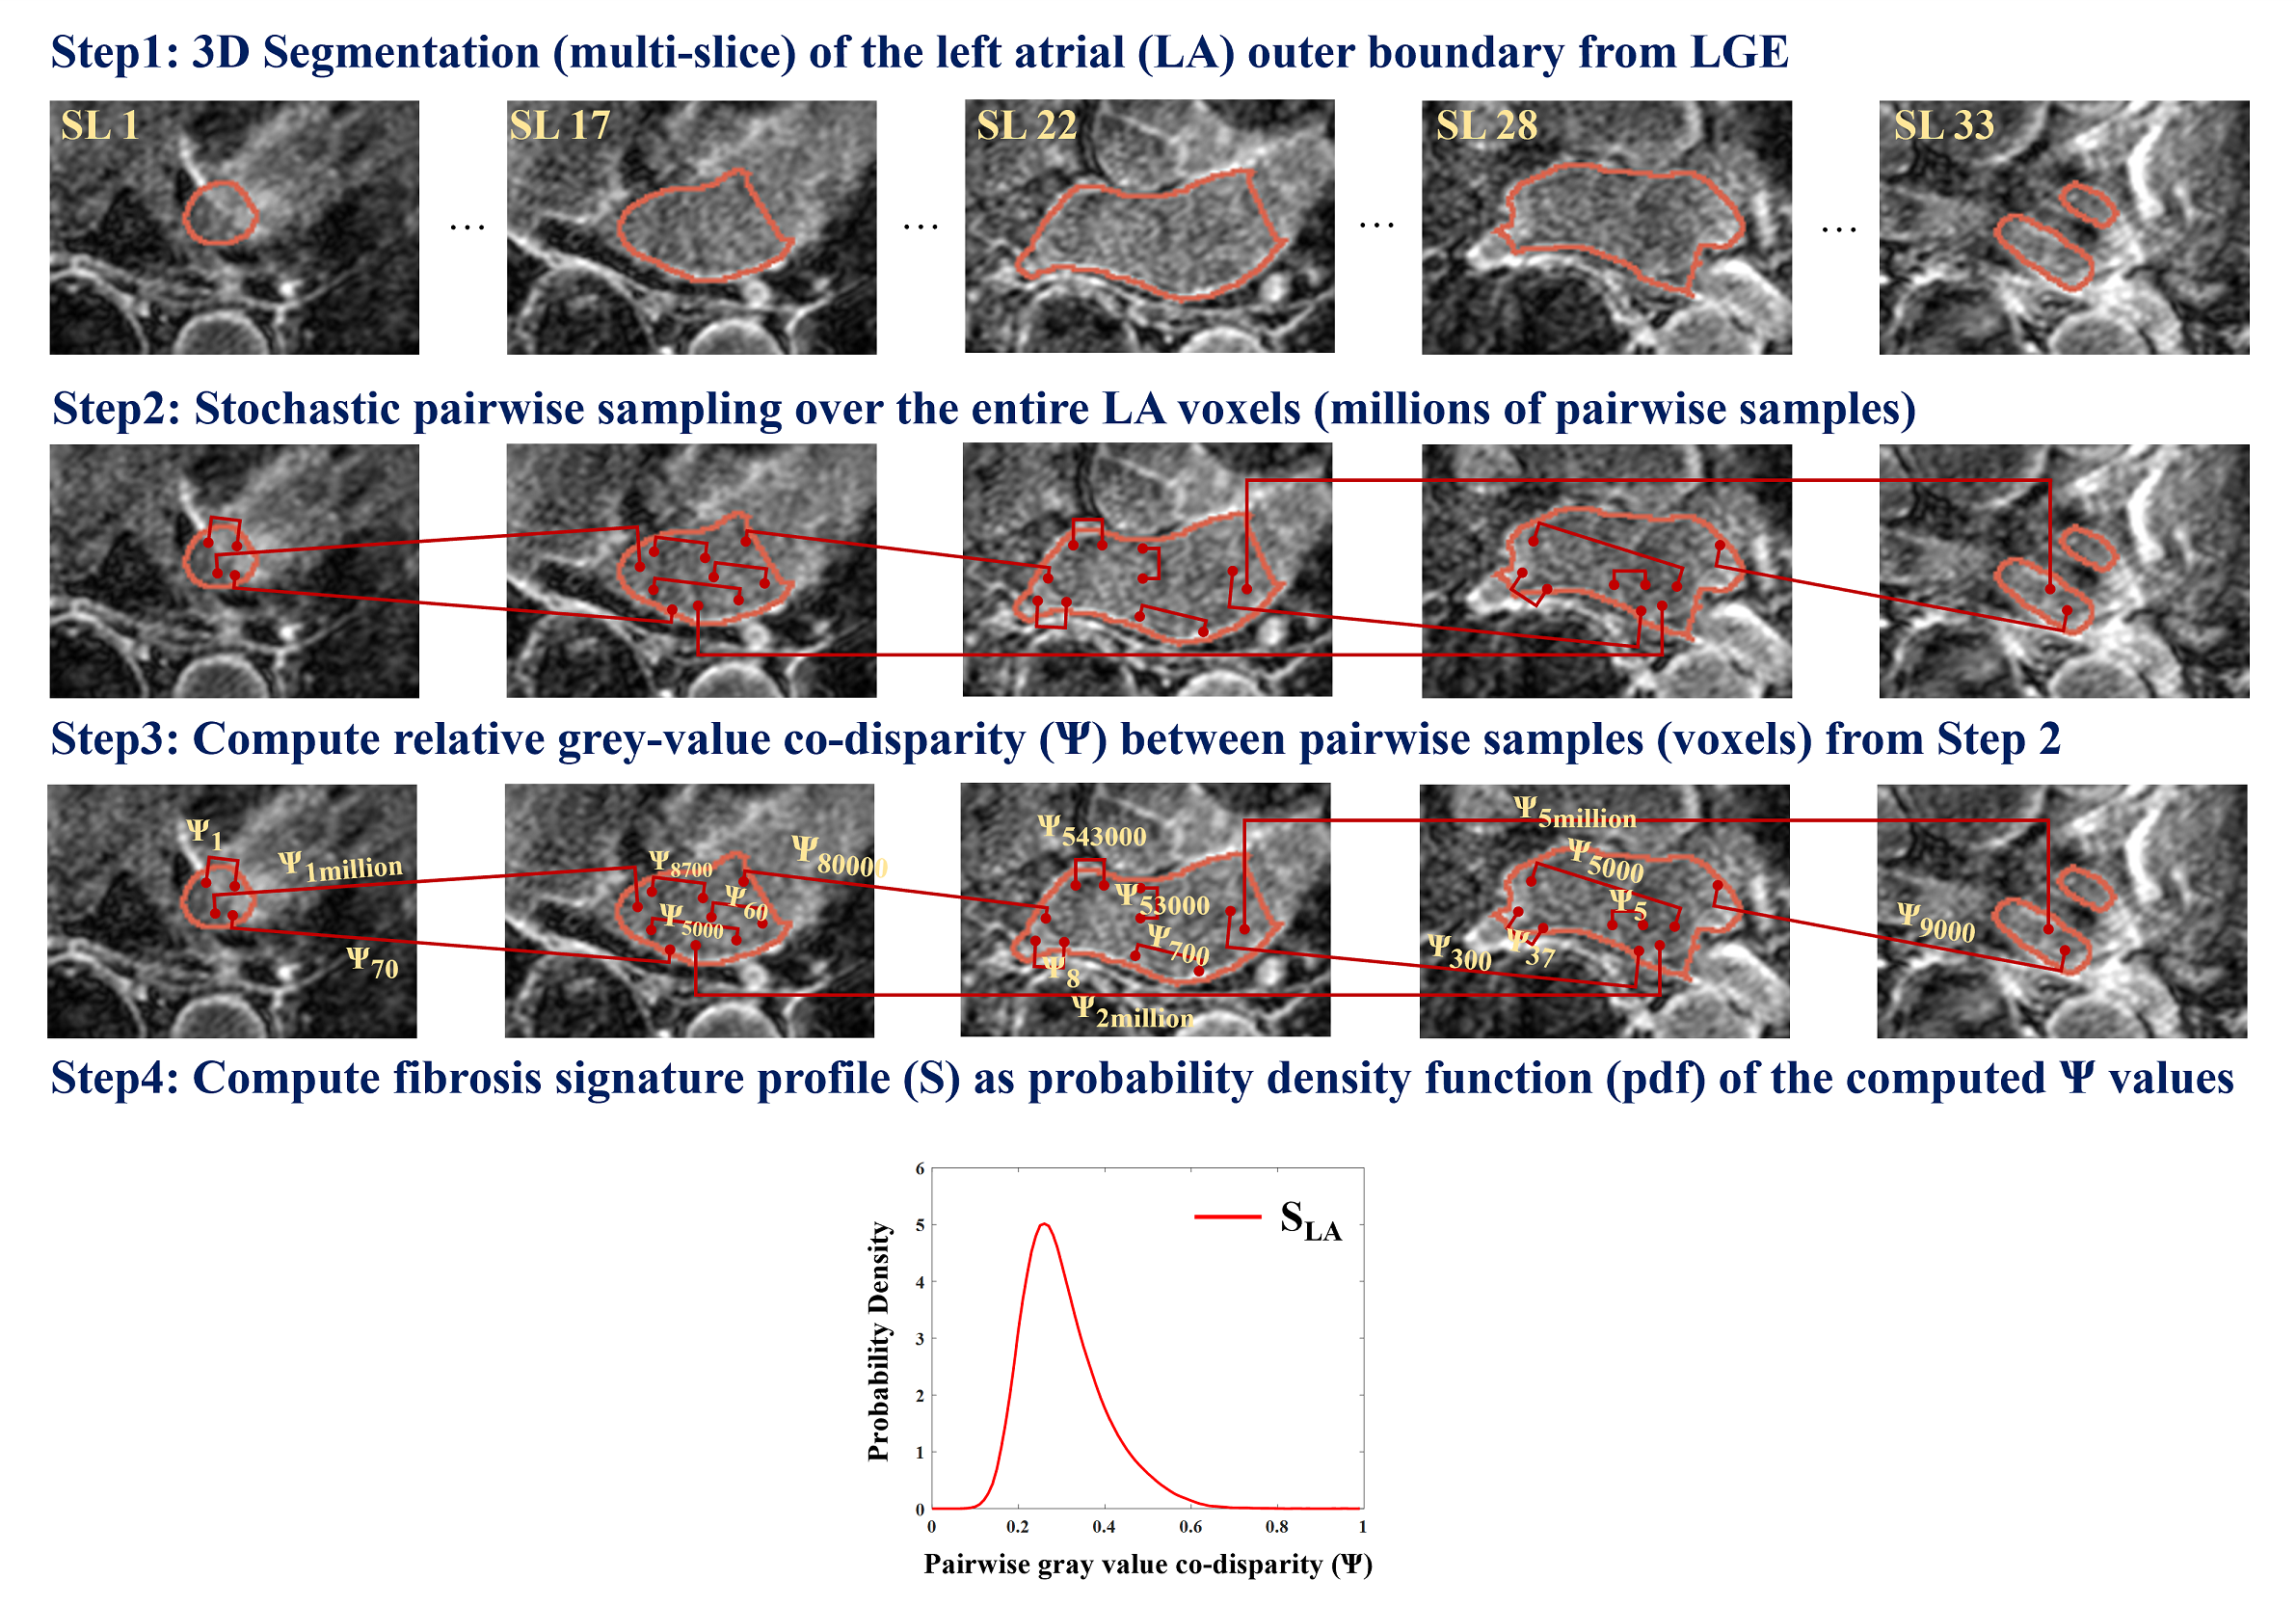
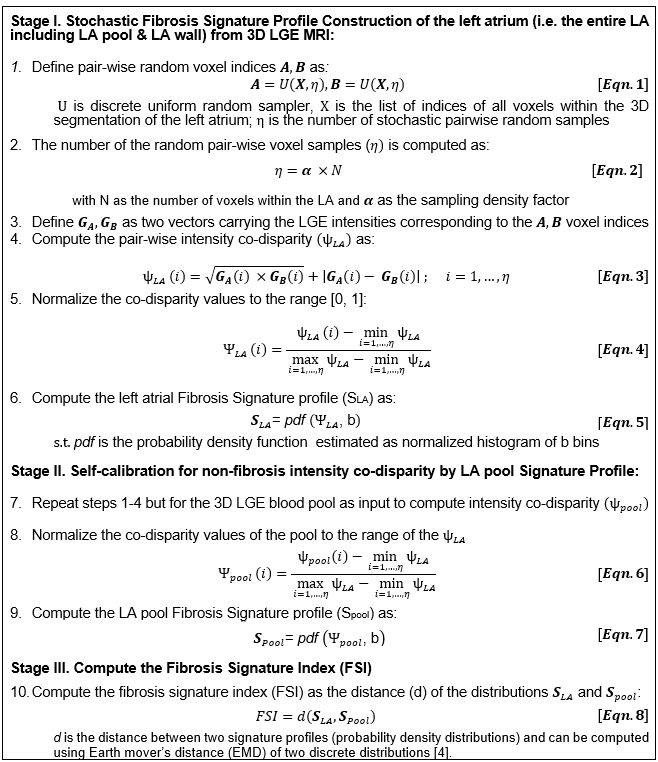
Stage (I), signature profile construction of the LA volume (SLA): Steps are illustrated in Fig 1 and equations provided in Fig 3: (1) Localize the 3D outer LA boundary from 3D LGE MRI. This does not require exact LA wall segmentation, but a rough boundary localization enclosing the LA fibrosis. (2) Perform stochastic uniform random sampling of η voxel pairs over the entire localized 3D LA volume – (Eqn.1; Fig. 3). η = ~30 million pair-wise samples/voxels was used (Eqn.2). (3) Per voxel-pair, compare the disparity between their LGE intensities using the co-disparity function Ψ (Eqn.3, Eqn.4). (4) Compute the standardized fibrosis signature profile (SLA) as the probability density function of Ψ as estimated by a frequency-normalized histogram with b bins: b=100 used here (Eqn5). Note that the signature profile is standardized: x-axis normalized between [0, 1], area under the curve =1.
Stage II. LA Pool Signature Profile (Spool) for self-calibration to non-fibrosis intensity co-disparity: To derive and calibrate for the degree of disparity in “normal” non-fibrotic LGE intensities, we compute the LA blood pool signature (Spool). The same steps in Stage I are repeated except for the input being rough 3D LA blood pool ROI. (Eqn.6, Eqn.7, Fig. 3). Spool helps account for uncertainties in the data by encoding both local and global relative co-disparities throughout the 3D pool intensities.
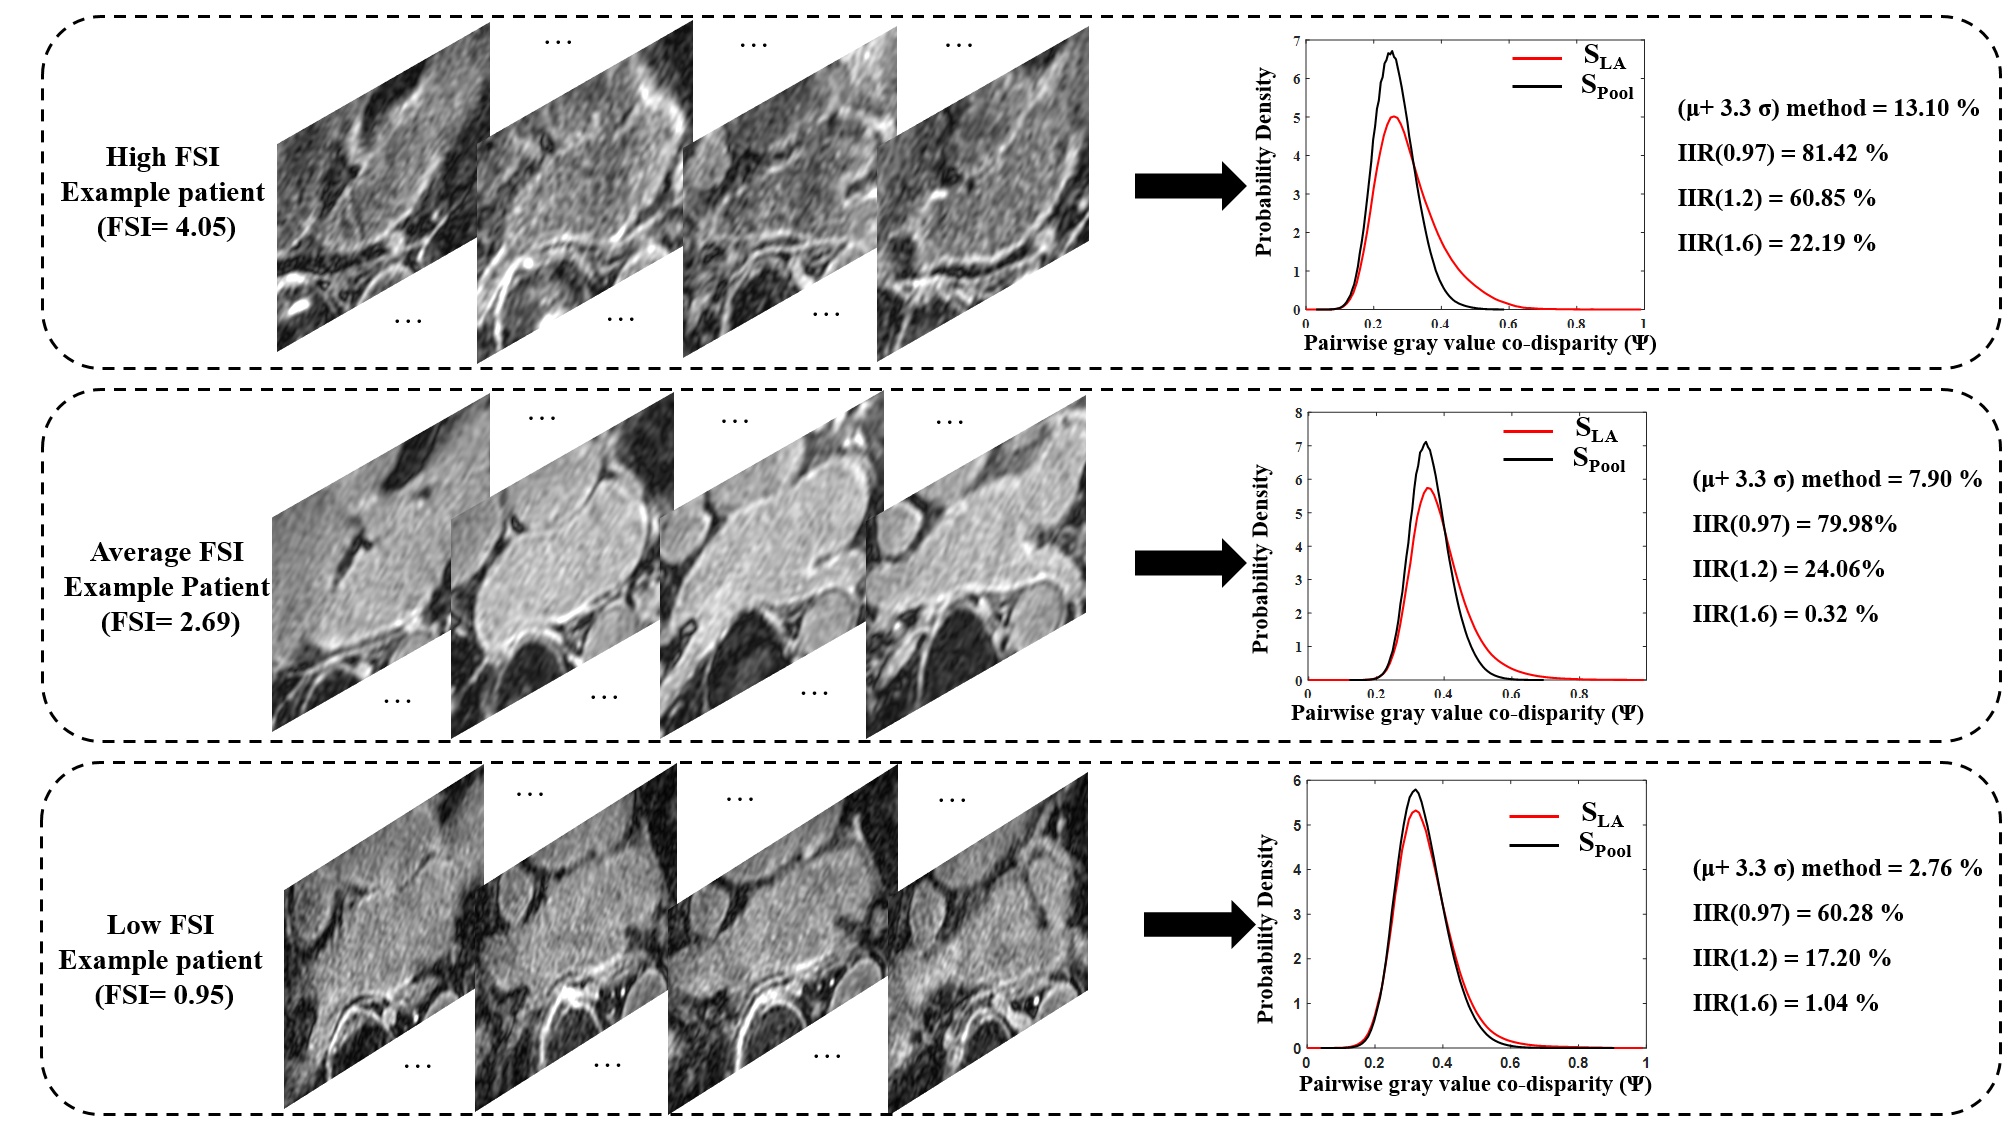
Stage III. Compute the Fibrosis Signature Index (FSI): To enable standardized threshold-free fibrosis quantification, we introduce this index to quantify fibrosis burden. FSI is computed, threshold-free, as the distribution distance (d) between the SLA and Spool using a probability distribution distance metric. Here, we used the earth mover’s distance (EMD) [4]. Higher FSI values indicate a higher fibrosis burden.
Comparison against available methods: We compared the proposed FSI to four previously published methods to define fibrosis: 1) Histology-derived threshold of >μ+3.3σ with μ and σ as the mean and standard deviation of the LA pool [5]; 2) EAM-derived threshold of Image Intensity Ratio (IIR) >0.97 [6]; 3) IIR>1.2 [7]; 4) IIR>1.6 [6]. Spearman Correlation was tested between the FSI and the fibrosis percentage from each of the four methods. Note that FSI is an index of fibrosis burden and not percentage per se, hence direct comparison e.g. using Bland-Altman plots is unsuitable.
Results
Signature construction was successful in all patients. Example fibrosis signature profiles and corresponding FSI are provided in Fig. 4. The threshold-free FSI results showed significant correlations to fibrosis percentages from all the four tested methods (Fig. 5). Highest FSI correlation was found with the μ+3.3σ method (ρ=0.88, p<0.001), then IIR>0.97 method (ρ=0.80, p<0.001), IIR>1.2 method (ρ=0.73, p<0.001), and IIR>1.61 (0.6, p<0.001).Discussion and conclusion
This study demonstrated the feasibility of a novel stochastic fibrosis signature technique for standardized LA fibrosis quantification from 3D LGE. To our knowledge, this is the first threshold-free method for quantifying fibrosis from LGE. FSI is a continuous index that quantifies fibrosis burden. FSI computation is based on stochastically encoding intensity co-disparity throughout the entire LA volume, i.e. not only within the LA wall, hence does not require exact segmentation of the thin wall. The signature definition as a probability density function makes it intrinsically standardized and inherently normalized to the enclosed LA volume, allowing for standardized FSI comparison between patients. The proposed FSI showed significant correlations with fibrosis percentage from four previously published methods emphasizing the FSI ability in quantifying fibrosis burden. As a standardized, threshold-free index, FSI has the potential to facilitate reproducible 3D LA LGE translation. In future, we will assess the FSI ability as a continuous index to differentiate varying types of fibrosis, and to predict AF recurrence post ablation.Acknowledgements
Grant. 2 R01 HL116895-06, R21 HL150498-01, AHA 20TPA35490311References
[1] Dzeshka MS, Lip GY, Snezhitskiy V and Shantsila E. Cardiac Fibrosis in Patients With Atrial Fibrillation: Mechanisms and Clinical Implications. J Am Coll Cardiol. 2015;66:943-59.
[2] Marrouche NF, Wilber D, Hindricks G, Jais P, Akoum N, Marchlinski F, Kholmovski E, Burgon N, Hu N, Mont L, Deneke T, Duytschaever M, Neumann T, Mansour M, Mahnkopf C, Herweg B, Daoud E, Wissner E, Bansmann P and Brachmann J. Association of atrial tissue fibrosis identified by delayed enhancement MRI and atrial fibrillation catheter ablation: the DECAAF study. JAMA. 2014;311:498-506.
[3] http://insight-journal.org/midas/collection/view/190
[4] Rubner Y, Tomasi C, and Guibas LJ. The earth mover's distance as a metric for image retrieval.
International journal of computer vision. 2000;40:99-121.
[5] Harrison JL, Jensen HK, Peel SA, et al. Cardiac magnetic resonance and electroanatomical mapping of acute and chronic atrial ablation injury: a histological validation study. Eur Heart J. 2014;35:1486‐1495.
[6] Khurram, Irfan M., et al. "Magnetic resonance image intensity ratio, a normalized measure to enable interpatient comparability of left atrial fibrosis." Heart rhythm 11.1 (2014): 85-92.
[7] Benito, Eva M., et al. "Left atrial fibrosis quantification by late gadolinium-enhanced magnetic resonance: a new method to standardize the thresholds for reproducibility." Ep Europace 19.8 (2017): 1272-1279.
Figures