4435
Quantitative evaluation of tendon enthesis using ultrashort echo time magnetic resonance imaging (UTE-MRI) techniques1Department of Radiology, University of California, San Diego, San Diego, CA, United States, 2Radiology Service, VA San Diego Healthcare System, San Diego, CA, United States
Synopsis
Entheses are transition zones connecting flexible tissues such as tendons and ligaments to bone. Conventional MRI sequences detect little or no signal from entheses as a result of their short T2* values. Alternatively, ultrashort echo time MRI (UTE-MRI) with TE<50 μs can be used to image tissues with short T2 and T2* for quantitative assessment. The feasibility of using quantitative UTE-MRI techniques for the evaluation of entheses regions of Achilles tendons in cadaveric ankle specimens was investigated. Using 20 cadaveric ankle specimens, high quality images were obtained with significant entheses signal which enabled excellent UTE-T1, UTE-Adiab-T1r, and UTE-MT model fittings.
INTRODUCTION
Entheses are transition zones connecting flexible tissues such as tendons and ligaments to bone, with potential mechanical stress concentration as a result of the tissues’ widely different mechanical properties. Entheses may be involved in many diseases including the overuse syndromes and the early stages of osteoarthritis. Conventional MRI sequences detect little or no signal from entheses as a result of their short T2* values. Particularly, normal entheses have not been identifiable with clinical MR imaging.Fortunately, ultrashort echo time MRI (UTE-MRI) with TE<50 μs can be used to image tissues with short T2 for quantitative assessment (1). UTE-MRI combined with magnetization transfer (MT) modeling (UTE-MT) and adiabatic spin-locking T1r (UTE-Adib-T1r) have recently been introduced as orientation insensitive techniques for compositional evaluation of different musculoskeletal tissues(2,3). Both UTE-Adiab-T1ρ and UTE-MT require T1 compensation which can be performed more accurately using actual variable flip angle (AFI-VFA) techniques of short T2 tissues (4).
This study was aimed to investigate the feasibility of using UTE-T1, UTE-Adiab-T1ρ, magnetization transfer ratio (MTR) imaging, and UTE-MT modeling for quantitative evaluation of enthesis region of Achilles tendon in cadaveric ankle specimens.
METHODS
Twenty human cadaveric ankle specimens (65±17 years old) without any known musculoskeletal diseases were imaged with UTE-MRI sequences on a 3T clinical scanner (MR750, GE). Imaging was performed in the sagittal plane centered at the enthesis region connecting the Achilles tendon to the calcaneus bone. To measure T1 as a prerequisite for the two-pool UTE-MT modeling and UTE-Adiab-T1ρ fitting, AFI-VFA sequence (AFI: TE=0.032ms, TRs=20,100ms, FA=45˚; VFA: TE=0.032ms, TR=20ms, FAs=5, 12, 24˚) was performed (5). A 3D-UTE-Cones-MT sequence (pulse power=400° and 800°; frequency offset=2, 5, 10, 20, and 50kHz; FA=7˚; 11 spokes per MT preparation) was performed for the two-pool MT modeling (3,6). Additionally, a set of 3D UTE-Adiab-T1r sequences with five different spin-locking times (TSLs) (TR=500ms, TSL= 0, 12, 24, 36, and 48 ms) were performed (2). Field of view, matrix dimension, pixel size, slice thickness, and total scan time were 11cm, 256×256, 2mm, and 60 mins, respectively.UTE-MRI analyses were performed within a region of interest (ROI) covering the entheses. ROI selection was performed by an experienced image analyst and confirmed by a musculoskeletal radiologist. For each specimen, average macromolecular proton fraction (MMF) and T2 of the macromolecules (T2mm) were estimated using UTE-MRI-MT modeling performed on two sagittal slices 4 mm apart. UTE-T1 and UTE-Adiab-T1ρ values were calculated for each specimen using a single exponential fitting model.
Results
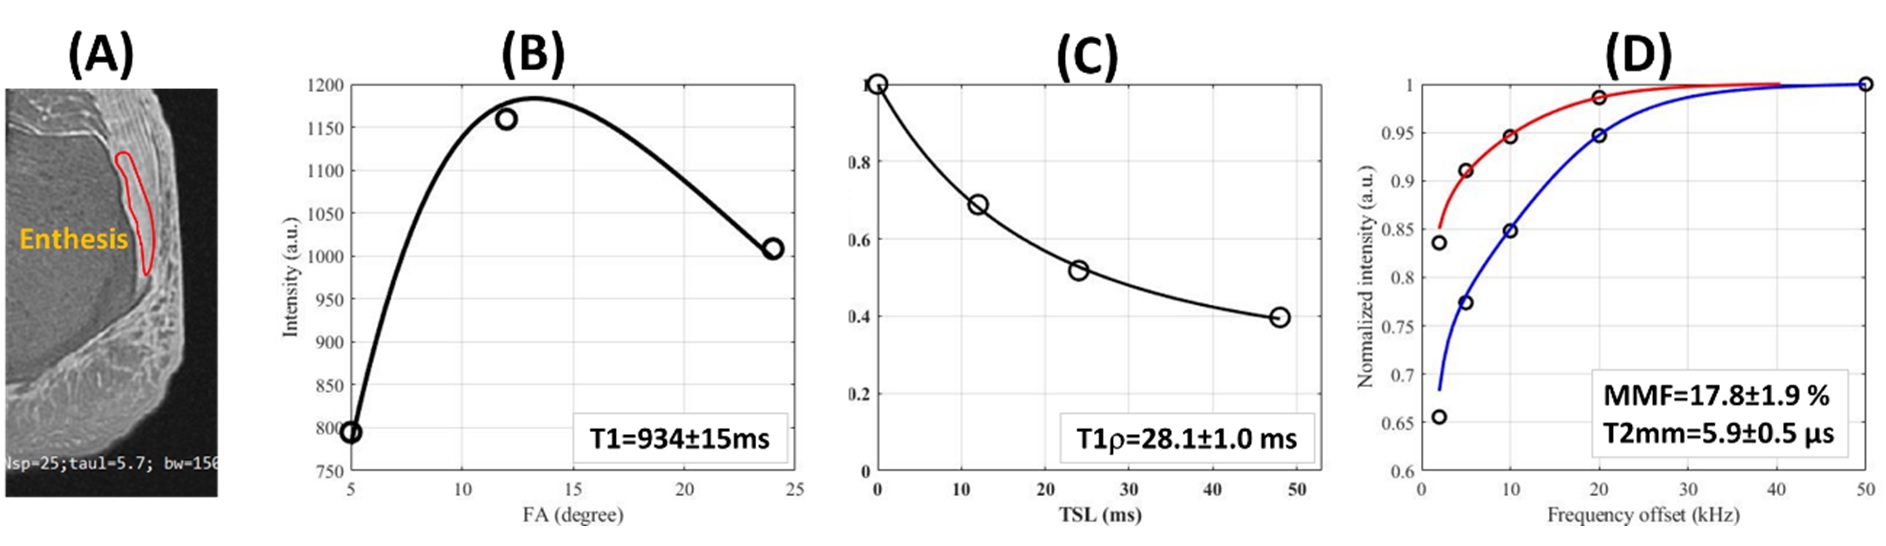
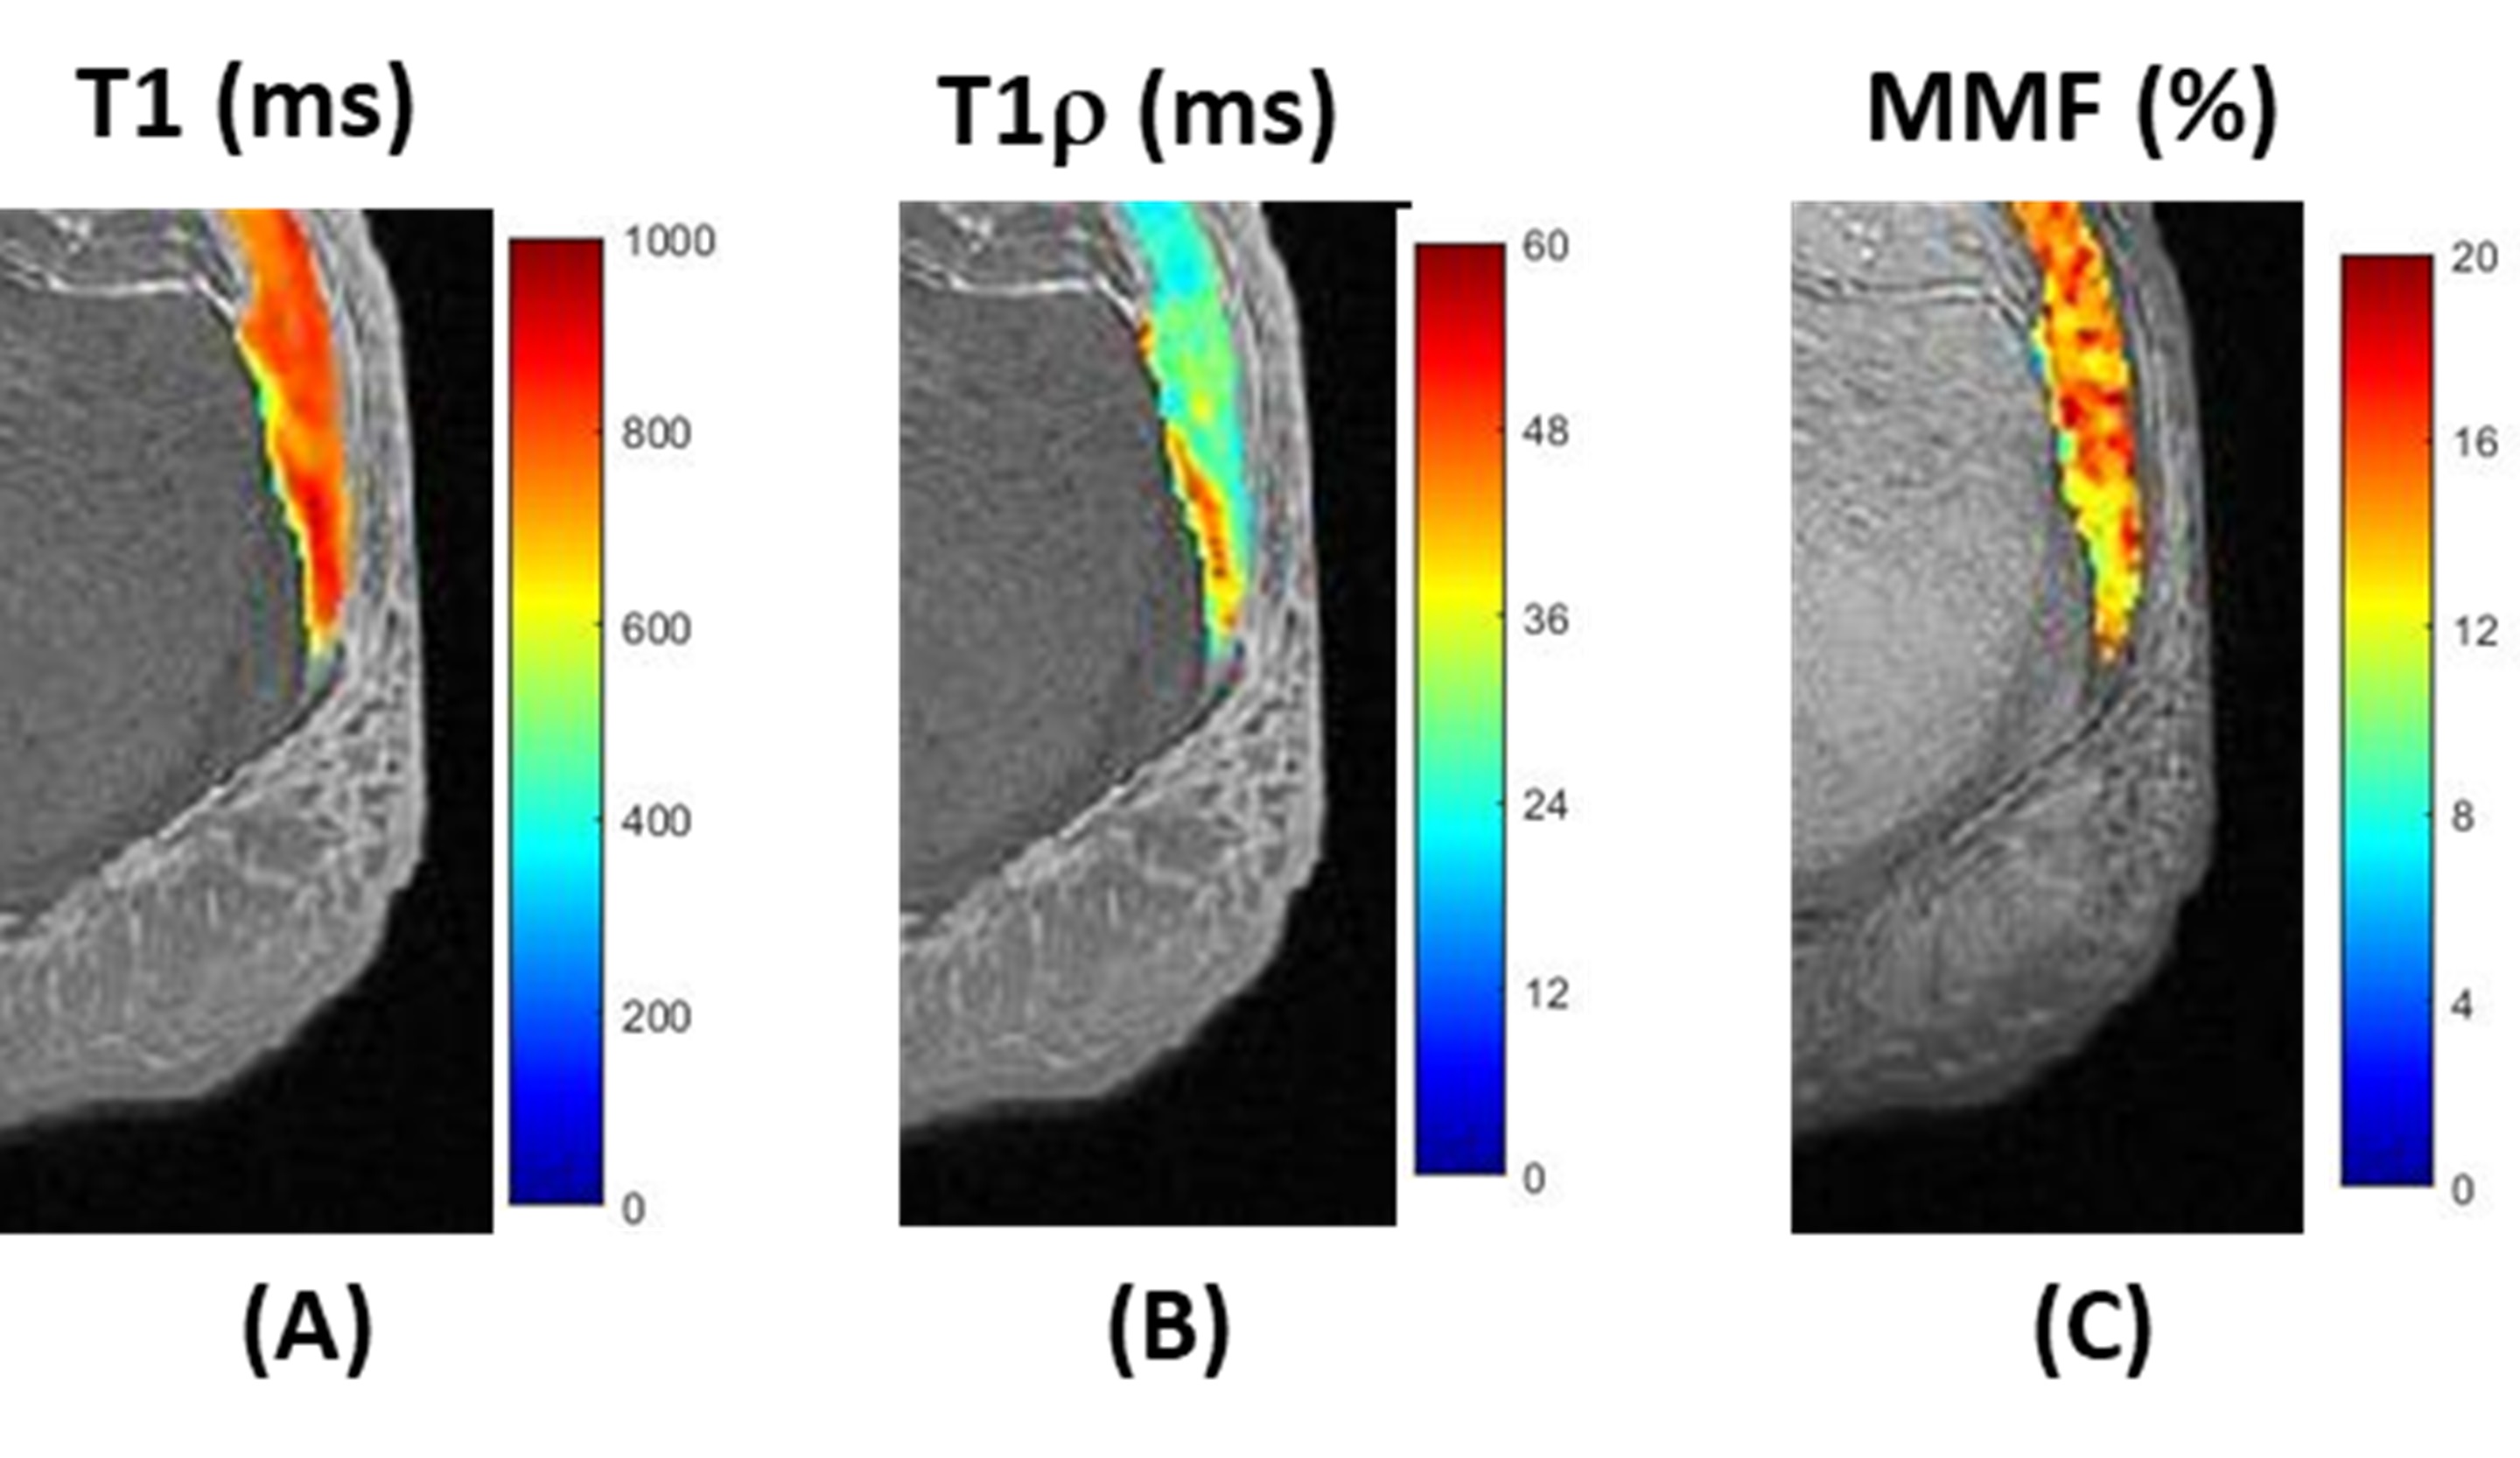
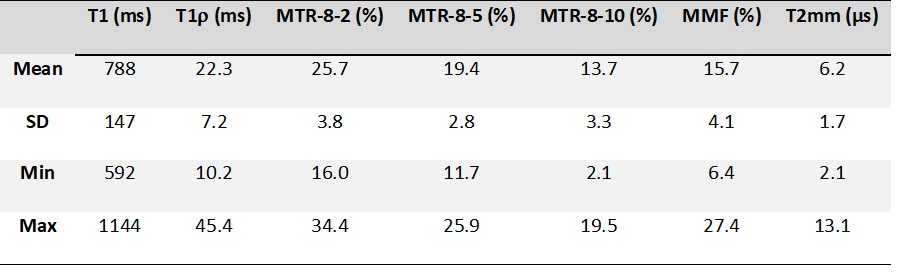
The UTE-MRI sequence acquired high signal from the entheses of all scanned specimens. Figure 1A shows schematically a representative ROI selected on a UTE-Adiab-T1ρ image performed on the sagittal plane of an ankle specimen from a 62-year-old female donor. Representative UTE-T1, UTE-Adiab-T1ρ, and two-pool MT model fittings are demonstrated in Figure 1B-C, respectively for the selected ROI. Figure 2 illustrates the representative T1, T1ρ, and MMF pixel maps generated over Achilles tendon including the enthesis area. Average, standard deviation (SD), maximum and minimum values for all the investigated UTE-MRI parameters are presented in Figure.3 (Table 1).DISCUSSION
The feasibility of using UTE-T1, UTE-Adiab-T1ρ, magnetization transfer ratio (MTR) imaging, and UTE-MT modeling for the evaluation of enthesis region of Achilles tendon in cadaveric ankle specimens were investigated. Acquired high quality images with significant signal in enthesis enabled excellent UTE-T1, UTE-Adiab-T1ρ, and UTE-MT model fittings. The range of the calculated MMF, UTE-T1, UTE-Adiab-T1ρ values in enthesis were roughly close to the reported values for cadaveric articular cartilage and tendons in the literature. Future investigations are required to understand the potential correlations between UTE-MRI parameters of enthesis and its disease stage, mechanical properties, histological characteristics.CONCLUSION
This study highlighted the UTE-MRI techniques as useful quantitative methods to assess enthesis regions of tendons and ligaments which possess short T2* values and are not identifiable using conventional MRI techniques.Acknowledgements
The authors acknowledge grant support from the NIH (R01AR068987, R01AR075825, R01AR062581), Veterans Affairs (I01RX002604 and I01CX001388), and GE Healthcare.References
1. Chang EY, Du J, Chung CB. UTE imaging in the musculoskeletal system. J. Magn. Reson. Imaging 2015;41:870–883 doi: 10.1002/jmri.24713.
2. Ma Y, Carl M, Searleman A, Lu X, Chang EY, Du J. 3D adiabatic T1ρprepared ultrashort echo time cones sequence for whole knee imaging. Magn. Reson. Med. 2018;80:1429–1439 doi: 10.1002/mrm.27131.
3. Ma Y, Chang EY, Carl M, Du J. Quantitative magnetization transfer ultrashort echo time imaging using a time-efficient 3D multispoke Cones sequence. Magn. Reson. Med. 2017;79:692–700 doi: 10.1002/mrm.26716.
4. Ma Y, Lu X, Carl M, et al. Accurate T 1 mapping of short T 2 tissues using a three-dimensional ultrashort echo time cones actual flip angle imaging-variable repetition time (3D UTE-Cones AFI-VTR) method. Magn. Reson. Med. 2018;80:598–608 doi: 10.1002/mrm.27066.
5. Ma YJ, Zhao W, Wan L, et al. Whole knee joint T1 values measured in vivo at 3T by combined 3D ultrashort echo time cones actual flip angle and variable flip angle methods. Magn. Reson. Med. 2019;81:1634–1644 doi: 10.1002/mrm.27510.
6. Ma Y, Tadros A, Du J, Chang EY. Quantitative two-dimensional ultrashort echo time magnetization transfer (2D UTE-MT) imaging of cortical bone. Magn. Reson. Med. 2018;79:1941–1949 doi: 10.1002/mrm.26846.
Figures