4432
Statistical Shape Models of Bone and Cartilage for Predicting Demographics: Data from the Osteoarthritis Initiative1Radiology, Stanford University, Stanford, CA, United States, 2Computer Science, Stanford University, Stanford, CA, United States, 3Bioengineering, Stanford University, Stanford, CA, United States
Synopsis
Three-dimensional statistical shape models built from MRI data can predict future disease and distinguish between groups. However, these models do not leverage the major advantage of MRI – the ability to visualize and quantify soft tissues such as cartilage. This study built three MRI-based statistical shape models, 1) bone shape, 2) cartilage thickness, 3) both bone shape and cartilage thickness. We showed that bone shape and bone shape + cartilage thickness models predicted sex with an R2 of ~0.9, significantly outperforming cartilage thickness alone (0.8). However, cartilage thickness alone was significantly better at predicting radiographic knee osteoarthritis.
INTRODUCTION
Three-dimensional bone shape is a commonly used tool to understand and diagnose knee osteoarthritis that improves upon conventional 2D x-rays. Automated tissue segmentation methods from MR images has enabled quantification of 3D bone shape using statistical shape models. Statistical shape models use dimensionality reduction algorithms to learn shape variations from training data. MRI-based statistical shape models of bone can predict knee osteoarthritis progression1, identify morphological differences between athlete groups2, and distinguish between anterior cruciate ligament injury cases and controls3. However, these models solely incorporate bone shape and do not leverage the major advantage of MRI - the ability to visualize, segment, and geometrically represent soft tissues such as cartilage. To address these challenges, the purpose of this study was to build MRI-based statistical shape models of the femur that includes bone and cartilage and to test them by comparing their abilities to predict participant demographics.METHODS
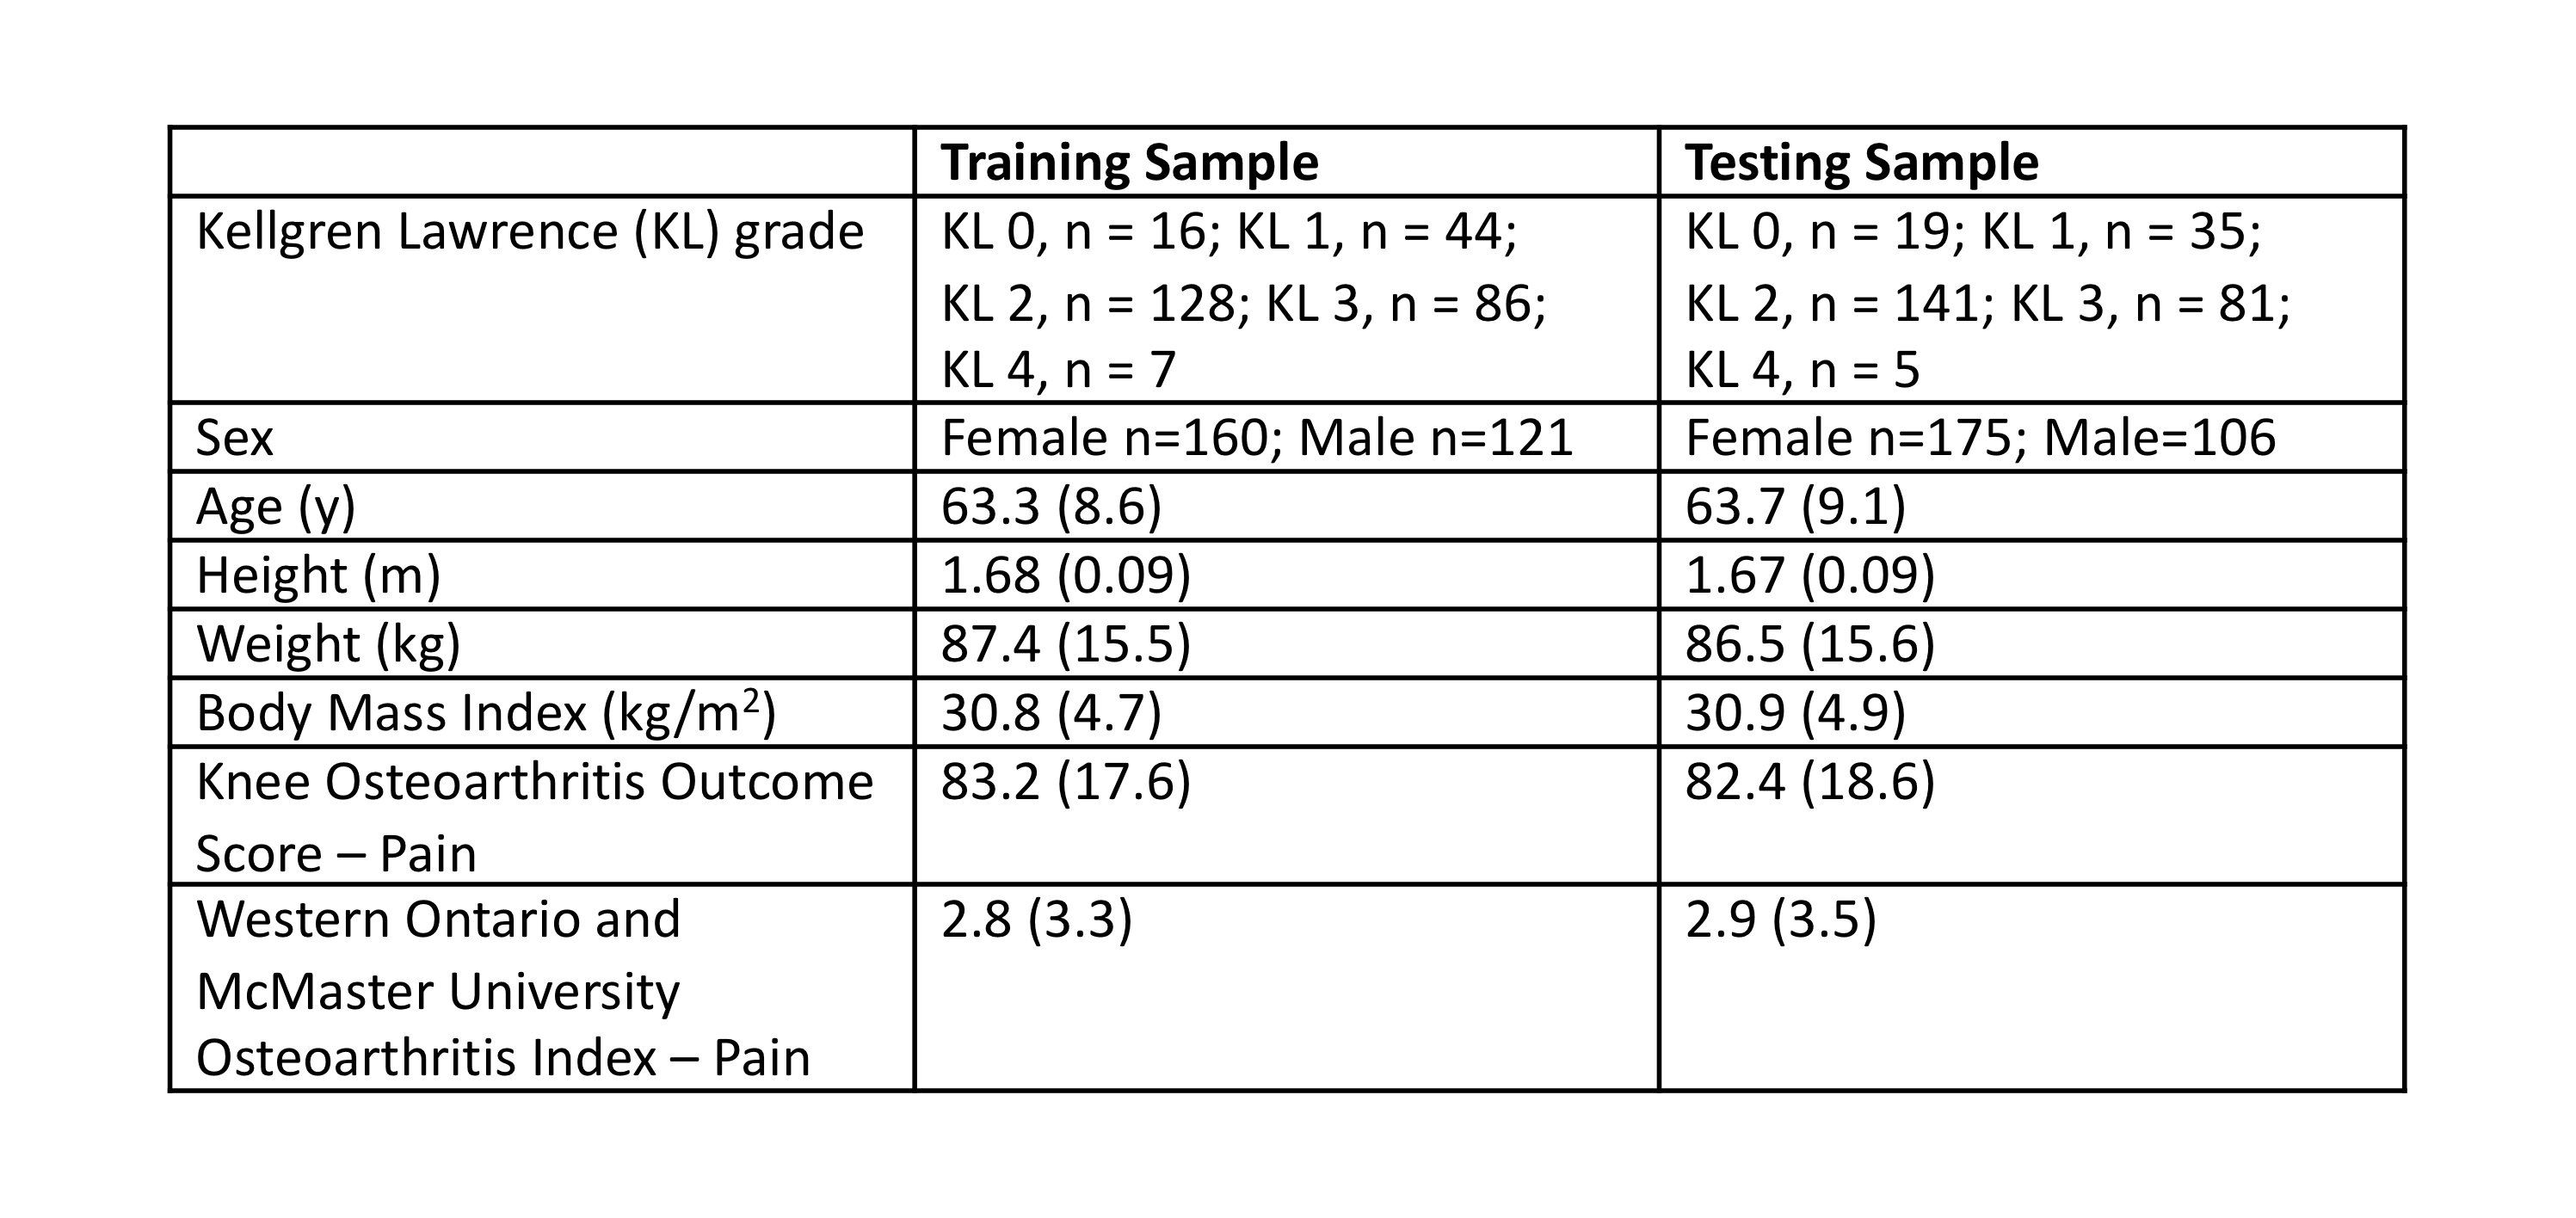
Data from the 24-month visit of the right knee of 562 participants enrolled in the Osteoarthritis Initiative were included4. These participants were randomly split (50/50) into training (n=281) and testing (n=281) datasets; participant demographics are included in Table 1. Sagittal Dual Echo in the Steady State MRIs (TE/TR= 5/16ms, flip angle=25o, field-of-view=140×140mm2, in-plane resolution=0.36×0.36mm2, slice thickness=0.7mm) of the right knee of each participant were segmented using a previously validated convolutional neural network5.Surface meshes were created by applying a Gaussian filter to the binary mask from each tissue (bone 𝛔2 = 0.5 mm, cartilage 𝛔2 = 0.1 mm) followed by surface extraction using marching cubes6,7. Bone surfaces were resampled to include 20,000 vertices using Voronoi clustering8,9. Cartilage thickness was calculated for each bone vertex by projecting vectors normal to the surface and calculating the 3D Euclidean distance from bone to articular surface.
To build the shape models, first point correspondences were determined between all training bones using the Feature Oriented Correspondence using Spectral Regularization algorithm3,10. Using the corresponding points, three statistical shape models were built using singular value decomposition for: 1) bone shape, 2) cartilage thickness, and 3) both bone shape and cartilage thickness. To remove the effects of overall bone size, registration was performed before finding point correspondences.
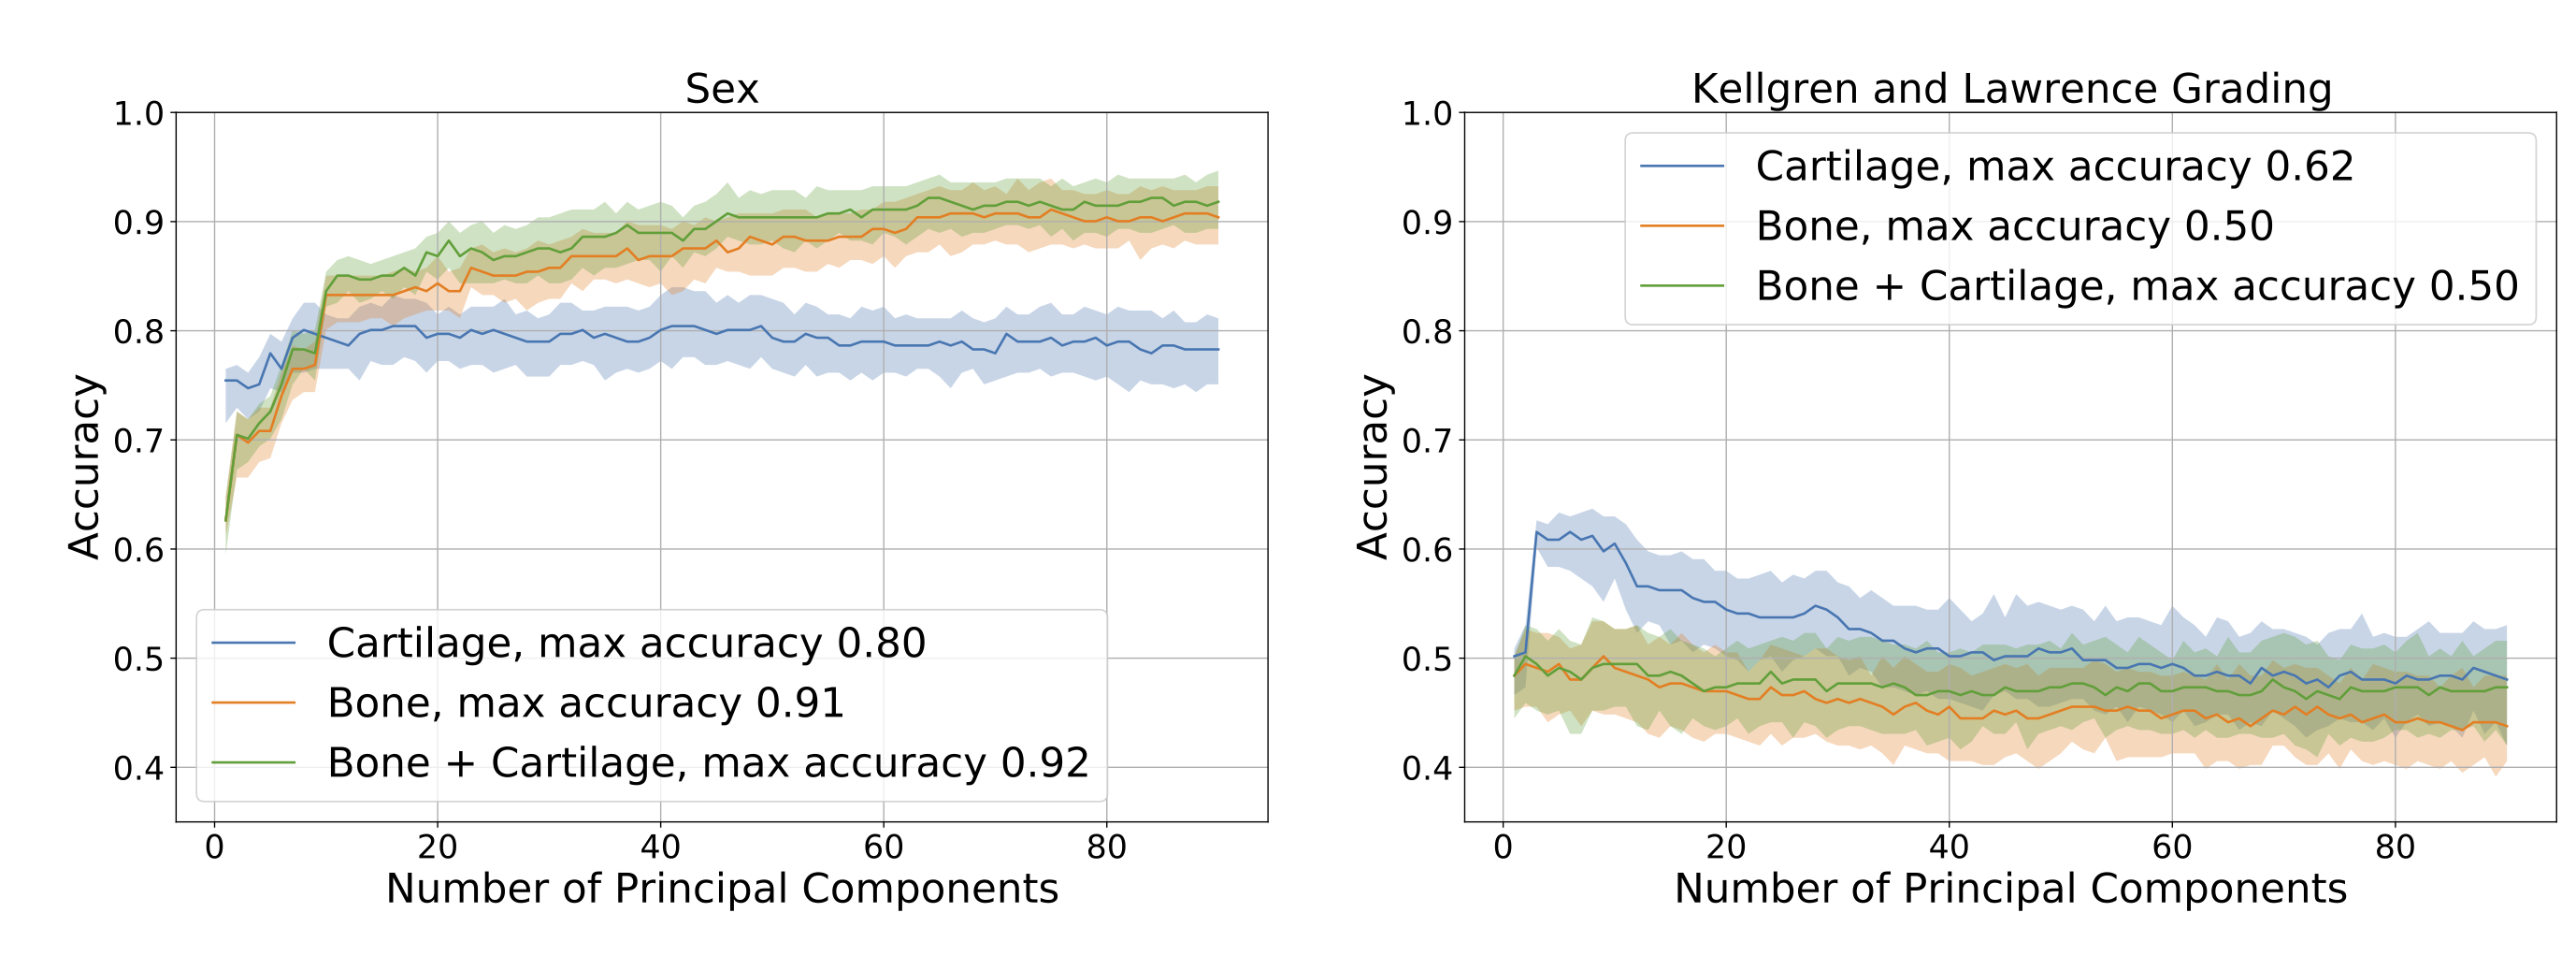
We compared the ability of the three statistical shape models (bone, cartilage, bone + cartilage) to predict participant demographics. On the training dataset, we fit linear regression (for age, height, weight, body mass index, KOOS-Pain, WOMAC-Pain) and logistic regression (for Kellgren-Lawrence (KL) grading, and sex) models. The regression models were trained using between 1-91 principal components (number needed to explain 90% of the variance in the bone model) and bootstrapping with replacement (100 repetitions). Comparison of regression models was performed on the held-out testing dataset after calculating principal component scores for each testing knee. These bootstrapping results were used to obtain median and 90% confidence interval R2 (linear regression) and accuracy (logistic regression) outcomes on the testing dataset. The different models were compared graphically, non-overlapping confidence intervals were interpreted as a conservative two-sided statistical significance at p=0.10.
RESULTS
Visual depiction of the bone shape and cartilage thickness model and the variance explained in the training set for all three statistical shape models is presented in Figure 1. Most models eventually overfit predicting demographics as demonstrated by a decreasing R2 with increasing number of principal components (Fig.2-4), with the exception of bone and bone + cartilage models for predicting sex. Three notable statistical differences were observed (p<0.10). The cartilage only models with <10 principal components performed significantly better than the bone or bone + cartilage model at predicting height. The cartilage only model performed statistically worse than the bone and bone + cartilage model at predicting sex. Finally, the cartilage only model performed statistically better than bone and bone + cartilage models, explaining upwards of ~60% of the variance, in predicting KL grade.DISCUSSION
Generally, the cartilage-only model required the least number of principal components to explain any specified amount of variance in shape. The bone shape only model required the second lowest number of principal components, however it tracked the explained variance of the bone + cartilage model closely.The regression analyses demonstrated that all models performed modestly (peak R2 ~0.1-0.4) at predicting absolute measures of body size (height, weight) and age. The ability to predict height with R2 upto 0.4 is interesting, particularly given that between subject differences in overall bone size was not included in the statistical shape models. The high R2 (~0.9) for the bone and bone + cartilage models for predicting sex indicates that there exist sex-specific inherent features of bone shape; these differences may be why men and women have different incidences of knee osteoarthritis11. The ability of the cartilage-only model to predict KL grade (R2 of 0.6, compared to 0.5 for bone and bone + cartilage models) suggests that joint bone and cartilage models may have reduced the generalizability in disease diagnosis.
CONCLUSION
When cartilage thickness is modeled on its own, it models salient information about disease state that bone and bone + cartilage cannot capture. However, when modelled jointly using principal components analysis, bone shape + cartilage thickness does not improve significantly on predictions of patient demographics when compared to bone shape only.Acknowledgements
This work was supported by the National Institutes of Health (R01 AR077604, R01 EB002524, and K24 AR062068) and the Wu Tsai Human Performance Alliance.Disclosures include: A.S. Chaudhari has provided consulting services to Subtle Medical, Culvert Engineering, Edge Analytics, Image Analysis Group, ICM, and Chondrometrics GmbH; and is a shareholder in Subtle Medical, LVIS Corp, and Brain Key; and received research support from GE Healthcare and Philips. A.A. Gatti is the founder of NeuralSeg Ltd.
References
1. Neogi T, Bowes MA, Niu J, et al. Magnetic Resonance Imaging-Based Three-Dimensional Bone Shape of the Knee Predicts Onset of Knee Osteoarthritis: Data From the Osteoarthritis Initiative: 3-D Bone Shape Predicts Incident Knee OA. Arthritis & Rheumatism. 2013;65(8):2048-2058. doi:10.1002/art.37987
2. Gao KT, Pedoia V, Young KA, et al. Multiparametric MRI characterization of knee articular cartilage and subchondral bone shape in collegiate basketball players. J Orthop Res. Published online September 17, 2020:jor.24851. doi:10.1002/jor.24851
3. Pedoia V, Lansdown DA, Zaid M, et al. Three-dimensional MRI-based statistical shape model and application to a cohort of knees with acute ACL injury. Osteoarthritis and Cartilage. 2015;23(10):1695-1703. doi:10.1016/j.joca.2015.05.027
4. Peterfy CG, Schneider E, Nevitt M. The osteoarthritis initiative: report on the design rationale for the magnetic resonance imaging protocol for the knee. Osteoarthritis and Cartilage. 2008;16(12):1433-1441. doi:10.1016/j.joca.2008.06.016
5. Gatti AA, Maly MR. Automatic knee cartilage and bone segmentation using multi-stage convolutional neural networks: data from the osteoarthritis initiative. Magnetic Resonance Materials in Physics, Biology and Medicine. Published online In-Press.
6. Lorensen WE, Cline HE. Marching Cubes: A High Resolution 3D Surface Construction Algorithm. ACM SIGGRAPH Computer Graphics. 1987;21(4):7.
7. Mun D, Kim BC. Three-dimensional solid reconstruction of a human bone from CT images using interpolation with triangular Bézier patches. Journal of Mechanical Science and Technology. 2017;31(8):3875-3886. doi:10.1007/s12206-017-0732-x
8. Valette S, Chassery JM, Prost R. Generic Remeshing of 3D Triangular Meshes with Metric-Dependent Discrete Voronoi Diagrams. IEEE Transactions on Visualization and Computer Graphics. 2008;14(2):369-381. doi:10.1109/TVCG.2007.70430
9. Valette S, Chassery JM. Approximated Centroidal Voronoi Diagrams for Uniform Polygonal Mesh Coarsening. Computer Graphics Forum. 2004;23(3):381-389. doi:10.1111/j.1467-8659.2004.00769.x
10. Lombaert H, Grady L, Polimeni JR, Cheriet F. FOCUSR: Feature Oriented Correspondence Using Spectral Regularization--A Method for Precise Surface Matching. IEEE Transactions on Pattern Analysis and Machine Intelligence. 2013;35(9):2143-2160. doi:10.1109/TPAMI.2012.276
11. Srikanth VK, Fryer JL, Zhai G, Winzenberg TM, Hosmer D, Jones G. A meta-analysis of sex differences prevalence, incidence and severity of osteoarthritis. Osteoarthritis and Cartilage. 2005;13(9):769-781. doi:10.1016/j.joca.2005.04.014
Figures
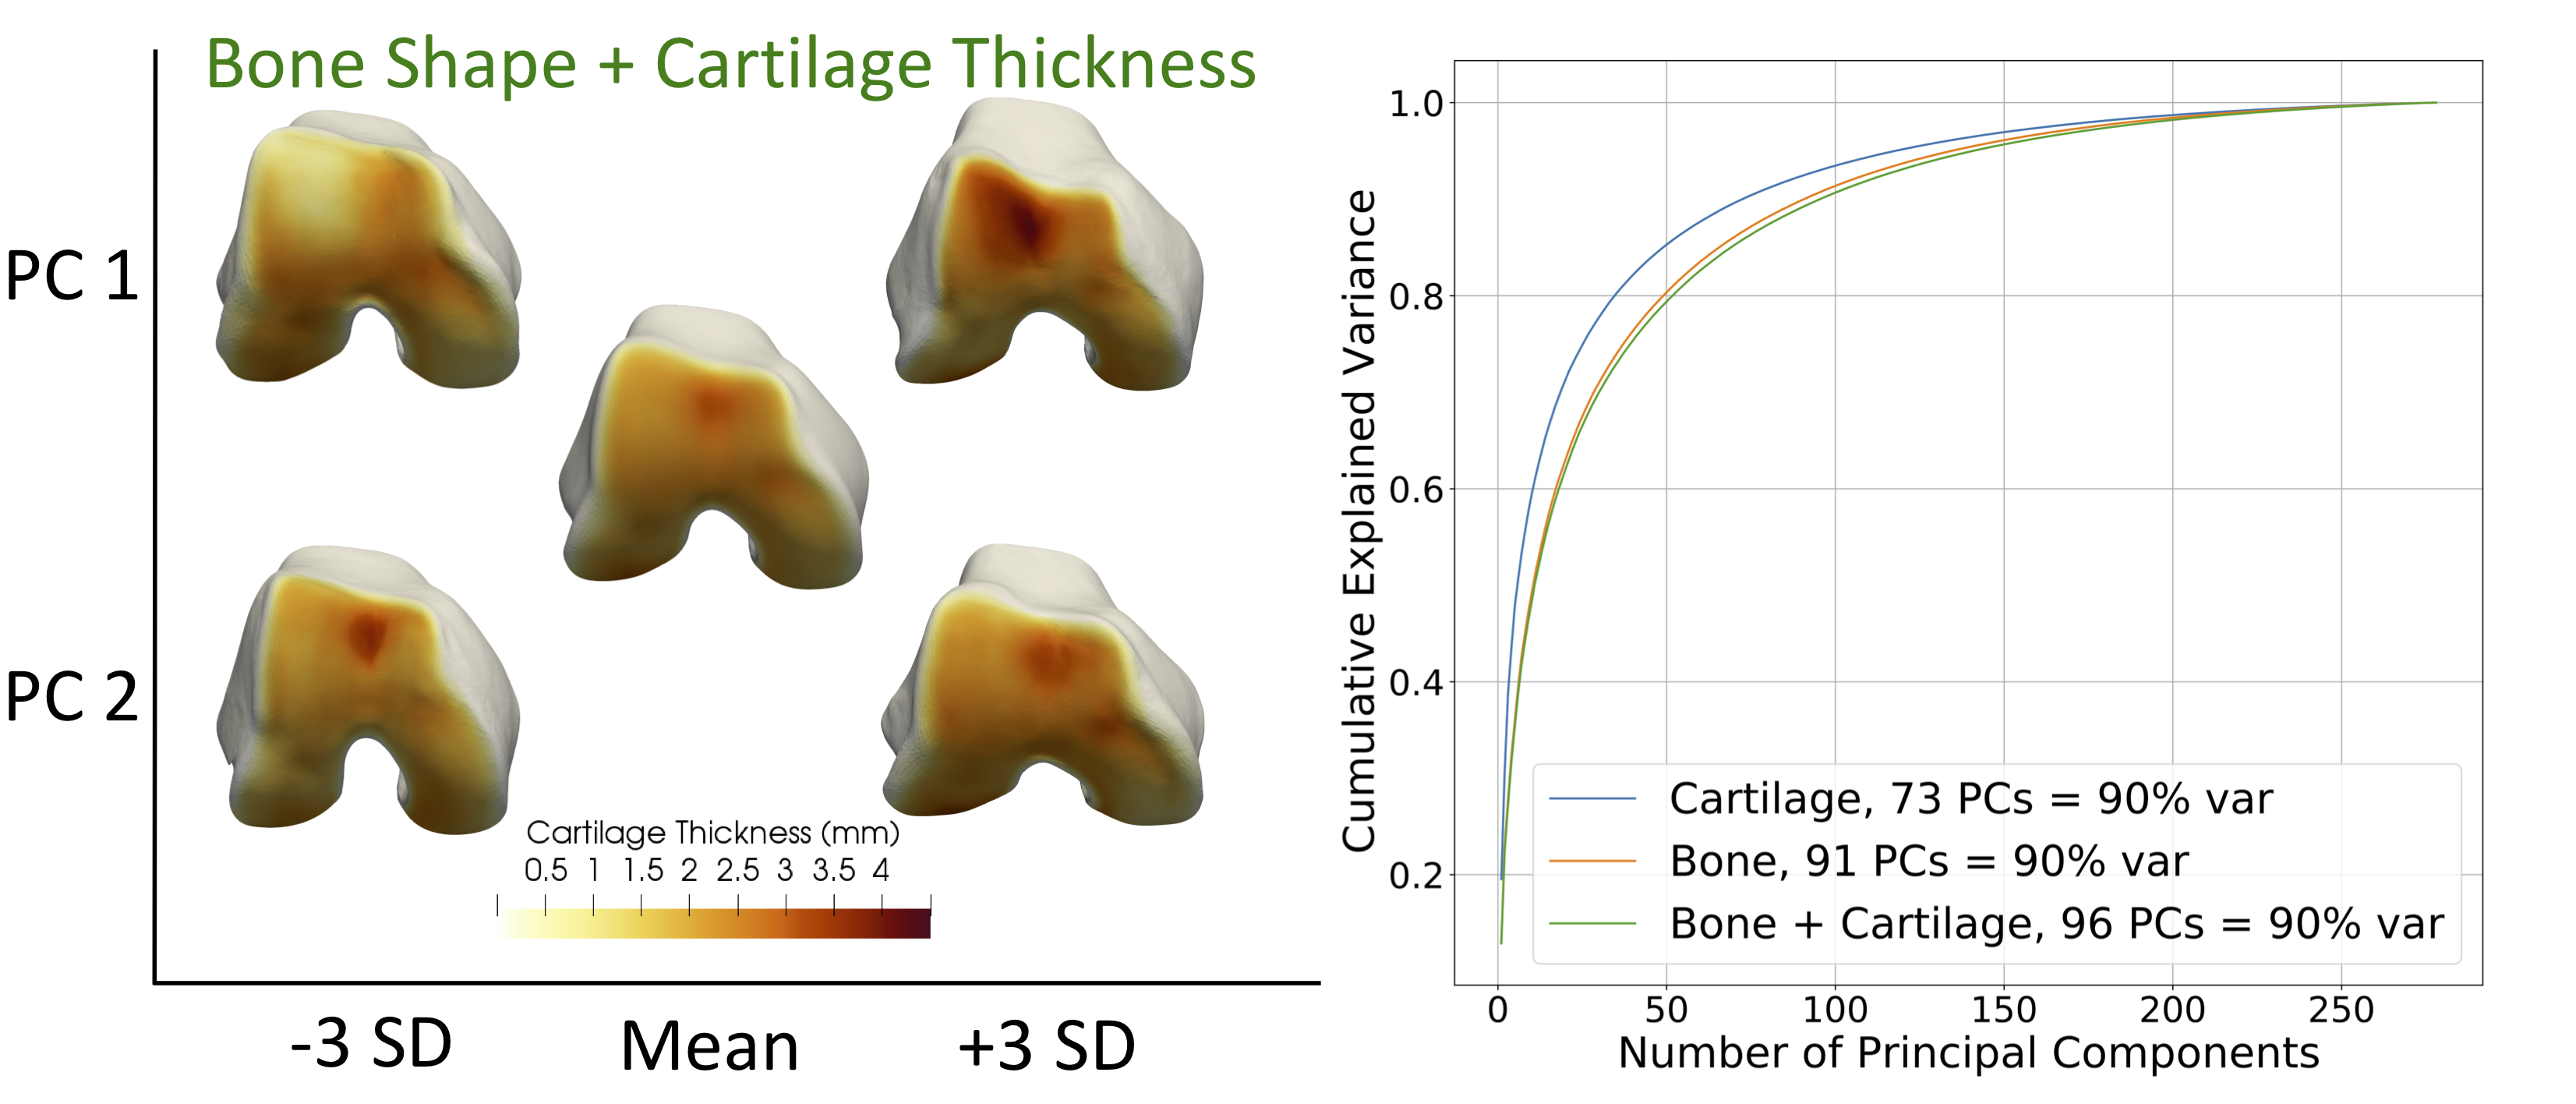
Figure 1. Visual depiction of the first two principal components (PC) of the bone shape + cartilage thickness statistical shape model (left) and the cumulative explained variance of each of the statistical shape models (right). For the shape model visualization, the center knee is the mean shape, the PC is labeled on the y-axis and the position in the distribution (-3 standard deviations (SD) to +3 SD) is labeled on the x-axis.
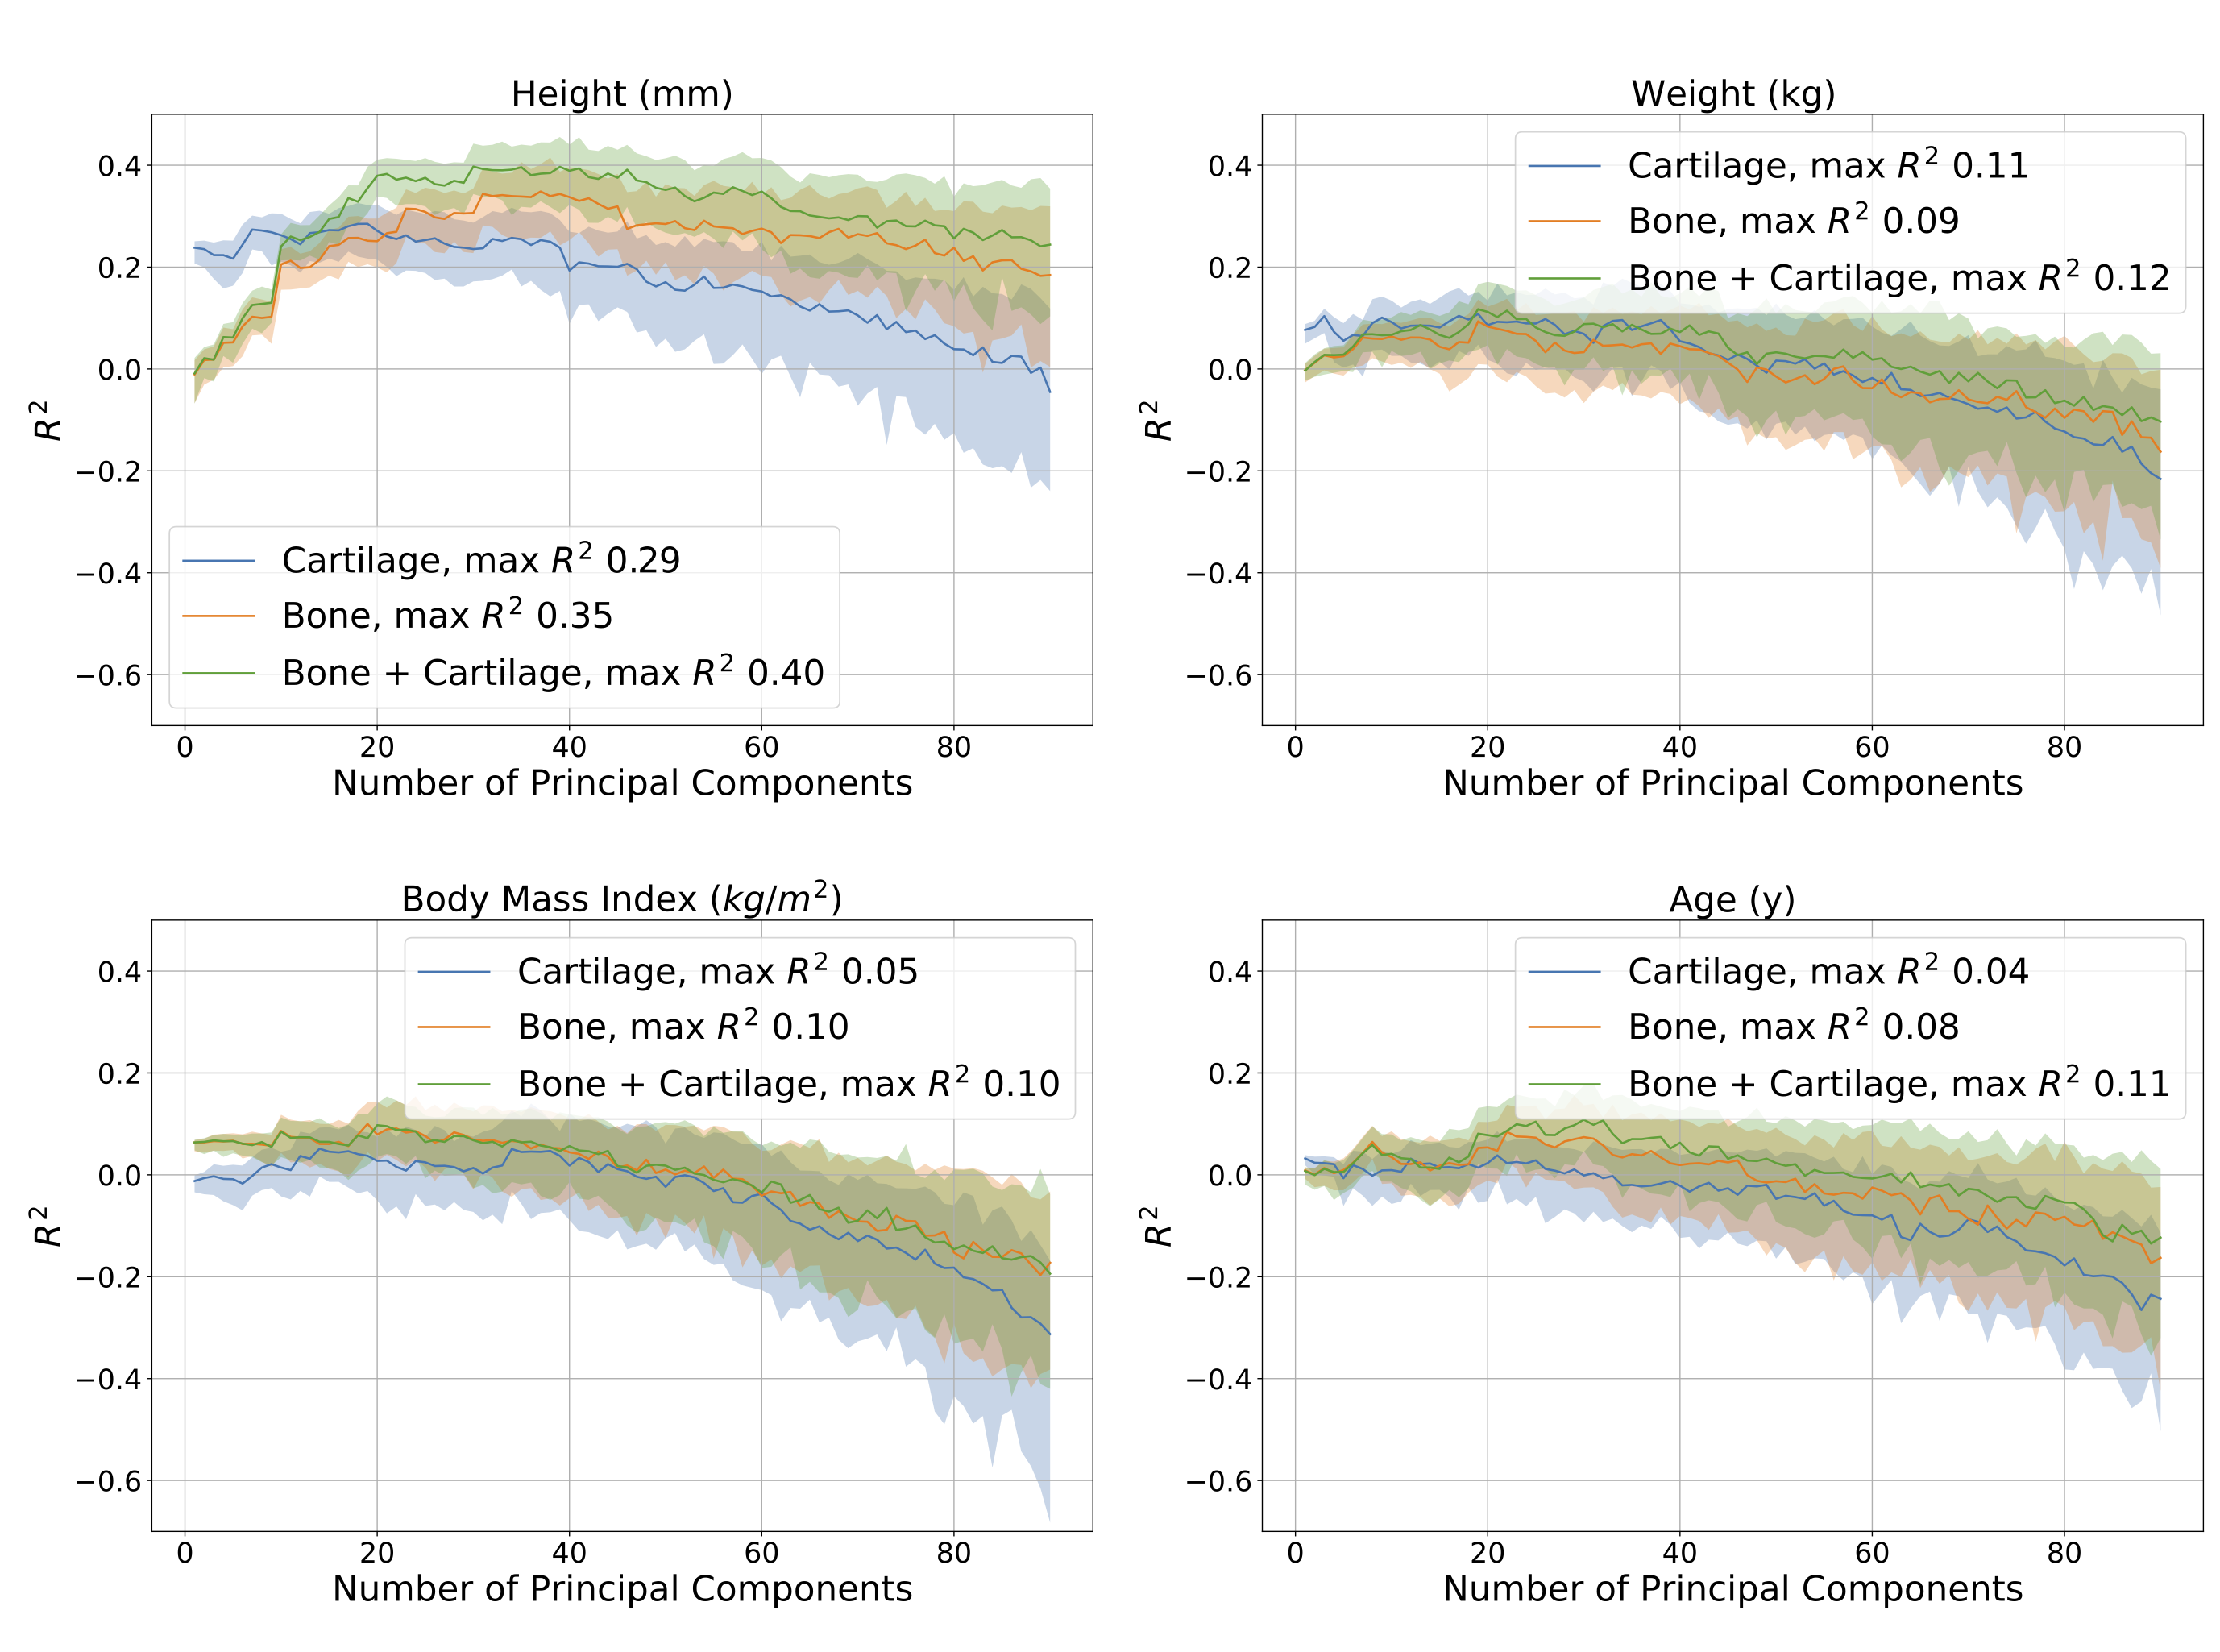
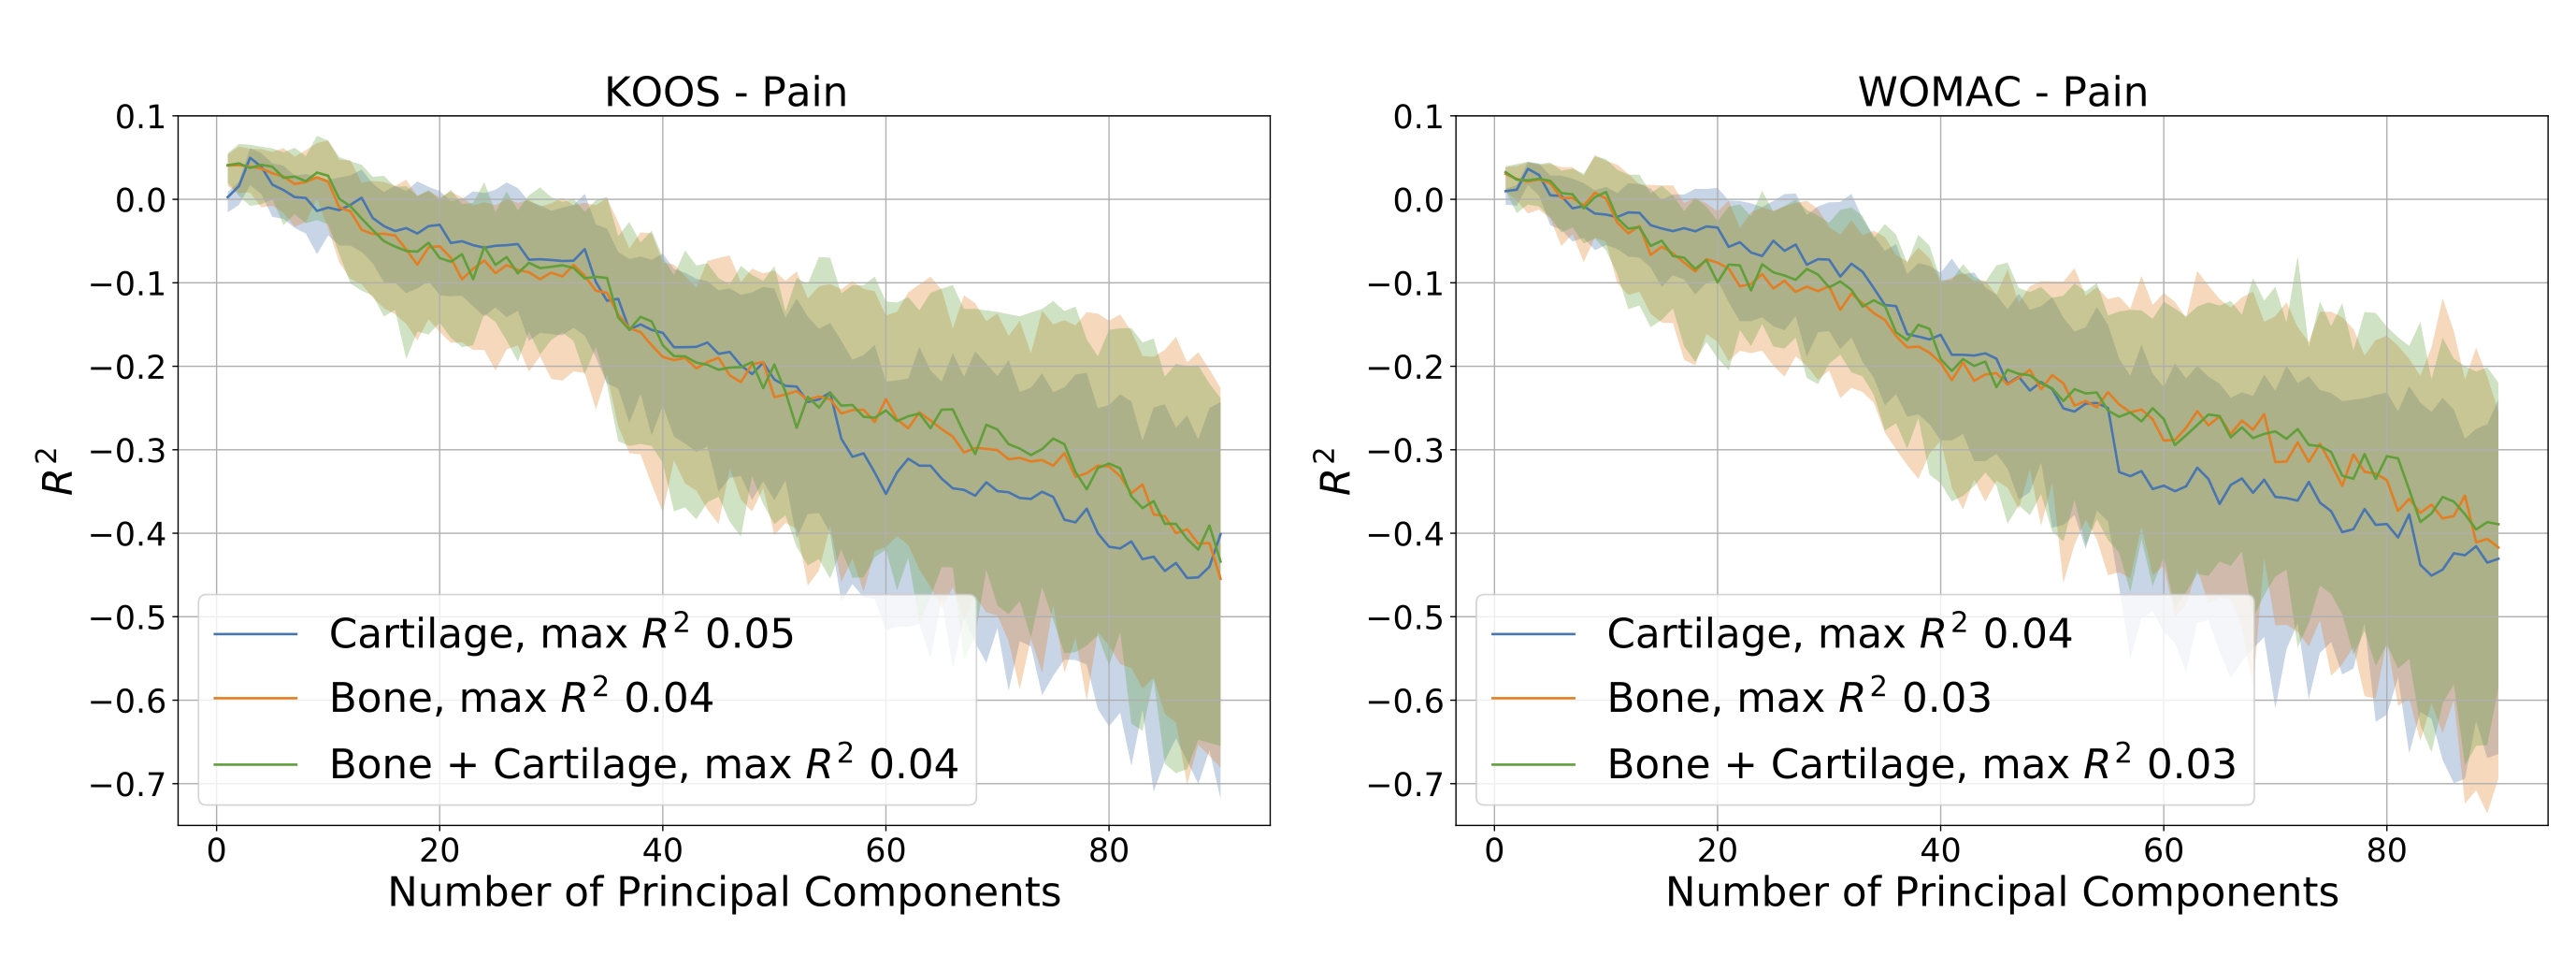
Figure 3. Comparison of the ability of the bone, cartilage, and bone + cartilage statistical shape models to predict patient reported pain outcomes including from the Knee Osteoarthritis Outcome Score (KOOS) and the Western Ontario and McMaster University Osteoarthritis Index (WOMAC). The x-axes indicate the number of principal components (selected sequentially) that were included in the model. Shading represents the 90% confidence interval determined using bootstrapping.