4430
AI-based prediction of patient mobility using MRI data from the Osteoarthritis Initiative
Bragi Sveinsson1,2 and Matthew S Rosen1,2,3
1Radiology, A. A. Martinos Center, Massachusetts General Hospital, Boston, MA, United States, 2Radiology, Harvard Medical School, Boston, MA, United States, 3Physics, Harvard University, Cambridge, MA, United States
1Radiology, A. A. Martinos Center, Massachusetts General Hospital, Boston, MA, United States, 2Radiology, Harvard Medical School, Boston, MA, United States, 3Physics, Harvard University, Cambridge, MA, United States
Synopsis
With an aging population, decreased muscle mass from conditions such as sarcopenia can be expected to lead to frequently decreased mobility, lowering patient quality of life. To develop effective treatments to slow down mobility loss, it is essential to obtain robust, objective mobility measurements that ideally do not require patient tasks. In this work, we explore the feasibility of predicting patient mobility by applying a neural network on sagittal knee MR images and accelerometry data from the Osteoarthritis Initiative.
Introduction
Decreased muscle mass and function due to conditions such as sarcopenia can lead to loss of mobility, impacting the patient’s quality of life. Mobility is commonly assessed by having the patient perform tasks, such as having their gait speed measured. Such task-based assessments inherently involve variability due to the subject’s variable level of cooperation. An objective measure of mobility, not involving patient participation, would be a useful tool for monitoring the patient’s health and for assessing treatment efficacy. In this work, we explore the feasibility of training a neural network to predict mobility based on sagittal knee MR images, using data from the Osteoarthritis Initiative (OAI)1 for training. In these preliminary results, we demonstrate a moderately higher success ratio than would be expected from a network without predictive power and examine the anatomical relevance of the network’s predictions.Methods
Sagittal DESS knee images from 1219 patients in the Osteoarthritis Initiative, along with accompanying accelerometry data, were used as input into a neural network. Of the several sagittal DESS slices available from each patient, the center slice was chosen as the input. The accelerometry data for each subject consisted of number of minutes of light, moderate, and vigorous activity per day, measured over a week, based on previously established thresholding rules2. By defining subjects with an average of 10 or more moderate/vigorous activity minutes per day over the measurement period as mobile, the data set could be split into mobile and non-mobile subjects. While this is a lower number of active minutes than often used for defining mobility, this threshold had the benefit of giving an approximately even split of mobile (595) and non-mobile (624) subjects. The center DESS slice of each subject was then used as input to an image classification network as shown in Figure 1, with the mobile/non-mobile classification as a label. As shown in Figure 1, the network has four convolutional layers (with the first two applied consecutively), with downsampling achieved by max pooling which is followed by 50% dropout. The kernel sizes were 3×3. These were followed by two dense layers as shown. All layers used ReLU activation. The network used the Adam optimizer, a batch size of 16, a binary cross entropy loss function, and was trained over 50 epochs, taking about 9 minutes to train. Using Tensorflow and Keras, the ImageDataGenerator class was used to augment the data through small shifts and rotations, with 69 steps per epoch.Results
10-epoch rolling averages of the network learning curves are shown in Figure 2, showing the accuracy with which subjects were categorized as mobile or non-mobile during training and validation. The final average validation accuracy value was 57%. The curves do indicate that the network is currently overfitting, suggesting that even better results could be obtained using methods such as more dropout or more augmentation, and these approaches are currently being investigated. The activity heat map for a mobile subject in Figure 3 indicates that the network found the anatomical details surrounding the posterior cruciate ligament (PCL) to be pertinent to predicting patient mobility.Discussion
The preliminary results of this feasibility study indicate that classifying subjects into mobile (having more than 10 minutes of moderate/vigorous activity per day) or non-mobile can be predicted with a neural network with a success rate of 57%, based only on a single sagittal MR image. This can be compared with the performance of a network with no predictive abilities, which could be expected to have a success rate of about 51% with our dataset. Our network therefore gives an improvement by a factor of about 1.12. Based on the learning curves in Figure 2, this can likely be improved with more advanced network design or data augmentation. Such approaches are currently being pursued. Predicting mobility from image data in such a manner could provide a more objective metric for assessing patient mobility than is achievable by having patients perform tasks such as having gait speed measured. Furthermore, task-based data may not always be available, such as when looking retrospectively at previously acquired image data. These preliminary results indicate that neural networks could provide a new and valuable tool for investigating loss of mobility from conditions such as sarcopenia, which is expected to grow in prevalence with an aging population. Interestingly, the results shown in Figure 3 indicate that the network found the anatomy of the PCL region to be important for mobility estimation. This could be due to differences in swelling and wear and tear between the two groups, but further studies are required to investigate this.Conclusion
Preliminary data indicates the feasibility of classifying subjects as mobile or non-mobile by analyzing knee MR images with a neural network, with a success rate higher than random chance. Such a development could potentially provide a new tool for assessing treatments to combat mobility impairment.Acknowledgements
This study was performed with support from the National Institutes of Health, grant K99AG066815. Data used in this study were obtained and analyzed from the controlled access datasets distributed from the OAI, which is a collaborative informatics system created by the National Institute of Mental Health and the National Institute of Arthritis and Musculoskeletal and Skin Diseases (NIAMS) to provide a worldwide resource to quicken the pace of biomarker identification, scientific investigation, and OA drug development.References
[1] Eckstein Nature 2012; [2] Troiano Med Sci Sports Exerc. 2008Figures
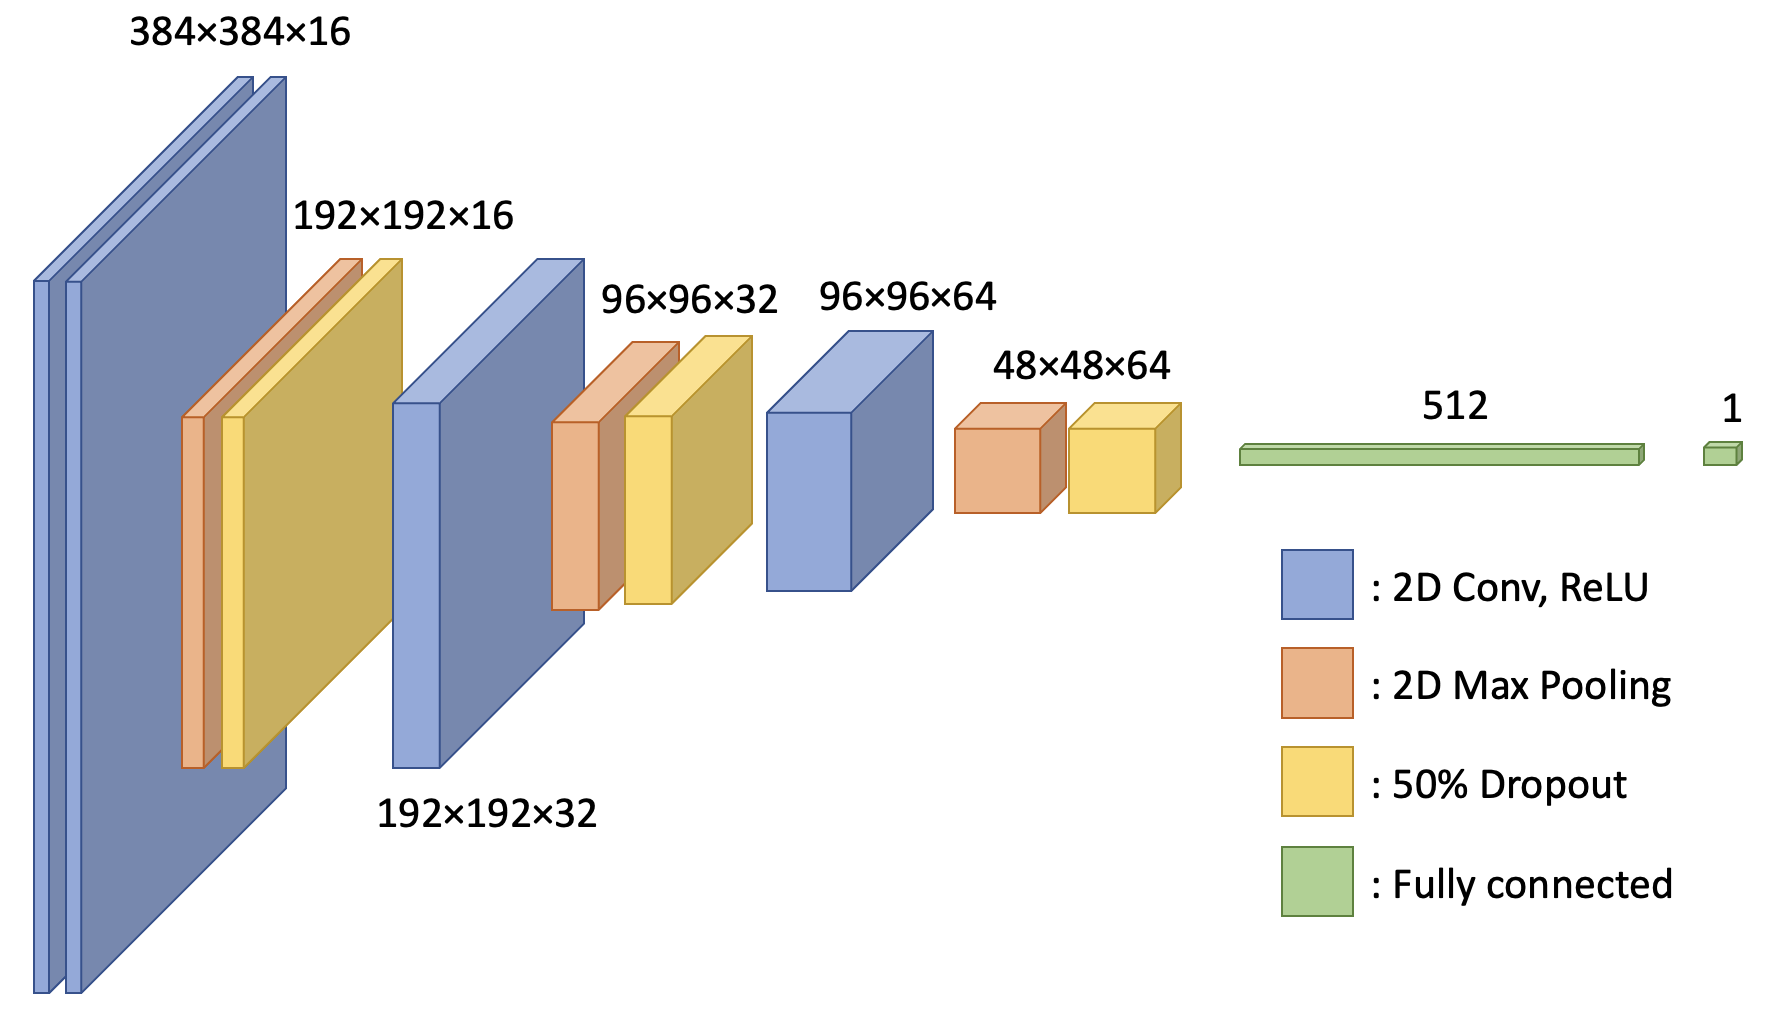
Figure 1: A schematic of the network used for classification of subjects into mobile or non-mobile. The input data is in the form of 384×384 sagittal DESS knee images from the Osteoarthritis Initiative.

Figure 2: Learning curves showing training and validation accuracy as functions of epoch number. The curves show 10-epoch rolling averages for increased smoothness. While the network does show signs of overtraining, the solutions of which are currently being explored, it does also show a better success rate during validation (57%) than would be expected from a non-predictive network (51%).

Figure 3: An activation map showing the anatomical regions most pertinent for mobile/non-mobile classification for a sample mobile subject. Interestingly, the network puts high emphasis on the posterior cruciate ligament region.
DOI: https://doi.org/10.58530/2022/4430