4428
Comparison of Double Quantum (DQ) Suppression Methods for Inversion Recovery TQTPPI (IRTQTPPI) Sequence1Computer Assisted Clinical Medicine, Heidelberg University, Mannheim, Germany
Synopsis
This study proposes an inversion recovery TQTPPI pulse sequence to create triple quantum (TQ) coherences utilizing the $$$T_1$$$ relaxation pathway. Different double quantum (DQ) suppression methods provide stable fit results with reasonable SNR. The $$$T_1$$$-TQ signal is sensitive to faster motion than the conventional $$$T_2$$$-TQ pathway and thus provides additional information about sodium-protein interactions.
Introduction
To leverage the full potential of sodium triple-quantum (TQ) signal, a deeper understanding of sodium–protein interactions is necessary. Previous studies1-4 mainly created TQ signals using $$$T_2$$$ relaxation pathway based on the $$$T_{1\pm1}\rightarrow T_{3\pm1}$$$ transition, such as TQ time proportional phase incrementation (TQTPPI) pulse sequence4. The TQTPPI pulse sequence allows to simultaneously determine single quantum (SQ) and TQ signals, and bi-exponential relaxation times by a non-linear FID fit. Hence, the TQ signal amplitude and the reference to the SQ signal render the TQ/SQ ratio, a quantitative parameter between different studies.An alternative pathway for creation of TQ signal is $$$T_1$$$ relaxation based on the $$$T_{10}\rightarrow T_{30}$$$ transition. This $$$T_1$$$-TQ signal is sensitive to an intermediate motional regime ($$$\omega_0\tau_c\sim1$$$) compared to the slow motional regime ($$$\omega_0\tau_c\gtrsim1$$$) of the $$$T_2$$$-TQ signal. The majority of sodium–protein interactions are characterized by small correlation times $$$\tau_c$$$5. Thus, the $$$T_1$$$-TQ signal can provide valuable information to better characterize sodium-protein interactions and improve our understanding on the TQ signal formation in biological environments. Jaccard et al.6 have already proposed a TQ filtration pulse sequence using the $$$T_1$$$ relaxation pathway. However, for quantitative measurements a pulse sequence yielding a quantitative $$$T_1$$$-TQ/SQ ratio similar to the $$$T_2$$$-TQ/SQ ratio of the TQTPPI pulse sequence is necessary. Thus, the pulse sequence needs to be capable to simultaneously determine SQ and TQ signals, and bi-exponential $$$T_1$$$ relaxation times.
This study proposes an inversion recovery TQTPPI (IRTQTPPI) pulse sequence for quantitative -TQ/SQ ratio measurements similar to the original TQTPPI pulse sequence. To obtain reliable fit results, two different phase cycles are proposed to cancel out DQ signal.
Material and Methods:
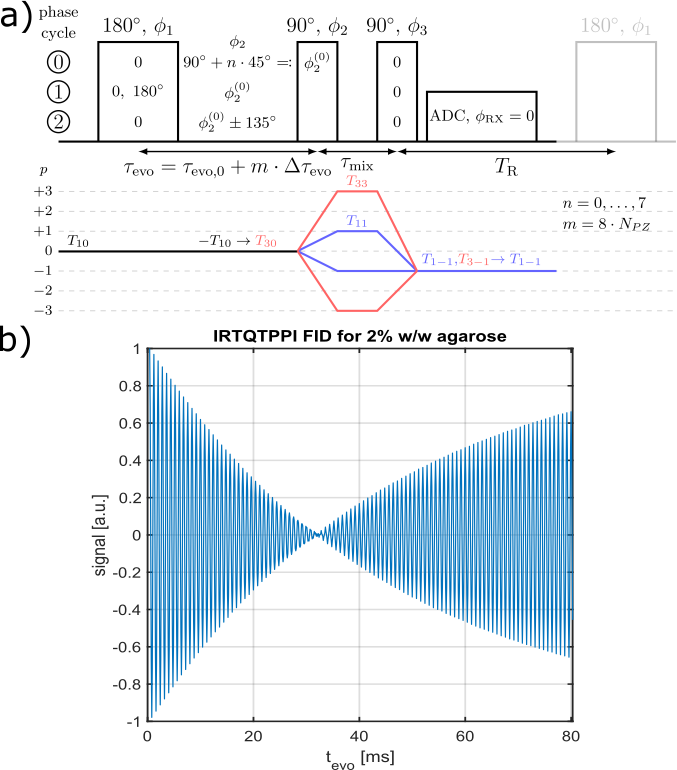
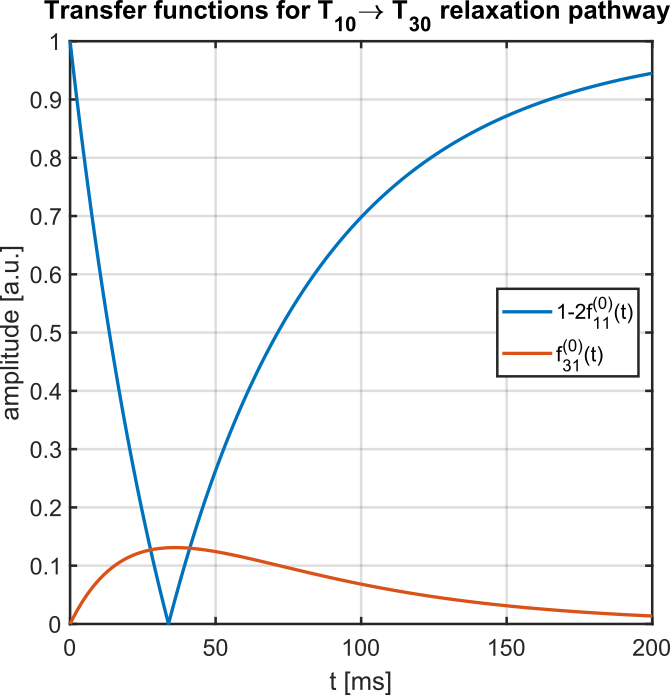
Fig.1 shows the IRTQTPPI pulse sequence consisting of a 180° pulse and two 90° pulses. The 180° pulse inverts longitudinal magnetization and during the subsequent evolution time interval biexponential $$$T_1$$$ relaxation processes transfer magnetization via $$$T_{10}\rightarrow T_{30}$$$. A following 90° pulse converts the $$$T_{30}$$$ magnetization to $$$T_{3\pm3}$$$, TQ signal. The second 90° pulse transfers this magnetization to $$$T_{3-1}$$$ and relaxation processes result in observable SQ signal via $$$T_{3-1}\rightarrow T_{1-1}$$$. Imperfect pulses lead to the creation of a DQ signal, which affects the quantification of SQ and TQ signals. Thus, we propose two DQ suppression methods based on constructive and destructive interference of wanted and unwanted signal components, respectively.Phase cycle 1 reduces the impact of an imperfect inversion of the 180° pulse by altering the phase of the 180° pulse between 0 and 180°. The phase alteration does not affect longitudinal magnetization, while transverse magnetization destructively interferes.
Phase cycle 2 alters the phase of the second pulse by $$$\pm135^\circ$$$. This leads to destructive interference of signal components with even coherence differences, like the transition $$$T_{30}\rightarrow T_{3\pm2}$$$. The phase alteration causes a phase shift between the SQ and TQ signal of 180°.
Measurement data was acquired at a 9.4T preclinical MRI (Bruker Biospec 94/20) using a linear 1H/23Na Bruker volume coil. The samples consisted of [2,4,6]% w/w agarose phantoms with 154mM NaCl. The IRTQTPPI FID was non-linearly fitted by
$$Y(t)=\sin(\omega t+\phi_1)\cdot\left(1-A_{SQ,1}e^{-t/T_{1f}}+A_{SQ,2}e^{-t/T_{1s}}\right)+A_{TQ}\sin(3\omega t+\phi_2)\left(e^{-t/T_{1f}}-e^{-t/T_{1s}}\right)+DC$$
where $$$Y(t)$$$ is the IRTQTPPI FID amplitude and $$$A_{SQ,i}$$$ and $$$A_{TQ}$$$ are the amplitudes of the SQ and TQ signals, respectively. $$$T_{1s}$$$ and $$$T_{1f}$$$ are the slow and fast relaxation times, respectively. The mean and standard deviation of the fit parameters were determined by averaging 100 fit results with random initial values.
Results/Discussion:
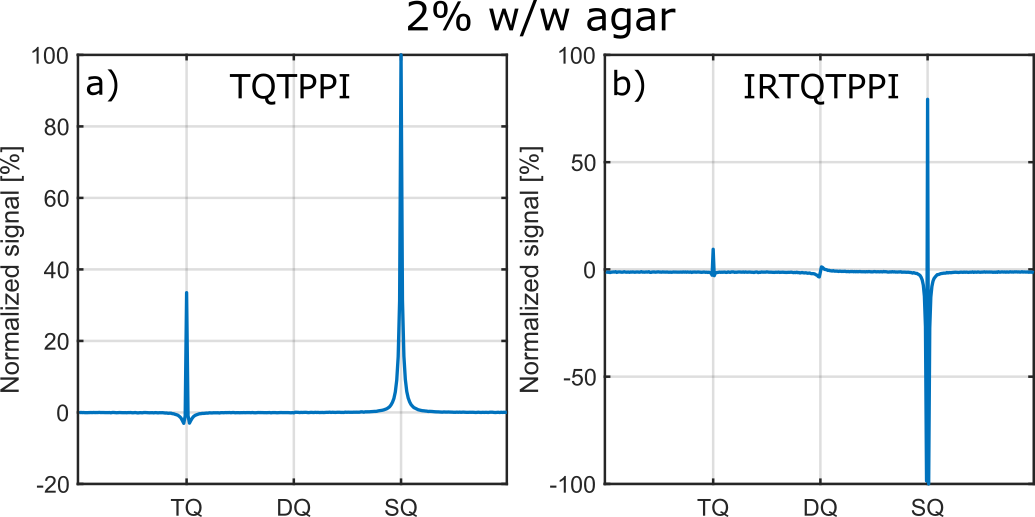
Compared to the TQTPPI FID, the IRTQTPPI FID features a zero-crossing of the SQ signal (Fig.1b and Fig.2). This zero-crossing approximately coincides with the TQ signal maximum and thus only the TQ signal contributes to the signal in this region. Consequently, the zero-crossing may improve the determination of the TQ signal using nonlinear FID fit.Fig.3 shows an exemplary IRTQTPPI spectrum compared to TQTPPI spectrum. The $$$T_1$$$-TQ peak was smaller compared to the $$$T_2$$$-TQ peak using 2% w/w agarose, for which slow interactions dominate. The rebuild of thermal equilibrium $$$T_{10}$$$ which results in a higher SQ signal amplitude and insensitivity of the $$$T_1$$$-TQ signal to very slow motion cause the smaller relative $$$T_1$$$-TQ peak. Moreover, the contribution of DQ signal to the IRTQTPPI FID significantly reduced the reliability of fit parameters (Tab.1). Hence, the IRTQTPPI pulse sequence required a DQ suppression for reliable and stable determination of fit parameters.
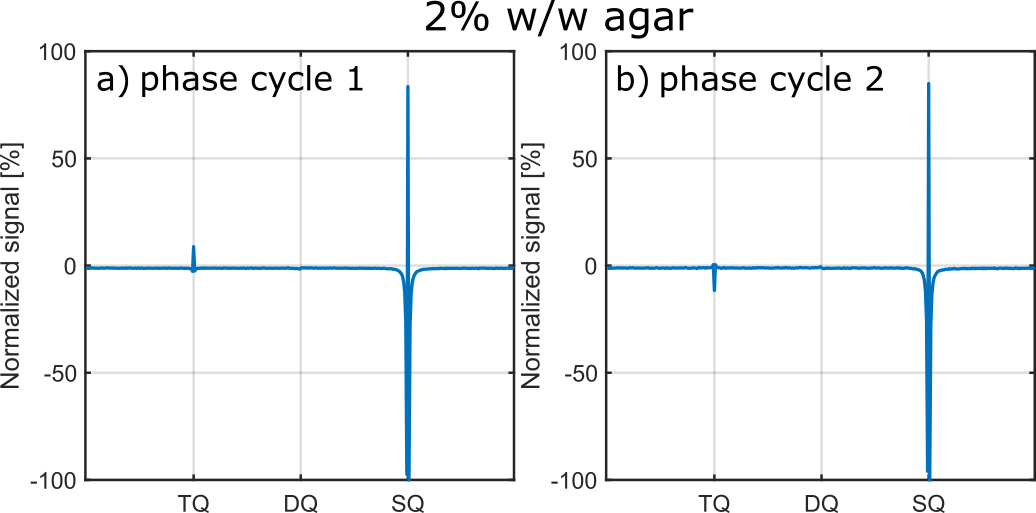
Fig.4 show exemplary IRTQTPPI spectra of both DQ suppression phase cycles. In both cases, DQ signal substantially reduced. However, phase cycle 1 did not substantially improve the reliability of the nonlinear FID fit. In contrast, phase cycle 2 provided stable fit results, even though this method yielded a $$$\sqrt{2}$$$ times lower signal amplitude than phase cycle 1. Phase cycle 2 caused a 180° phase shift of the TQ peak relative to the SQ peak (Fig.4). This may resulted in an improved separation of SQ and TQ signals and thus more reliable fit results.
Conclusion
The IRTQTPPI pulse sequence combined with phase cycle 2 for DQ suppression provides a novel and reliable method to simultaneously quantify SQ and TQ signals, and bi-exponential $$$T_1$$$ relaxation times. This pulse sequence yields valuable information about sodium-protein interactions on an intermediate motional regime, and thus can improve the characterization of the sodium MR environment.Acknowledgements
No acknowledgement found.References
1. Hoesl MAU, Kleimaier D, Hu R, et al. 23Na Triple-quantum signal of in vitro human liver cells, liposomes, and nanoparticles: Cell viability assessment vs. separation of intra- and extracellular signal. J Magn Reson Imaging. 2019;50(2):435-444.
2. Kleimaier D, Reichert S, Schepkin VD, Schad L. Sodium TQ signal of amino acids and α-lactalbumin in comparison to bovine serum albumin. Proc Intl Soc Mag Reson Med. 2021;29.
3. Kleimaier D, Schepkin V, Hu R, Schad LR. Protein conformational changes affect the sodium triple-quantum MR signal. NMR Biomed. 2020;33(10):e4367.
4. Schepkin VD, Neubauer A, Nagel AM, Budinger TF. Comparison of potassium and sodium binding in vivo and in agarose samples using TQTPPI pulse sequence. J Magn Reson. 2017;277:162-168.
5. Rooney WD, Springer Jr CS. The molecular environment of intracellular sodium: 23Na NMR relaxation. NMR Biomed. 1991;4(5):227-245.
6. Jaccard G, Wimperis S, Bodenhausen G. Multiple-quantum NMR spectroscopy of S=3/2 spins in isotropic phase: A new probe for multiexponential relaxation. The Journal of Chemical Physics. 1986;85(11):6282-6293.
Figures