4424
Dynamic MTRasym in GlucoCEST MRI using modified DGE1Digital Innovation, GE Healthcare, Sao Paulo, Brazil, 2Univesidade de Sao Paulo, Sao Paulo, Brazil, 3Hospital Sirio-Libanes, SAO PAULO, Brazil, 4Hosputal Sirio-Libanes, SAO PAULO, Brazil, 5GE Healthcare, SAO PAULO, Brazil, 6GE Healthcare, RIO DE JANEIRO, Brazil, 7Universidade de Sao Paulo, SAO PAULO, Brazil, 8GE Healthcare, Tokyo, Japan
Synopsis
A new method to create B0 corrected dynamic MTRasym glucoCEST maps during glucose administration and uptake without the need of acquiring a full Z-Spectrum with small changes in DGE. Results observed in 3T.
Introduction
Glucose weighted chemical exchange saturation transfer (glucoCEST 1) is a method to assess glucose concentration using the chemical exchange saturation transfer (CEST 2,3) technique. By selectively saturating the glucose it allows a continuous transfer of magnetization to bulk water protons, leading to proportional increase of saturation in water. The most common technique used to visualize the contrast caused by the saturation is the magnetization transfer ratio asymmetry (MTRasym 3), which requires a series of acquisitions at different saturation frequencies to create the water saturation spectrum (Z-spectrum). As a series of acquisitions are needed to create the Z-Spectrum which is time consuming, its usage seems impractical to observe the glucose administration and its metabolism in the human body. To address this issue a method called dynamic glucose enhancement (DGE 4) was proposed which uses a baseline reference and observes its signal variation during glucose administration. However, this signal variation might be affected also by motion, B0 inhomogeneity issues, or other factors 1. We propose changes to DGE method to obtain B0 corrected dynamic MTRasym maps during glucose administration and uptake without the need of acquiring a full Z-Spectrum (Figure 1).Methods
Five patients with primary brain tumors and fasting for at least 6 hours underwent glucoCEST MRI on a 3T scanner (GE Healthcare, Milwaukee, USA) in agreement with local IRB conditions. A D50 glucose (30 g in 60 ml of water sterile solution) was infused for 2 minutes using a power injector. A GE research pulse sequence descriptor (PSD) was used to acquire a single axial FSE image (TE/TR=Xms/4s), 8 mm slice thickness with FOV=22cm and matrix=128, saturating with a continuous wave CEST pulse of 2µT for 2s. A thermoplastic head mask was used to minimize movement 5 (Figure 2).The CEST acquisition started with a signal reference image (S0) followed by 29 acquisitions saturating from +7 to -7 ppm, varying in 0.5 ppm steps (1st Z-spectrum). Then, 39 sets of 5 acquisitions each, saturating from +3 to +1 ppm, in 0.5 ppm steps were acquired with glucose infusion starting after the 3rd set was completed. At the end acquisition of the Z-spectrum was repeated (Figure 3). All acquisitions were motion corrected before post-processing. First Z-Spectrum was used to apply B0 field correction to the +2 ppm signal (glucose target). This was possible because at each time point signal was acquired with saturation at +2 ±1 ppm.
To obtain MTRasym maps we used the signal at target frequency (+2 ppm, Starget), the first Z-spectrum acquisition to provide the -2 ppm (Sref) signal and the signal without CEST pulse S0 (Figure 1).
Results
Figure 4 displays the dynamic behavior of MTRasym during glucose injection for tumor and contralateral ROIs in 5 patients. For all patients MTRasym values were consistently higher in tumor than in contralateral ROI. Noteworthy all ROIs displayed a MTRasym decrease during dynamic acquisition. For comparison purposes we also calculated DGE mean AUC maps for the first 2 (AUC2min), and last 9 minutes (AUC9min) after glucose injection (Figure 4). For normal brain regions AUC9min was always lower than AUC2min, in accordance with previous studies 1,4.When comparing the first and second Z-Spectrum a considerable signal increase was observed for all patients, which was more pronounced at the negative side of the spectrum (Figure 5).
Discussion
MTRasym values in the lesion were higher than in the contralateral region, indicating that CEST acquisition and analysis was sensitive to detect tumor hypermetabolism. Surprisingly we found an MTRasym decrease instead of an increase during the dynamic experiment. The lack of significant increase during glucose uptake might be related to the selection of the ROI in the tumor, that did not match with the Gd-enhancing region (experiment was restricted to single slice acquisition), but the consistent decrease is intriguing. Similar behavior was observed by other authors at 3T 1, and they raised as possible explanations a susceptibility-based frequency shift or a tissue signal change due to osmolarity differences between blood and tissue. Our method allowed us to correct B0 homogeneities, which made us think that this observation might be related to physiological changes caused by glucose uptake. Glucose infusion might be changing the osmotic equilibrium in brain tissue, causing it to accumulate water and thereover increasing the T2 signal. As a matter of fact, when comparing the 1st Z-spectrum to the 2nd one, a significant signal increase was observed, probably indicating a reduction of the Direct Water Saturation (DS) after the infusion. However, this signal increase seems to be higher in the negative part of the spectrum, indicating that it cannot be only explained by a DS effect.Although patients had heads movements limited by thermoplastic mask, it is also possible that some movement might be occurring and causing some of the unexpected signal variations.
Conclusion
The proposed technique allowed us to observe the dynamic B0 corrected MTRasym without acquiring a full Z-Spectrum at each time point, although currently limited to single slice acquisition.We found an unexpected asymmetric signal increase in the Z-spectrum after glucose injection. This signal increase might lead to underestimation of the CEST effect and its effect on dynamic GlucoCEST maps should be further elucidated.
Acknowledgements
No acknowledgement found.References
1. Xu X, Sehgal AA, Yadav NN, et al: d-glucose weighted chemical exchange saturation transfer (glucoCEST)-based dynamic glucose enhanced (DGE) MRI at 3T: early experience in healthy volunteers and brain tumor patients. Magn. Reson. Med. 2020; 84: 247–262.
2. Vinogradov, Elena; Sherry A Dean’; Lekinski RE: CEST: from basic principles to applications, challenges and opportunities. J Magn Reson Imaging 2013; 229: 155–172.
3. Wu B, Warnock G, Zaiss M, et al: An overview of CEST MRI for non-MR physicists. EJNMMI Phys. 2016.
4. Xu X, Yadav NN, Knutsson L, et al: Dynamic Glucose-Enhanced (DGE) MRI: Translation to Human Scanning and First Results in Glioma Patients. 2015. Available at: http://dx.doi.org/10.18383/j.tom.2015.00175.
5. Wang J, Weygand J, Hwang KP, et al: Magnetic Resonance Imaging of Glucose Uptake and Metabolism in Patients with Head and Neck Cancer. Sci. Rep. 2016; 6: 1–7.
Figures
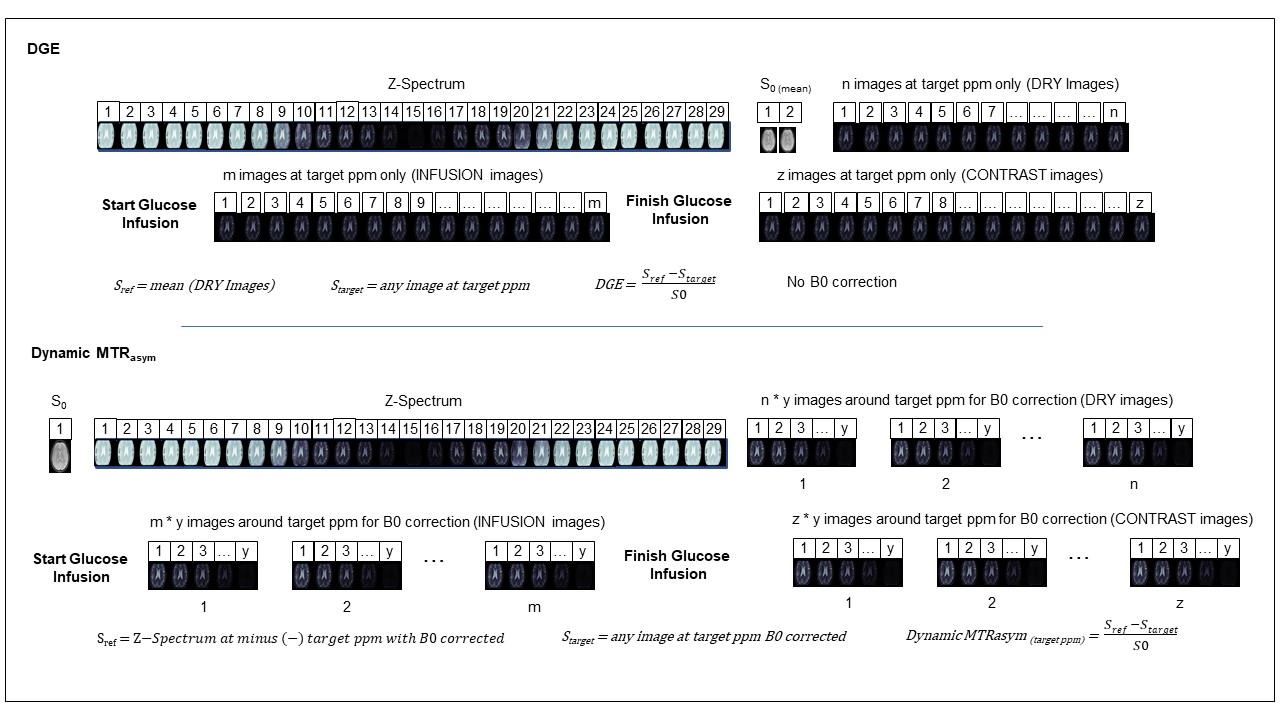
Figure 1: DGE Sequence Example vs Dynamic MTRasym.
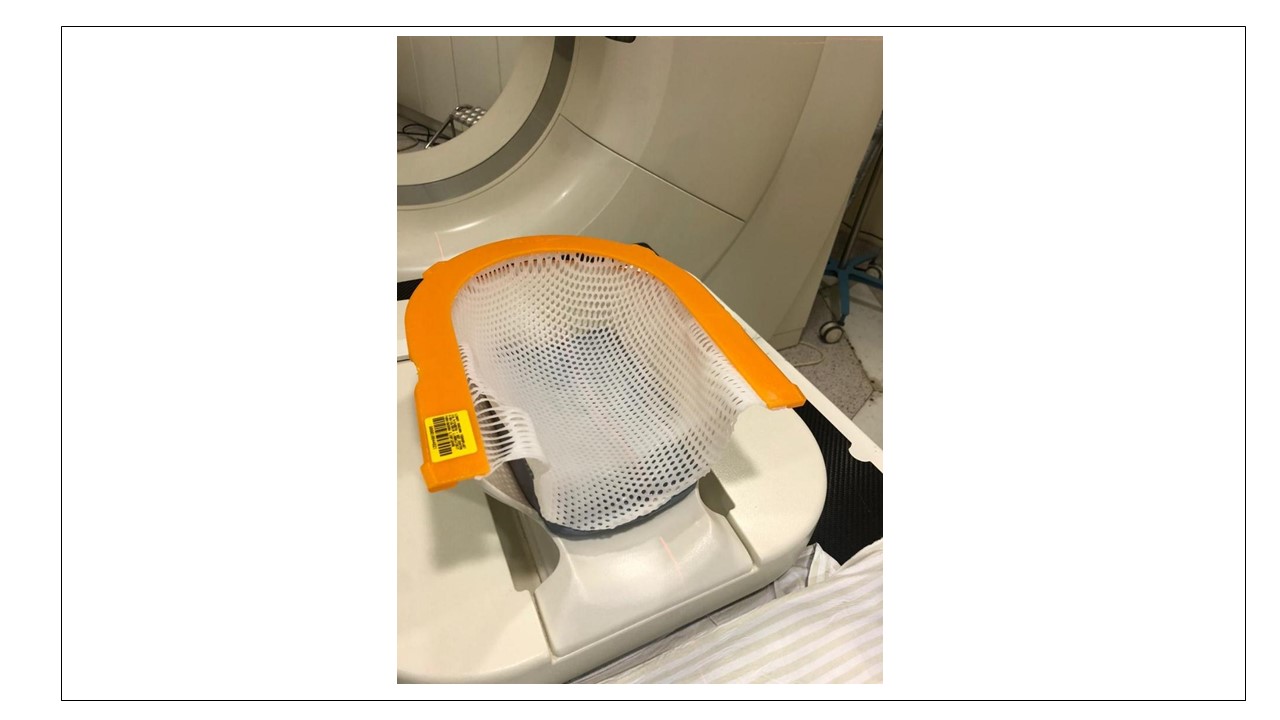
Figure 2: Thermoplastic mold used to restrict head movements.
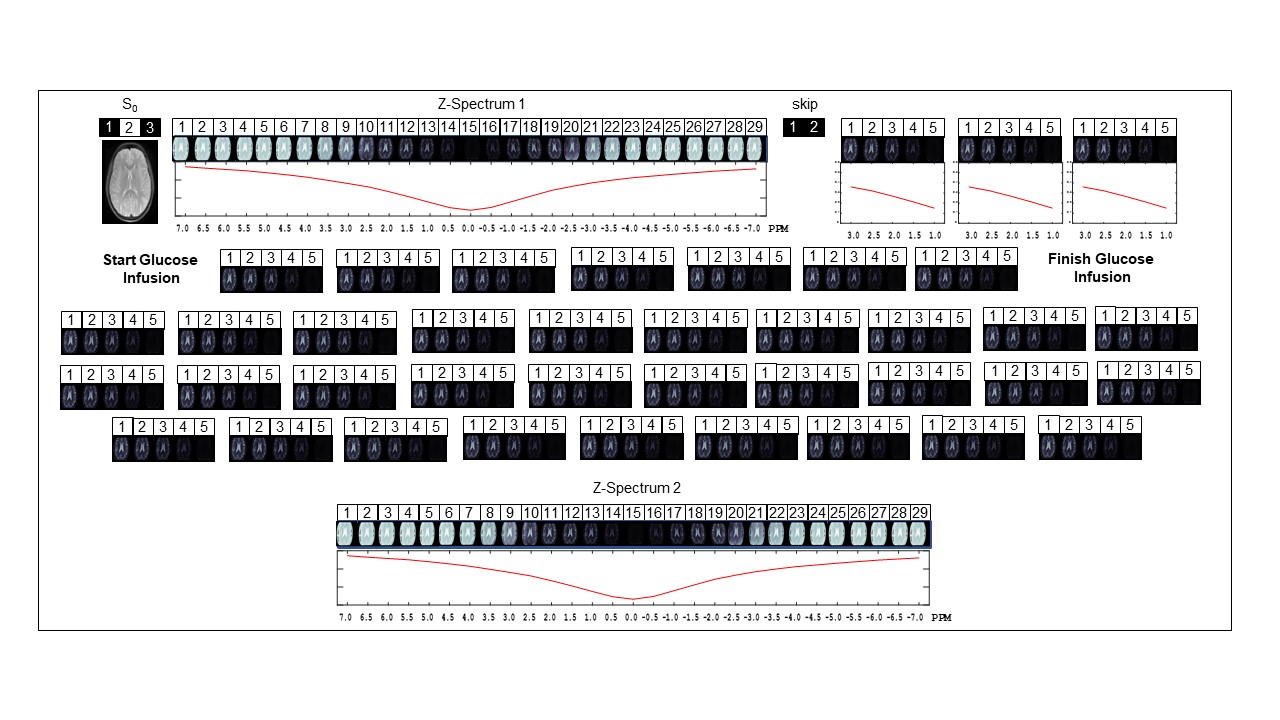
Figure 3: CEST sequence used, having 2 Z-Spectrum from +7 to -7 ppm and
39 block acquisitions from +3 to +1 ppm between the Z-Spectrums.
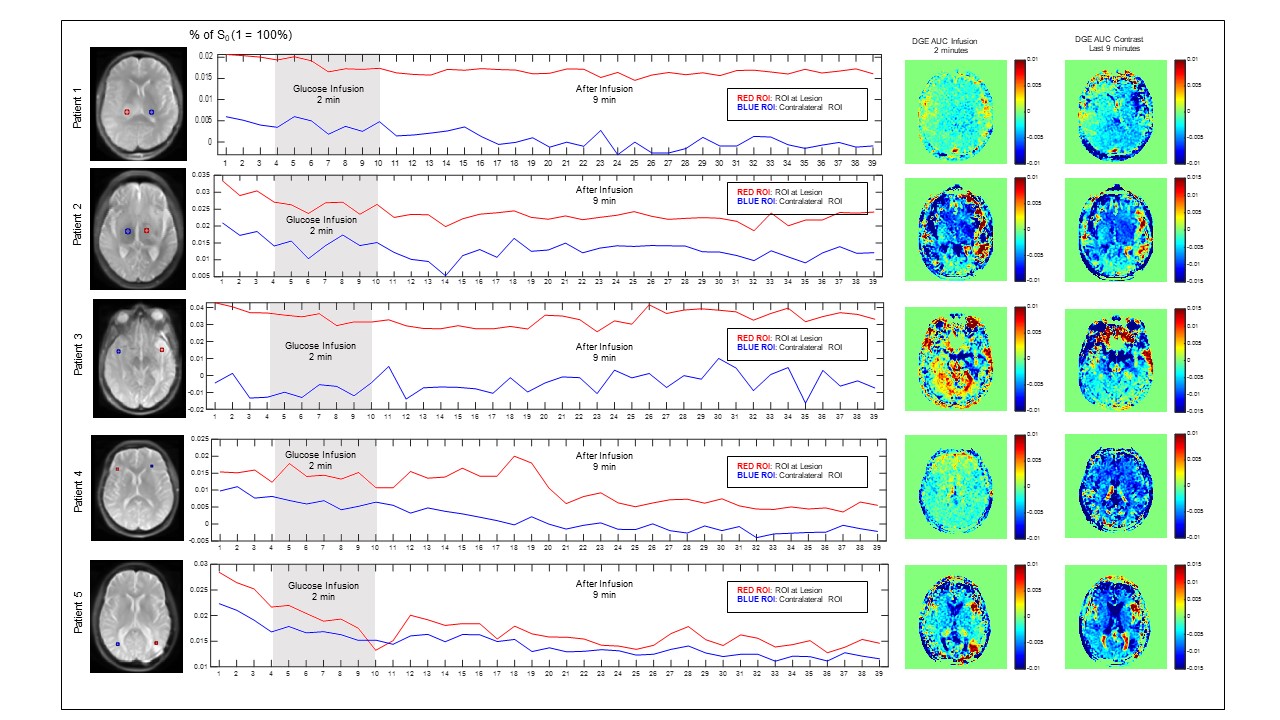
Figure 4: Dynamic MTRasym graph on 3 patients. Curves for red and blue ROIs may look similar but lesion ROIs start on a greater intensity as it is expected that lesion has more MTR asymmetry than normal tissue.
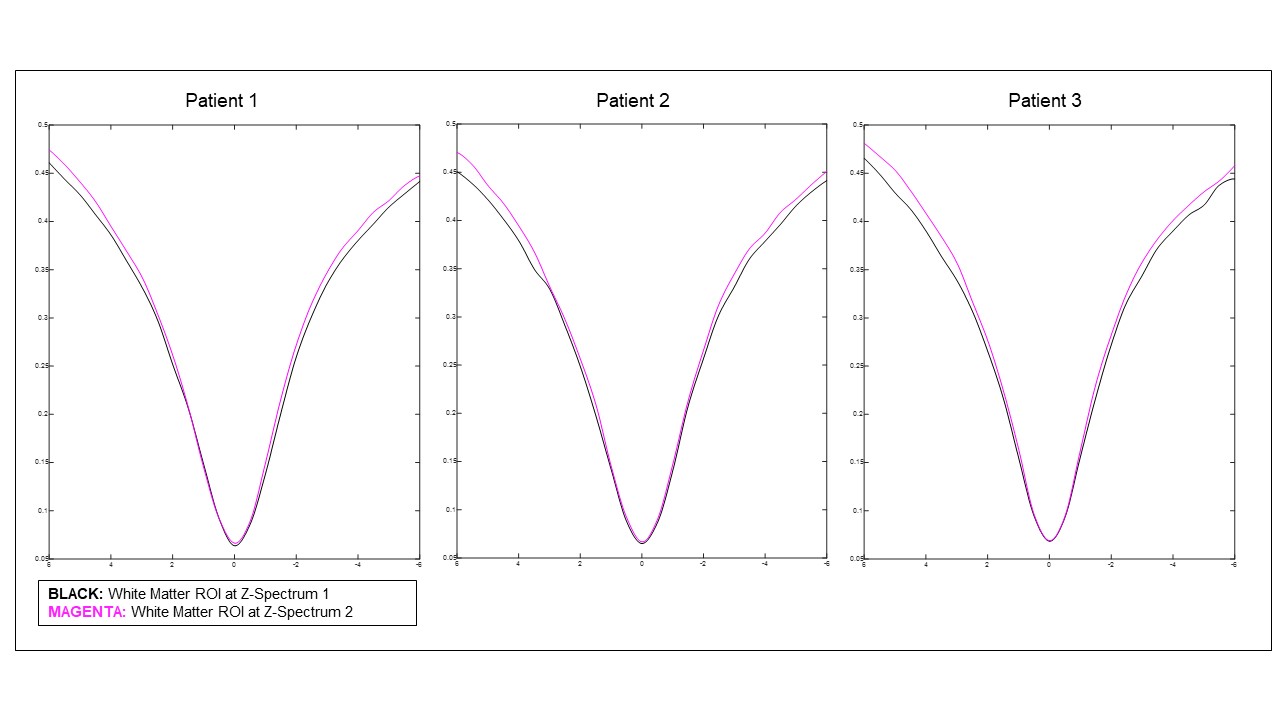
Figure 5: Z-Spectrum 1 and Z-Spectrum 2 on top of each other.
An unexpected signal increase was observed at the Z-Spectrum 2 after glucose infusion.