4423
Assignment of signal to cell type in MEMRI of the cerebellum1NINDS, NIH, Bethesda, MD, United States, 2Skirball Institute of Biomolecular Medicine, New York University School of Medicine, New York, NY, United States, 3Developmental Biology, Sloan Kettering Institute, New York, NY, United States, 4Research Operations, The Hospital for Sick Children, Toronto, ON, Canada
Synopsis
Manganese enhanced MRI (MEMRI) has been used to generate layer-specific contrast in preclinical neuroimaging studies, especially in the cerebellum. However, the cell types that contribute most to MEMRI signal have not yet been identified. In this study, we registered high resolution MEMRI to immunohistochemistry of the cerebellum to verify layer localization of signal. We found that the Purkinje cell layer (PCL) was the source of hyperintensity. Next, we manipulated cell types of the PCL using genetically engineered mouse models and quantified MEMRI signal changes. These results strongly suggest Purkinje cells are the primary cellular source of hyperintensity in cerebellar MEMRI.
Introduction
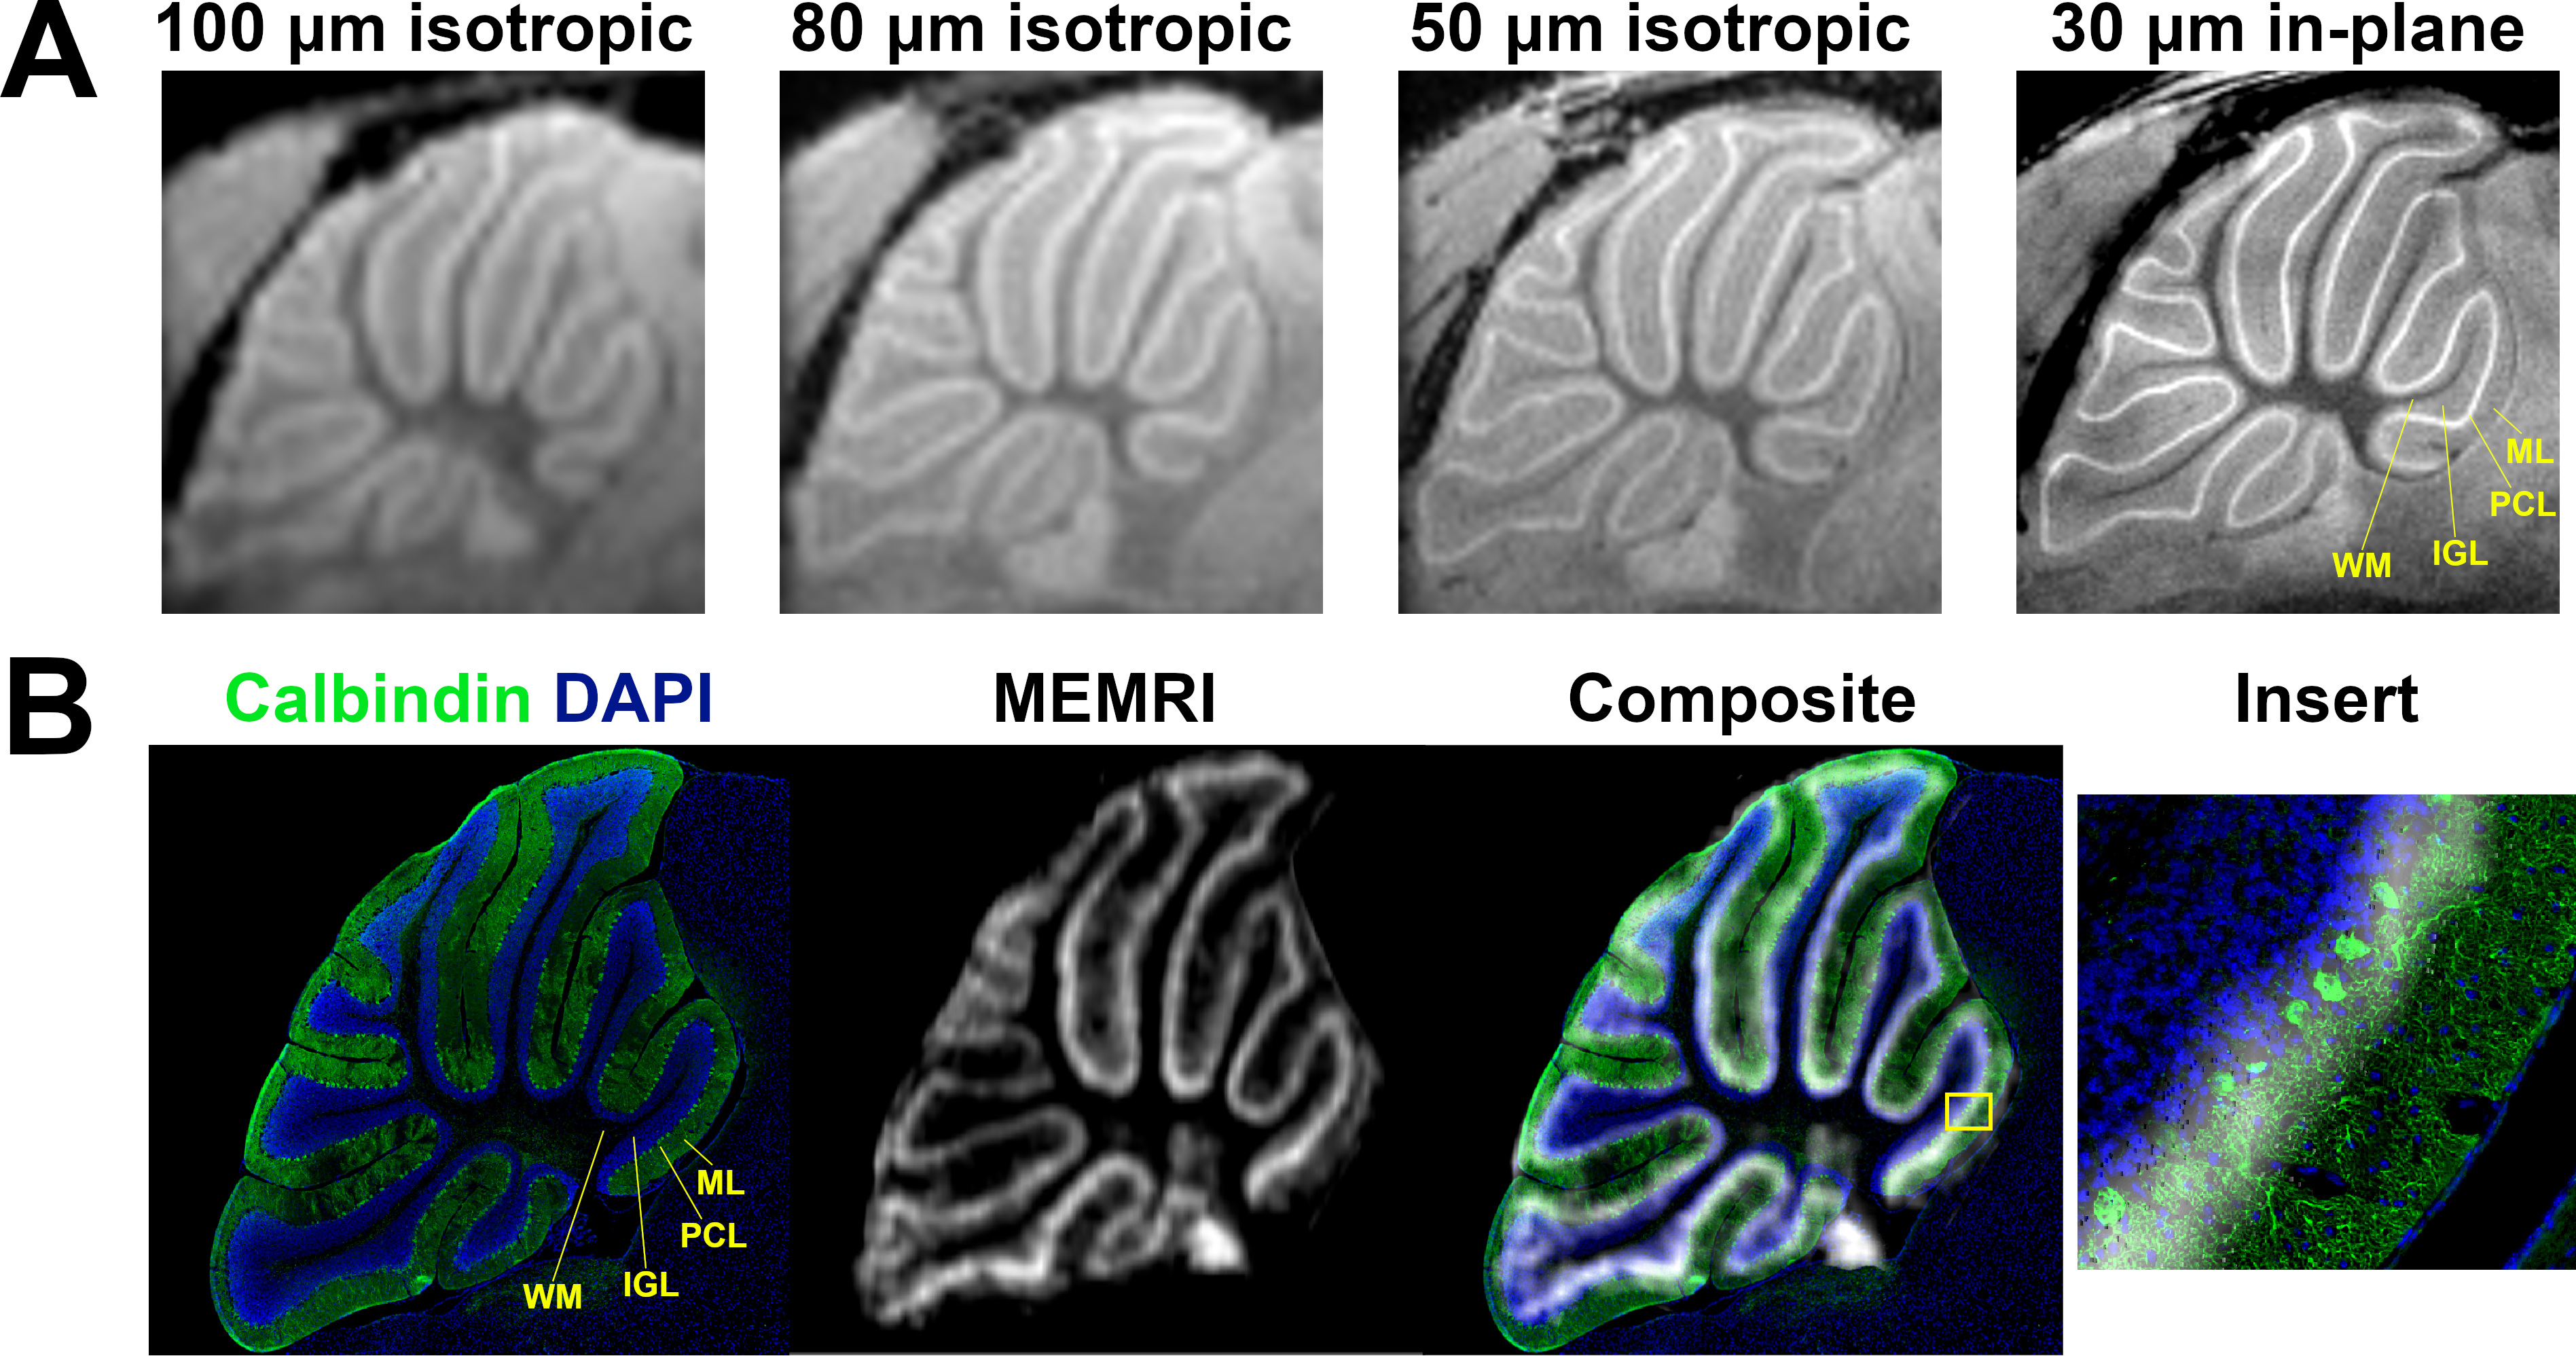
Manganese (Mn)-enhanced MRI (MEMRI) has been used in numerous studies of mouse cerebellum development and disease1–7. MEMRI produces layer-specific contrast enabling in vivo visualization of cerebellar morphology. Due to cerebellar geometry, 2D MEMRI images can be acquired with a relatively thick slice by averaging through areas of uniform cytoarchitecture to produce high-resolution (30 µm in-plane) visualization of the vermis in sagittal and horizontal planes8. Such images made apparent that MEMRI hyperintensity is centrally located in the cerebellar cortex and uniform in thickness throughout the vermis, suggesting that the Purkinje cell layer (PCL), which houses the cell bodies of the Purkinje cells (PC) and the Bergmann glia (BG), is the source of contrast. However, the cellular source of this signal within the PCL has not yet been determined. In this study, we quantified the effects of selective ablation of PC and BG populations on MEMRI signal to assign signal to cell type.Methods
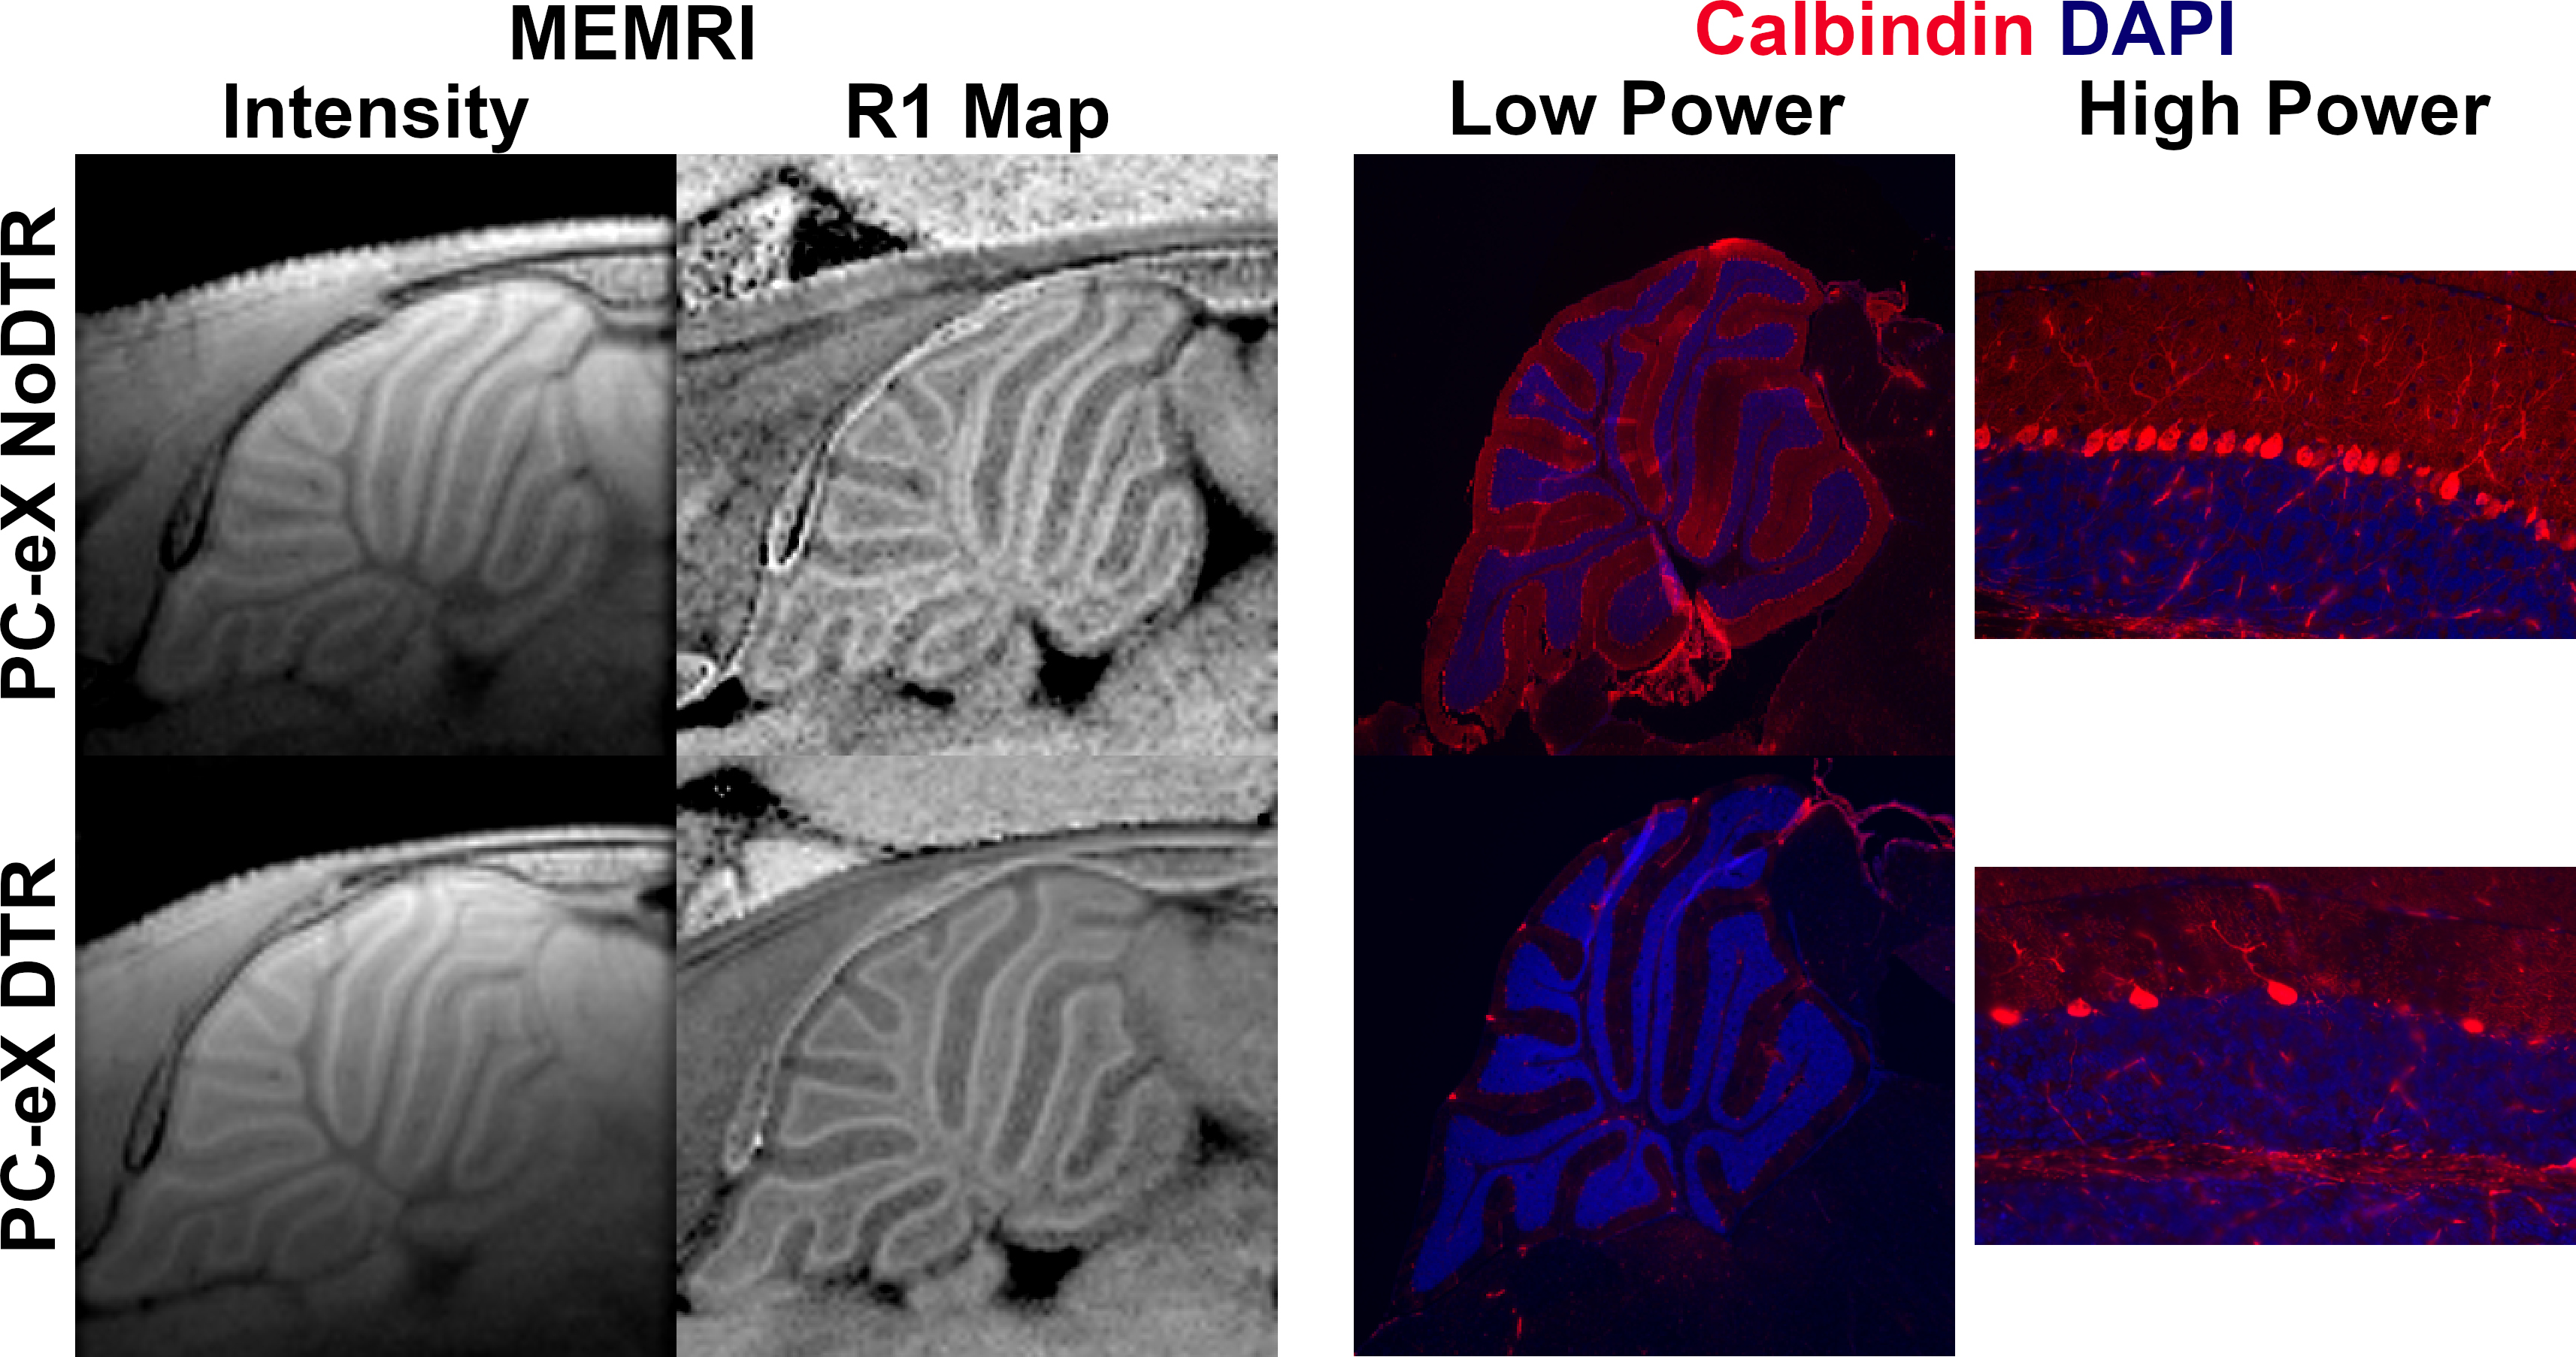
To quantify the effects of PC ablation on MEMRI signal, two mouse models were engineered to express the diphtheria toxin receptor (DTR) in relatively smaller (~30% of all PCs, PC-X)9 and larger (~50%, PC-eX) subpopulations of PCs. To quantify the effects of BG ablation on MEMRI signal, a mouse model was engineered to express DTR in a subpopulation of BGs (~50% of all BGs, BG-X). PC and BG ablation was performed at postnatal day (P)12 and P16, respectively via single intraperitoneal injection of 30 ng/g diphtheria toxin. Across all models, littermates negative for DTR were considered controls (NoDTR). Both sexes were used in this study. Manganese chloride tetrahydrate in isotonic saline was injected intraperitoneally 24 hours before each imaging session (MnCl2, 30mM, 60 mg/kg). General anesthesia was induced by 1.5% isoflurane in air. For R1 mapping experiments, MRI were performed between P21 and P24 on a Bruker 7 T micro-MRI system using a four-channel phased array cryogenically-cooled receive-only coil with a room temperature volume transmit coil (CryoProbe system, Bruker). Scan protocol included: low-resolution pilot; 50 µm in-plane resolution RARE-VTR sequence (TR = [4200, 2800, 1500, 800, 616] ms, Effective TE = [7, 21, 35, 49, 63] ms, RARE factor = 2, slice thickness = 1 mm); and 50 µm in-plane 2D T1-weighted, FLASH (Matrix = 200 x 200, FOV = 10.0 mm x 10.0 mm, slice thickness = 500 µm, TR = 40 ms, TE = 6 ms, NA = 120, FA = 42.5°). For multiple resolution MEMRI and registration to histology, MRI were performed on a 11.7 T animal MRI system (Magnex Scientific) using a CryoProbe system. Scan protocol included: 1 min low-resolution pilot; FLASH images at 100, 80, and 50 µm isotropic resolution; and 30 µm in-plane FLASH. Animals were transcardially perfused with cold paraformaldehyde and cryoprotected in 30% sucrose for histology. Analyses were performed in MIPAV, ImageJ, Python, GraphPad Prism, and R.Results
At lower resolution, the shape of hypointensity in the cerebellum correlated qualitatively with the white matter (WM). Hyperintensity morphologically correlated with the cerebellar cortex. At higher resolution, three bands of signal became apparent in the cerebellar cortex. Given this enhancement pattern, we hypothesized that the middle signal band correlated to the PCL and that the inner and outer signal bands correlated with the inner granule layer (IGL) and molecular layer (ML), respectively (Figure 1a). Registration of MEMRI to matched histology corroborated the colocalization of high signal MEMRI intensity with the Calbindin-stained PCs (green) (Figure 1b). Layer-wise comparison to control of 50 µm in-plane resolution R1 mapping data and histology from mouse models of PCL ablation potentiates assignment of signal to cell type (Figure 2). With respect to BG-X NoDTR animals, there were no significant differences in R1 measured in any layer of PC-X NoDTR and PC-eX NoDTR animals. For PC-X animals, a significant reduction of PC density was observed (28.5% reduction, p<0.03). No significant differences in R1 were observed in the IGL, ML, nor WM. A significant reduction in R1 was observed in the PCL (estimated difference = 0.073 s-1, 7.13%, std. error = 0.026, p<0.01). For PC-eX animals, a significant reduction in PC density was observed (54%, p<0.0001). As in the PC-X model, no significant differences in R1 were observed in the IGL, ML, nor WM. A significant reduction in R1 was observed in the PCL (estimated difference = 0.096 s-1, 9.82%, std. error = 0.026, p<0.001). For BG-X animals, a significant reduction in BG density was observed (~50%, p=0.004). However, no significant differences in R1 were observed in any layer (Figure 3). It should be noted that the quantitative mapping results presented are not normalized to measurements made in animals without Mn exposure. These experiments are in progress and will allow accounting for Mn-specific changes more accurately.Conclusion
Taken together, these results strongly suggest that PCs are the primary cellular source of hyperintensity in cerebellar MEMRI. Assignment in this way motivates interpretation of MEMRI as a cell type-sensitive preclinical neuroimaging modality. Natural extension of this work involves alignment to, and manipulation of, other MEMRI hyperintense cytoarchitecture (e.g. the hippocampus, olfactory bulb). In addition to identification, it will be possible to screen these candidates for a mechanistic understanding of Mn uptake and sequestration.Acknowledgements
No acknowledgement found.References
1. Suero-Abreu, G. A. et al. In vivo Mn-enhanced MRI for early tumor detection and growth rate analysis in a mouse medulloblastoma model. Neoplasia (New York, N.Y.) 16, 993–1006 (2014).
2. Rallapalli, H., Darwin, B. C., Toro-Montoya, E., Lerch, J. P. & Turnbull, D. H. Longitudinal MEMRI analysis of brain phenotypes in a mouse model of Niemann-Pick Type C disease. NeuroImage 217, 116894 (2020).
3. Rallapalli, H. et al. MEMRI-based imaging pipeline for guiding preclinical studies in mouse models of sporadic medulloblastoma. Magnetic Resonance in Medicine 83, (2020).
4. Tan, I.-L. et al. Lateral cerebellum is preferentially sensitive to high sonic hedgehog signaling and medulloblastoma formation. Proceedings of the National Academy of Sciences of the United States of America 115, 3392–3397 (2018).
5. Szulc, K. U. et al. MRI analysis of cerebellar and vestibular developmental phenotypes in Gbx2 conditional knockout mice. Magnetic Resonance in Medicine 70, 1707–1717 (2013).
6. Szulc, K. U. et al. 4D MEMRI atlas of neonatal FVB/N mouse brain development. NeuroImage 118, 49–62 (2015).
7. Wadghiri, Y. Z. et al. Manganese-enhanced magnetic resonance imaging (MEMRI) of mouse brain development. NMR in Biomedicine vol. 17 613–619 (2004).
8. Watanabe, T., Frahm, J. & Michaelis, T. Cell layers and neuropil: contrast-enhanced MRI of mouse brain in vivo. NMR in biomedicine 26, 1870–8 (2013).
9. Sumru Bayin, N. et al. Age-dependent dormant resident progenitors are stimulated by injury to regenerate Purkinje neurons. (2018) doi:10.7554/eLife.39879.001.
Figures
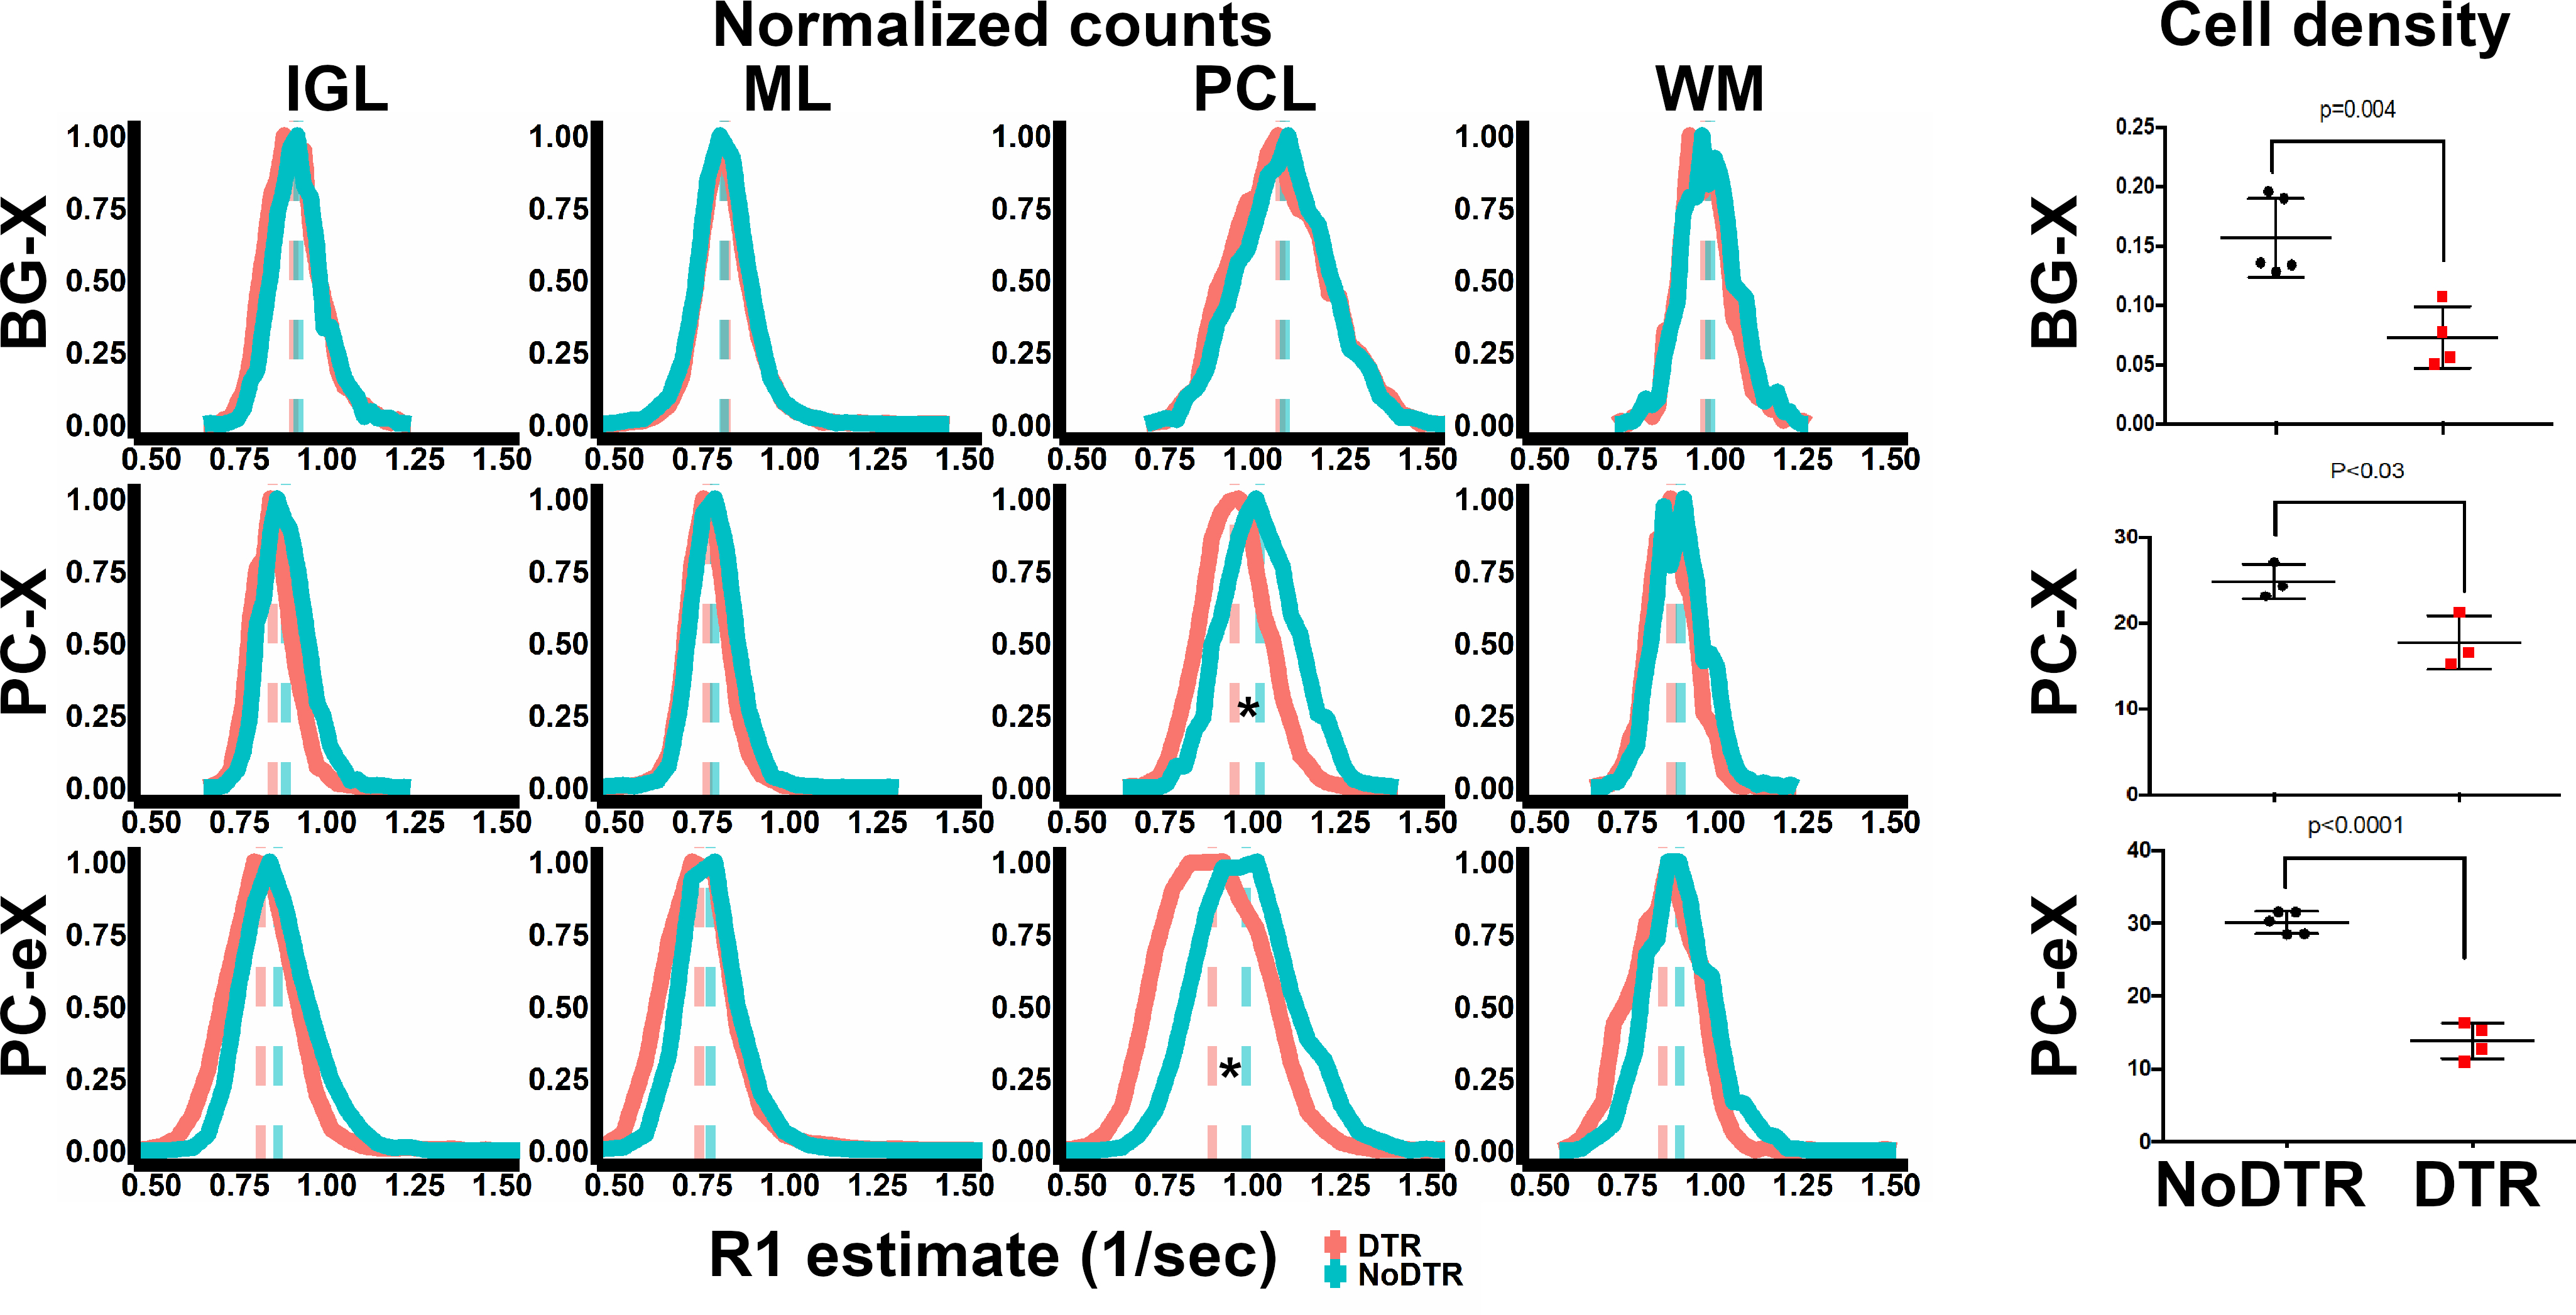
Analyses of quantitative data indicate cell type-specificity in MEMRI signal. Across all layers, there were no significant differences in estimated R1 between BG-X DTR (red, n = 4) and NoDTR (blue, n = 5) animals. Significant differences in PCL R1 between PC-X DTR (n = 7) and NoDTR (n = 5) were observed. Similarly, significant differences in PCL R1 between PC-eX DTR (n = 7) and NoDTR (n = 5) were observed. * = p < 0.05
Cell kill analysis of Calbindin and Sox2 IHC showed significant density reductions in DTR animals across all models. These results implicate PCs as the primary source of MEMRI signal