4422
Investigation of neurovascular coupling to cannabinoid 1 receptor occupancy: a simultaneous PET/fMRI study on non-human primates1Athinoula A. Martinos Center for Biomedical Imaging, Department of Radiology, Massachusetts General Hospital, Harvard Medical School, Charlestown, MA, United States
Synopsis
The goal of this study was to investigate relationship between hemodynamic responses and underlying neurochemistry targeting cannabinoid receptor 1 (CB1R) in response to the injection of rimonabant in non-human primates using simultaneous positron emission tomography (PET) and function magnetic resonance imaging (fMRI). Following the rimonabant injection, fast and slow hemodynamic responses were identified throughout the brain. The CB1R occupancy estimates suggested that the radiotracer binding to CB1R was blocked by rimonabant highly in cerebellum and several brain regions. Future PET/fMRI studies with other CB1R-agonists/antagonists and more accurate occupancy estimates will provide further understanding about neurovascular coupling to CB1R.
Introduction
Simultaneous acquisition of magnetic resonance image (MRI) and positron emission tomography (PET) has been used to provide novel insight into brain function.1 Especially, by utilizing the complementary measures of function MRI (fMRI) and PET, the molecular basis of the fMRI signal changes evoked by an injection of ligands for target neuroreceptors can be investigated.2 Cannabinoids have been used for its potential therapeutic and medicinal properties such as modulation of the processes of pain, whose effects are mediated by cannabinoid receptor 1 (CB1R) and 2.3 Despite its potential as a novel treatment target, cannabis cause negative health implications, such as cachexia, nausea/vomiting, and spasticity.3 These complicated nature of cannabinoids highlights deeper understanding of how cannabinoids act in the brain as important research targets for future development of therapeutically viable cannabinoid-based drugs. To the best of our knowledge, functional measures of the brain while modulating CB1R occupancy has not been compared. The goal of this study was to investigate relationship between hemodynamic responses and underlying neurochemistry, as measured by changes in receptor occupancy, in response to the injection of rimonabant (CB1R inverse agonist) in NHPs.Materials and Methods
PET and MRI image of the NHP brain (n = 2) were acquired with a 3T Siemens TIM-Trio with a BrainPET insert using a custom 8-channel array coil. A high-resolution anatomical scan was obtained by using multi-echo MPRAGE sequence (TR = 2530 ms, TE1/TE2/TE3/TE4 = 1.64/3.5/5.36/7.22 ms, TI = 1200 ms, flip angle = 7°, and 1 mm isotropic). To improve sensitivity of fMRI, ferumoxytol was employed to measure cerebral blood volume (CBV)-weighted fMRI was used. Functional scan using multislice echo-planar imaging sequence (TR = 3000 ms, TE = 22 ms, flip angle = 90°, and 1.3 mm isotropic) was acquired for ~110 min with rimonabant (1 and 3 mg/kg) injection during the fMRI scan. Dynamic PET data were acquired from the NHPs using the predetermined bolus-plus-infusion (BI) protocol with bolus injection of ~250 MBq, constant infusion of ~160 MBq of [11C]OMAR radiotracer and stored in list mode for 100 min. Functional MR images were motion corrected, brain extracted, and affine registered to the INIA19 template.4 To calculate the percentage CBV change (%CBV), a baseline functional scan of ~5 min was separately acquired when ferumoxytol was administered intravenously at 10 mg/kg. The anatomical MRI was masked by a PET-derived binary mask of body contour, bias-corrected and intensity-normalized, and brain extracted. The dynamic PET images were reconstructed using the 3D-OSEM algorithm into the identical intervals with detector efficiency, decay, dead time, AC, and scatter corrections. Reconstructed PET image was registered to INIA19 template using the preprocessed anatomical MR image. For a region-based comparison, 17 gray matter, 1 cerebellum, 1 white matter, 1 whole brain regions of interest (ROIs) obtained from the INIA19 template. For the region-, and voxel-based analysis of fMRI, the %CBV change map was calculated using the GLM toolbox of the Fastmap software, as described in the previous studies.5,6 To assess the CB1R occupancy, the percentage occupancy (%Occ) map was calculated by dividing the difference between average uptake of before (0-40 min) and after challenge (60-100 min) by that of the average uptake of before challenge.Results
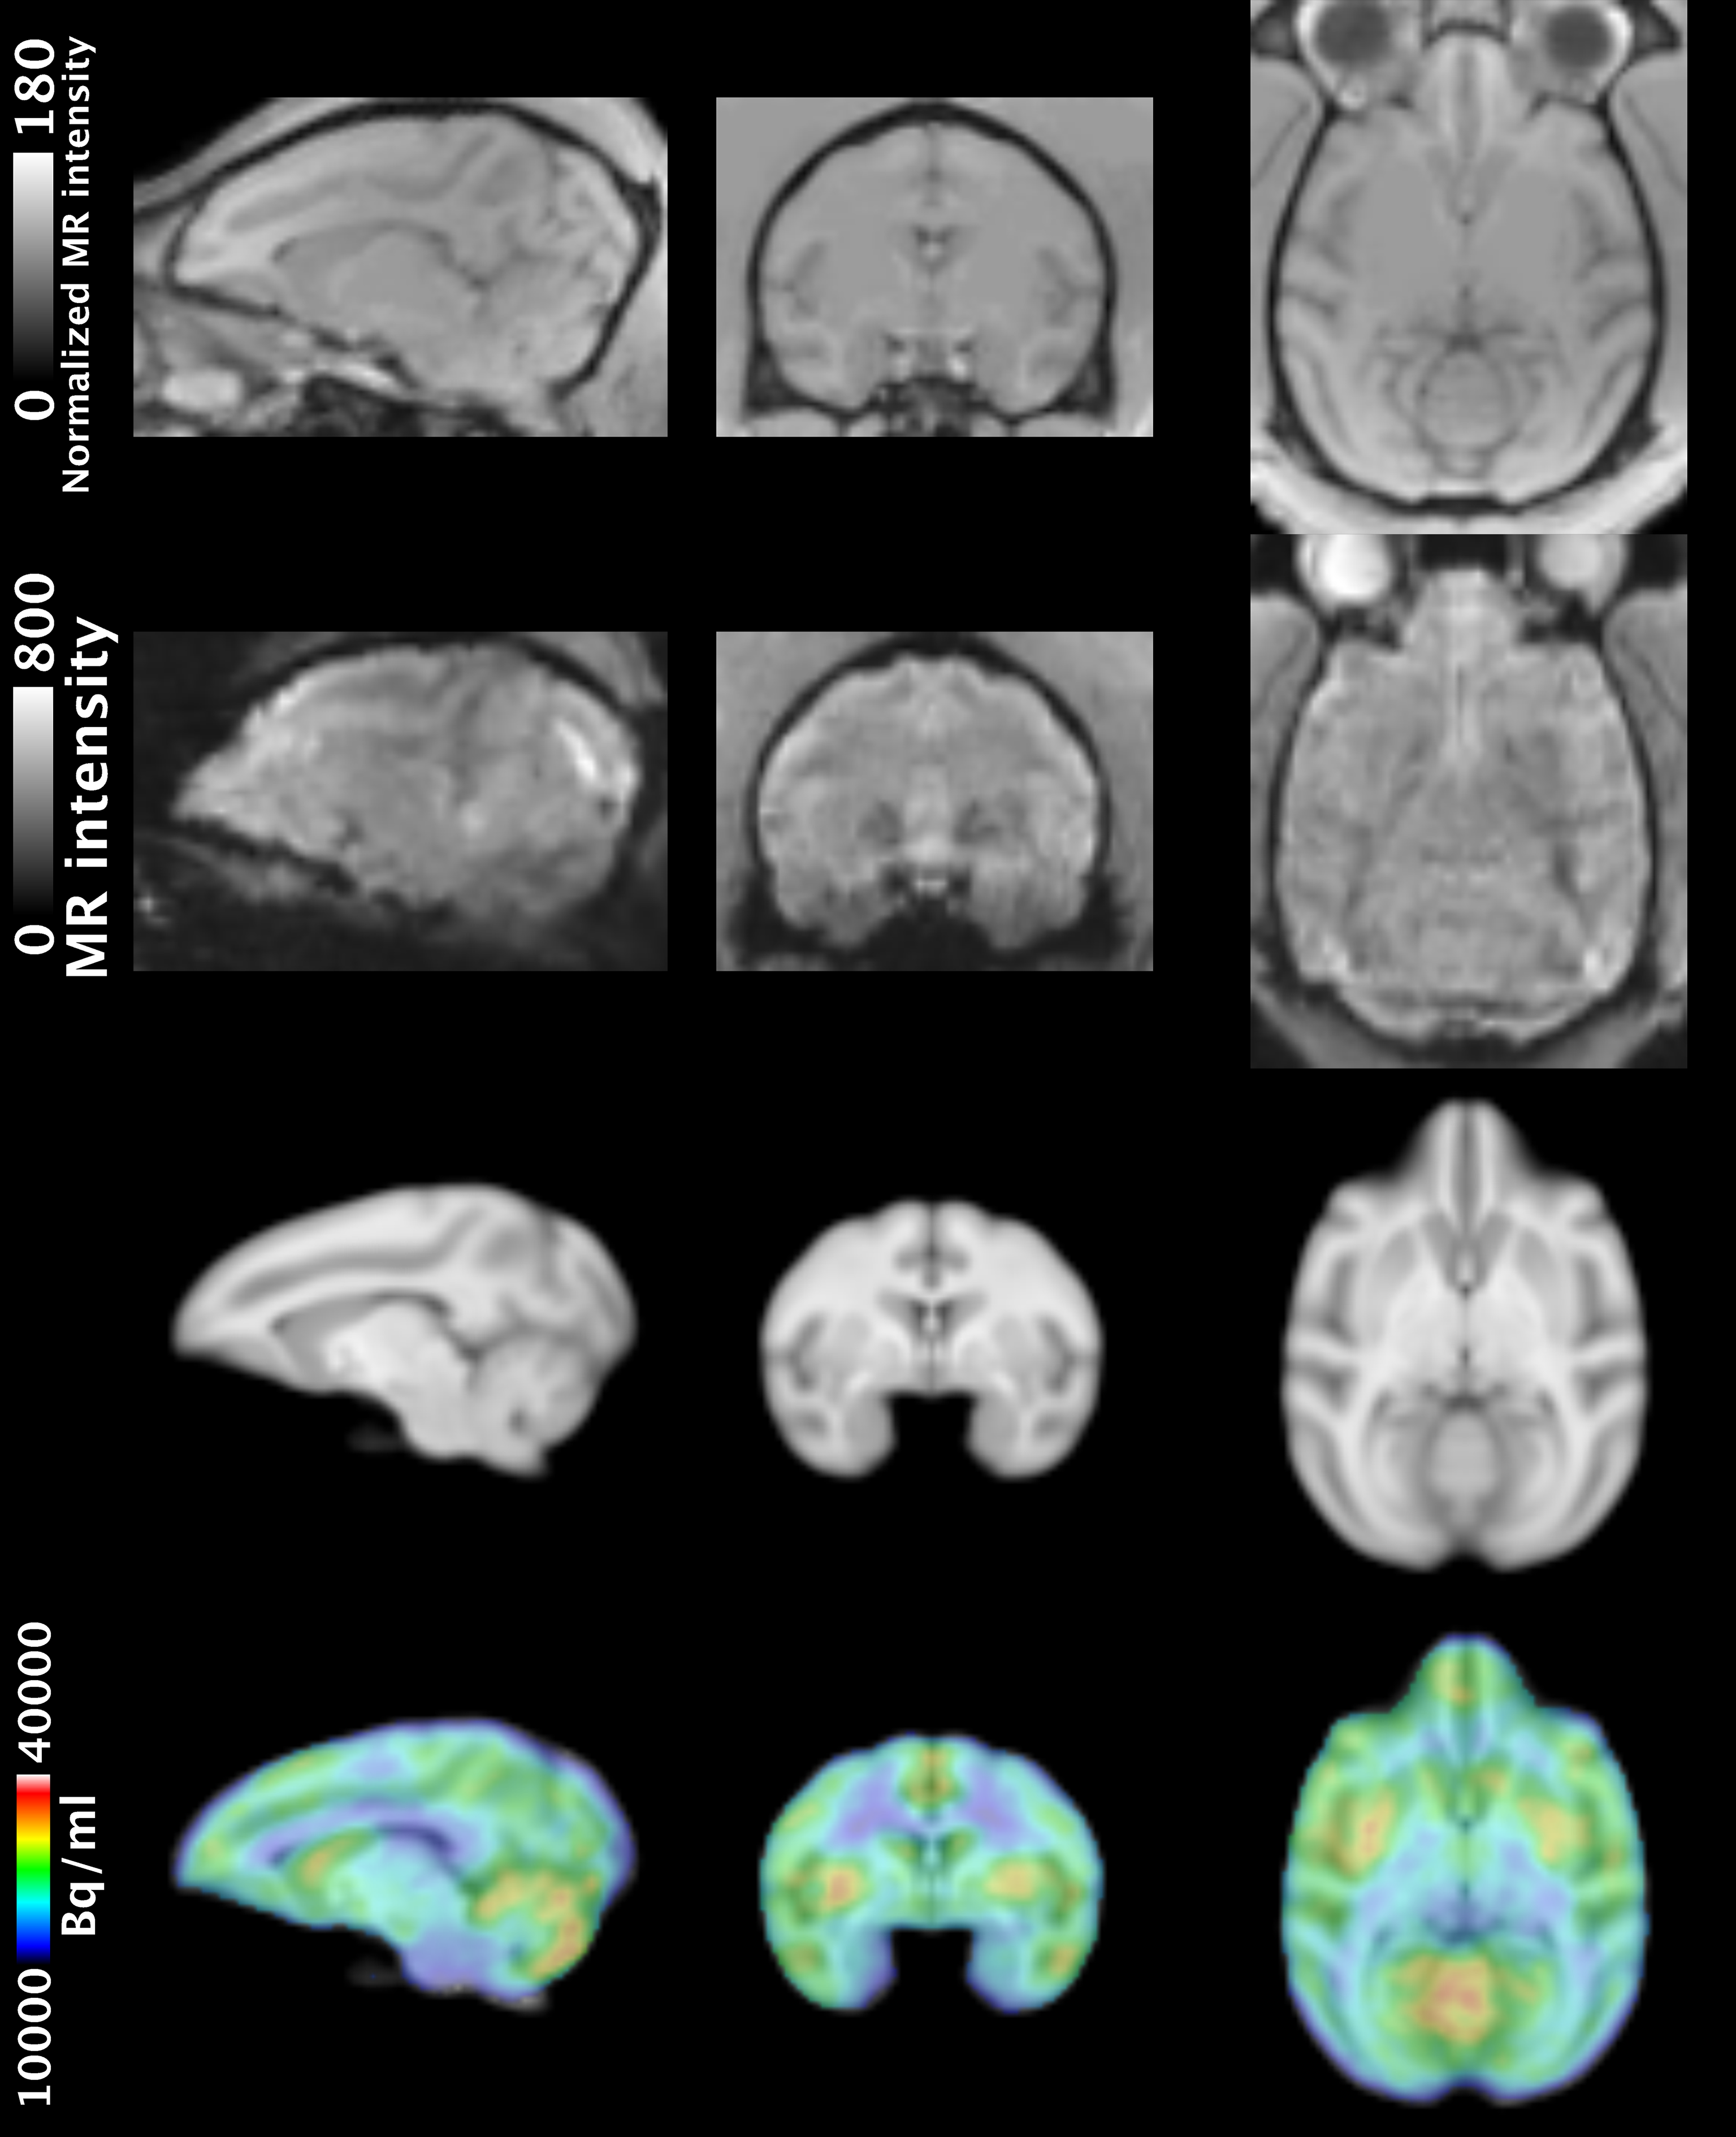
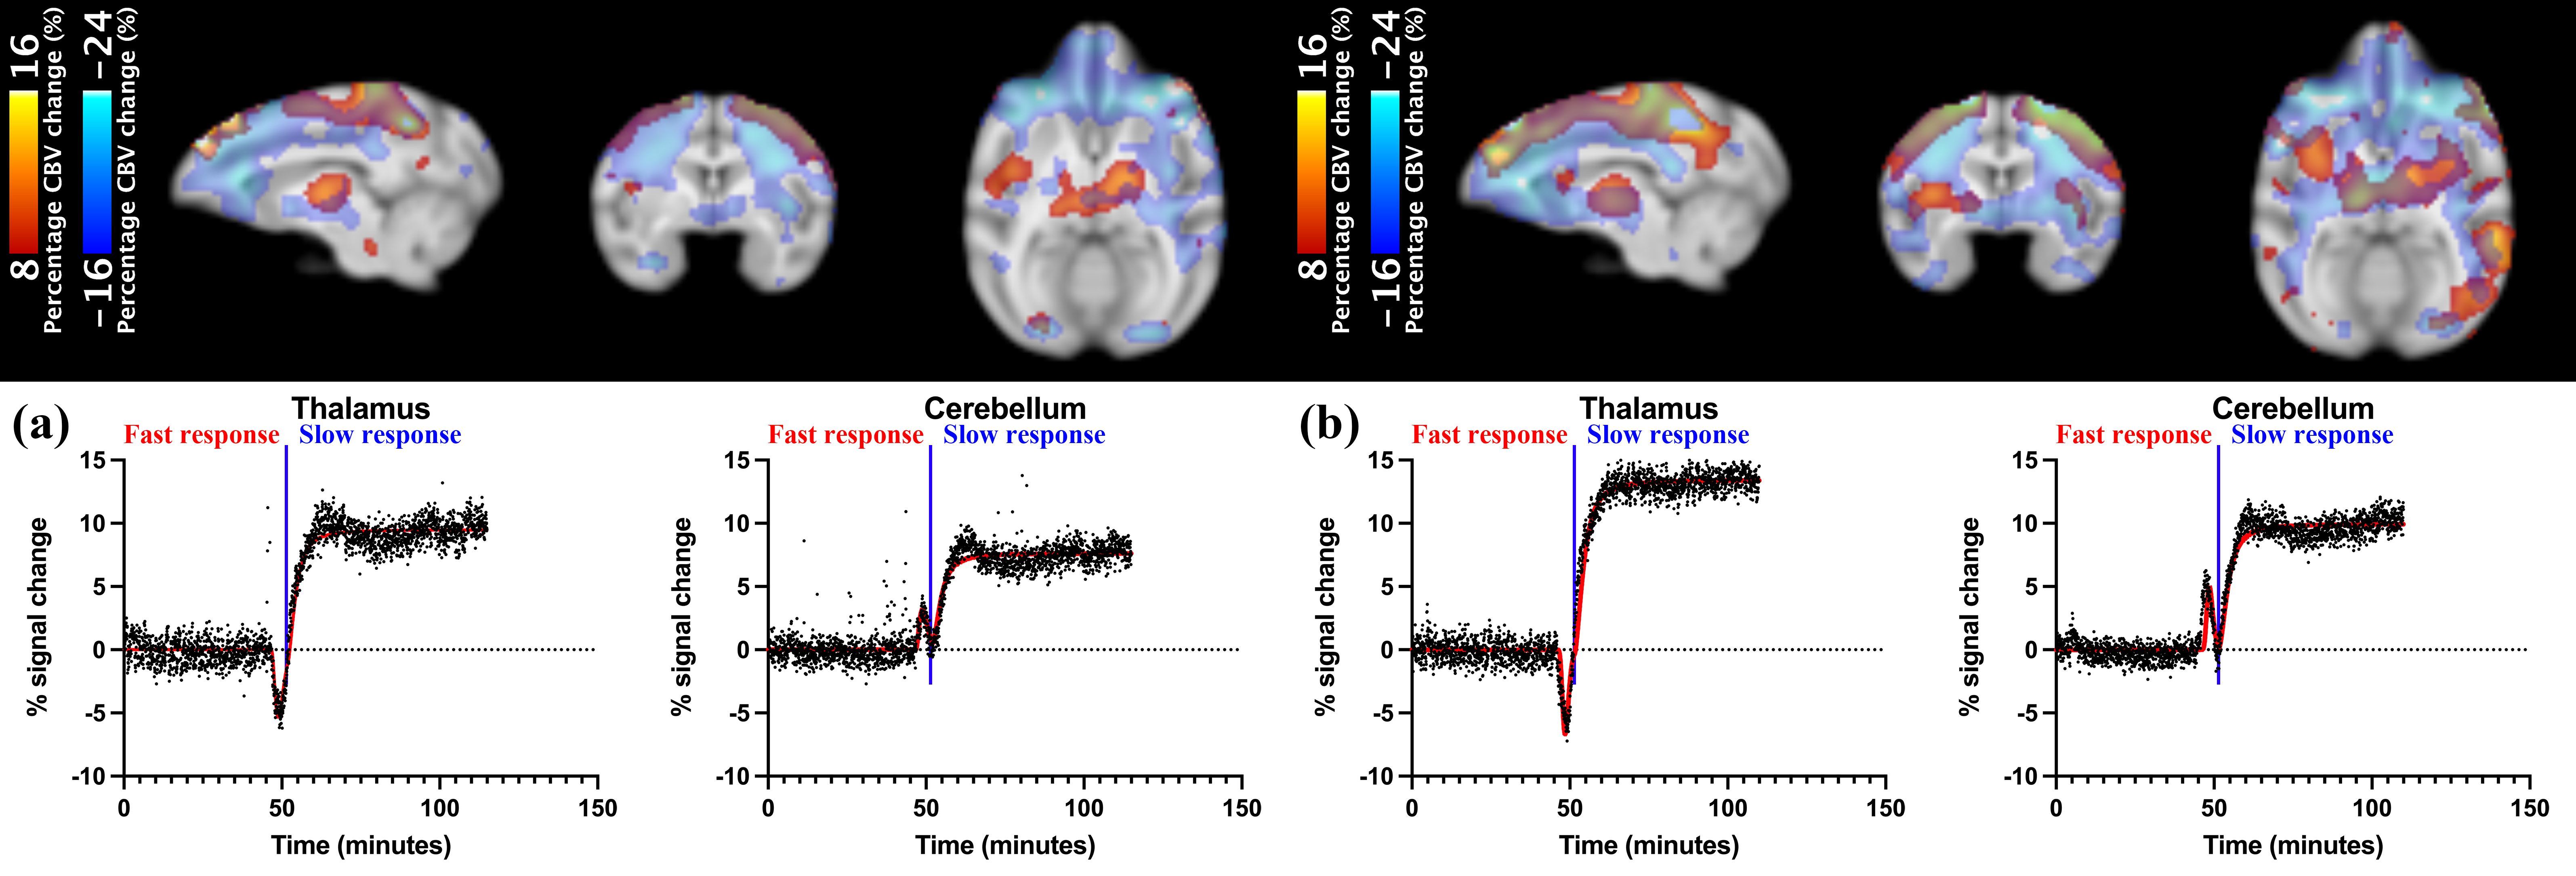
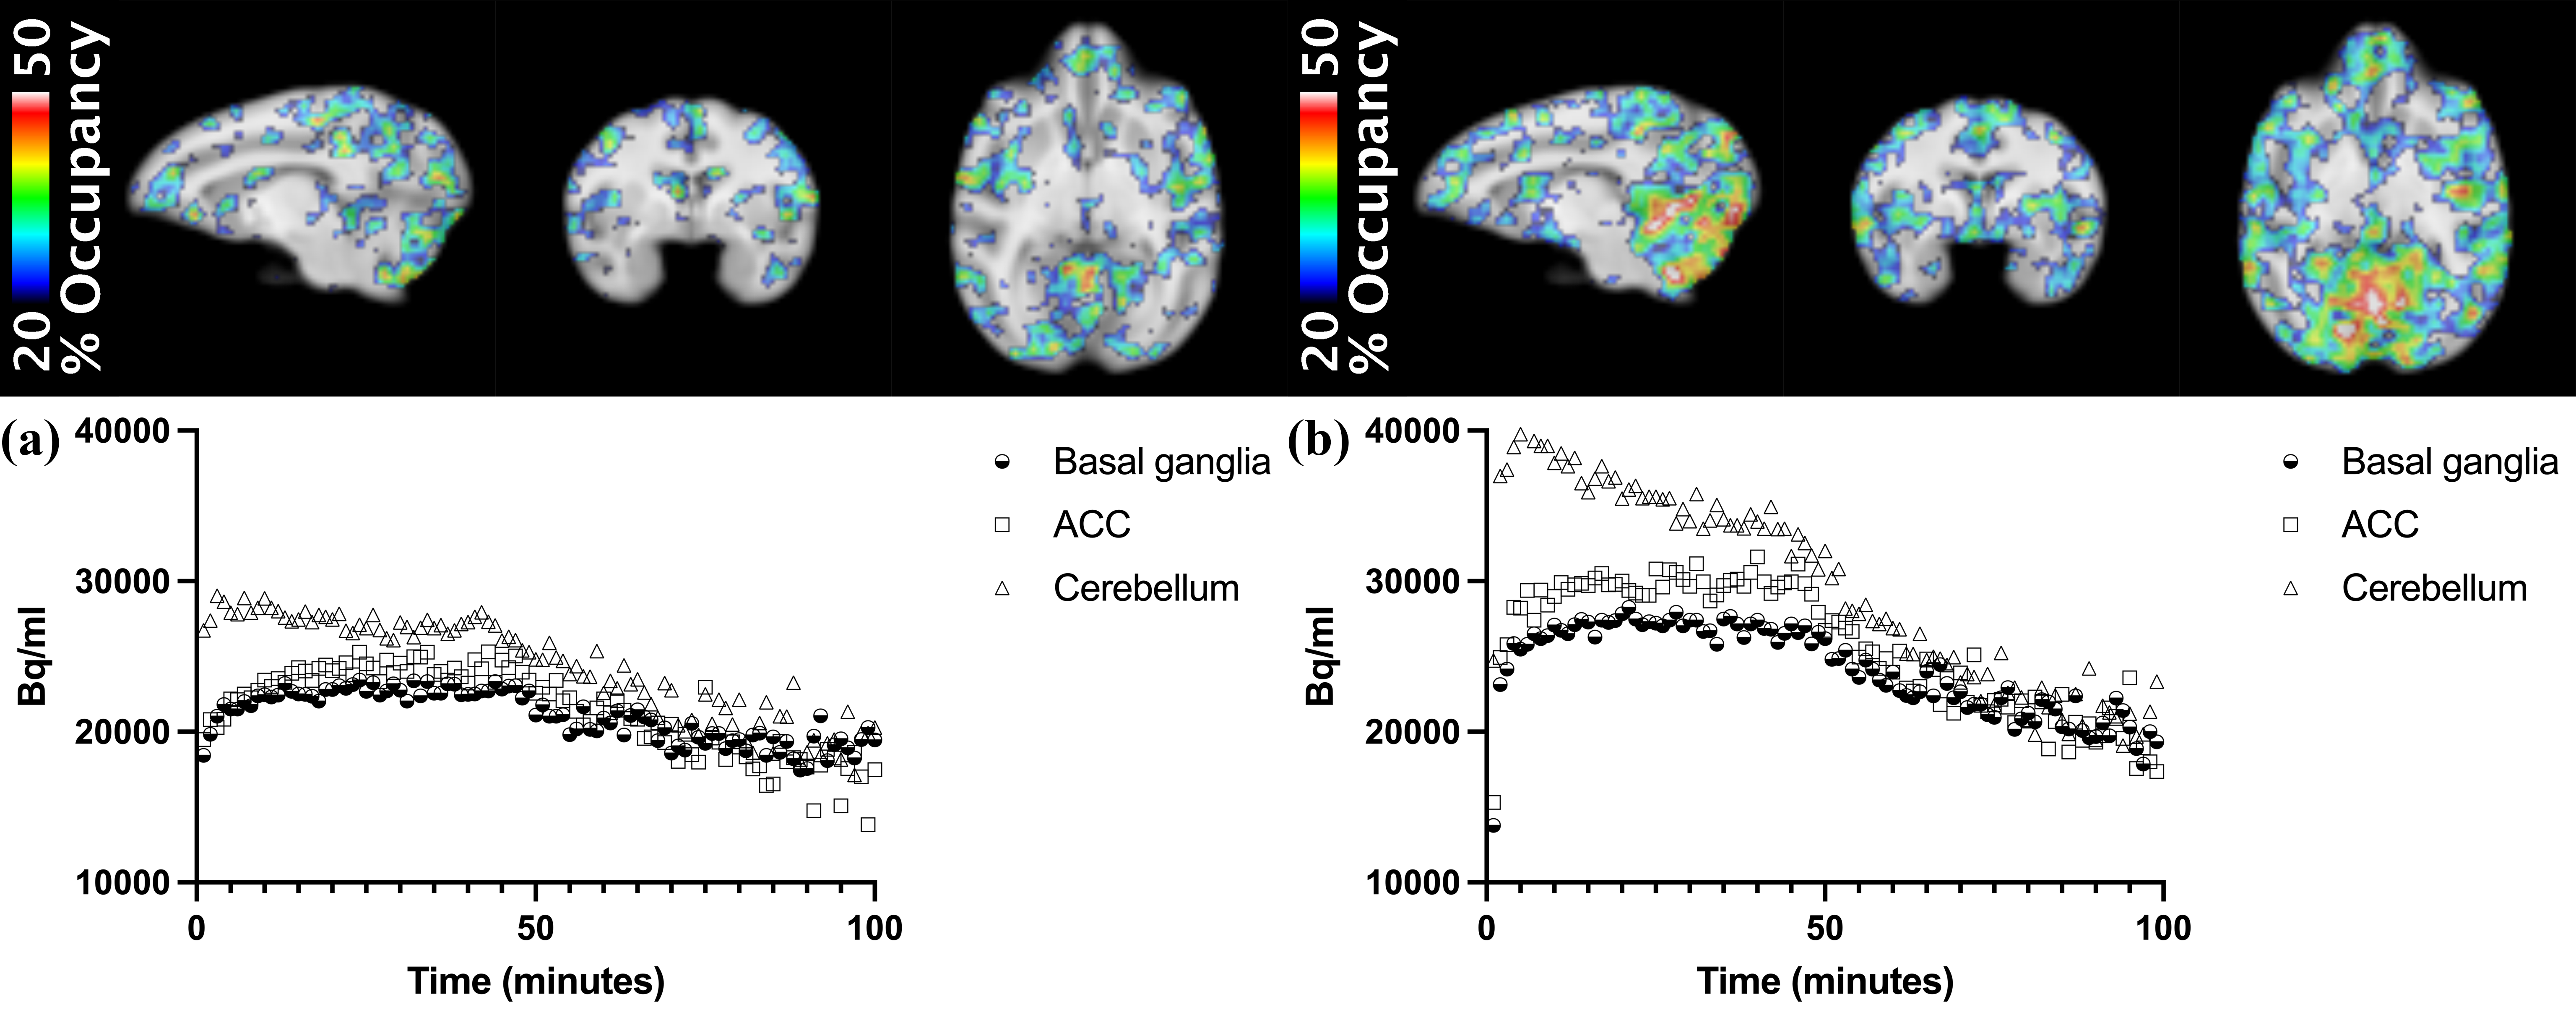
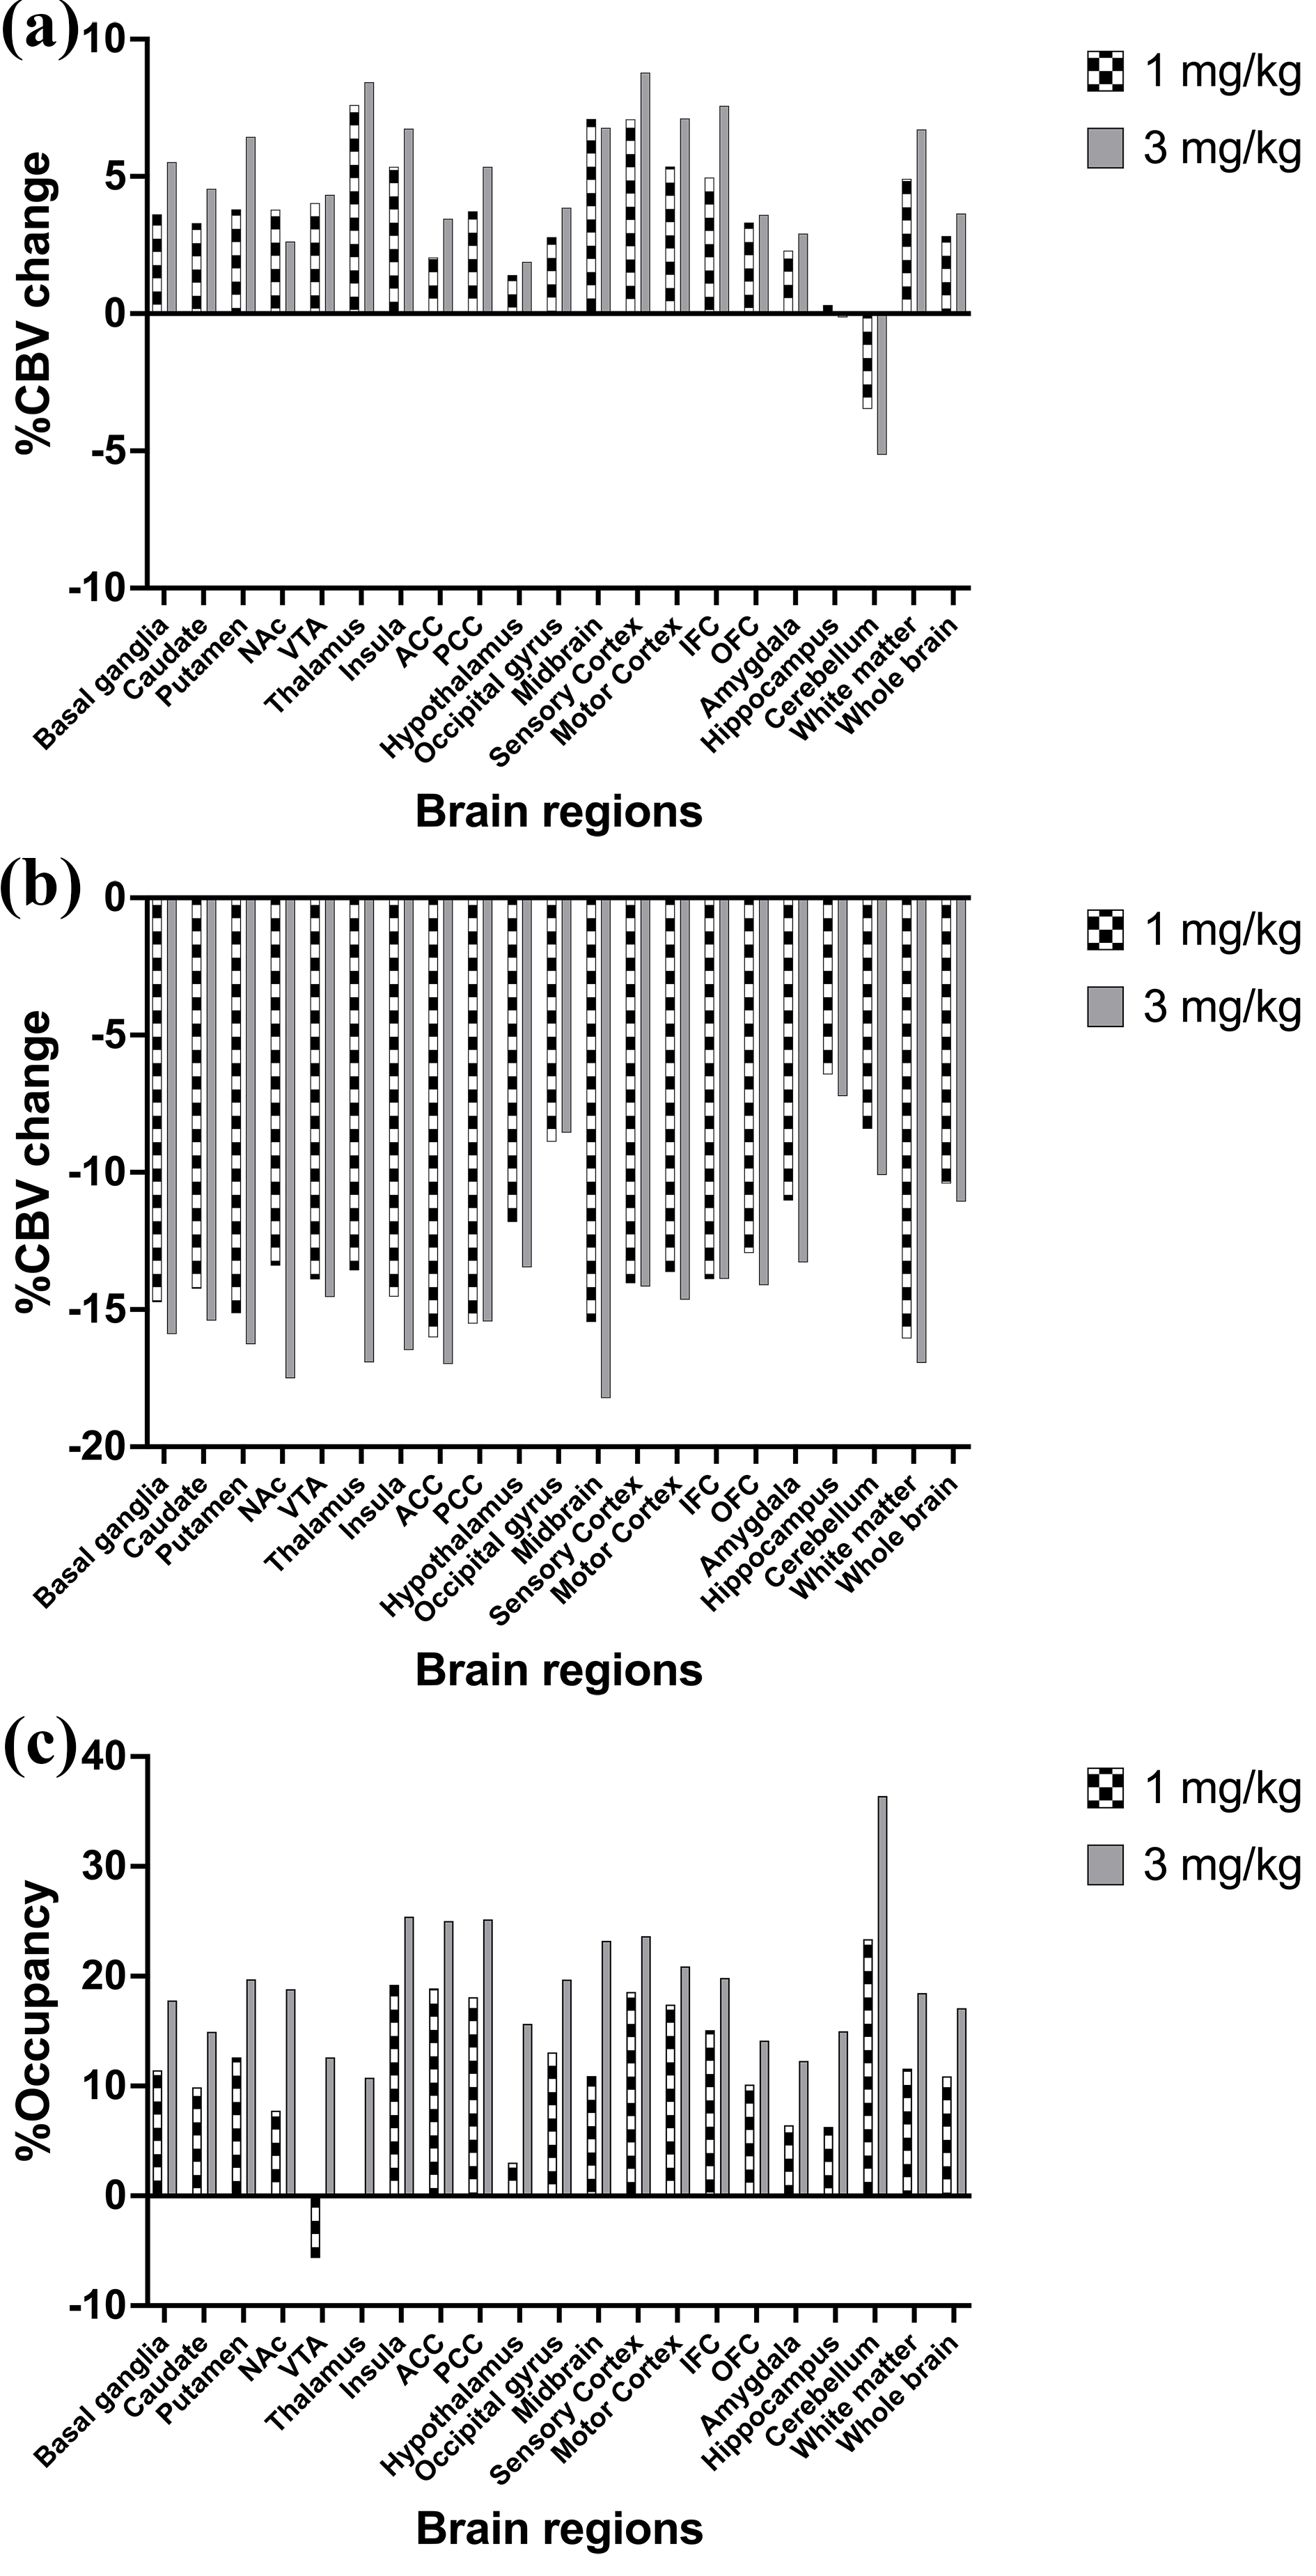
Figure 1 illustrates representative anatomical and baseline fMR images and the INIA19 template used in this study, and PET image overlaid with the template. Figure 2 shows the %CBV change maps and time-courses of the percentage fMRI signal change (drift corrected) from two representative ROIs from the NHPs after injecting (a) 1 mg/kg and (b) 3 mg/kg of rimonabant. Figure 3 demonstrates the %Occ maps and time-courses of the PET signal change induced by (a) 1 mg/kg and (b) 3 mg/kg of rimonabant. The summary of region-based analysis of the %CBV change fitted by the (a) fast and (b) slow response, and (c) %Occ for all ROIs was listed in Figure 4.Discussion and Conclusion
In this study, we compared the hemodynamic responses and CB1R occupancy in the NHP brains following the rimonabant injection, spatially and temporally using simultaneous PET/fMRI. Following the rimonabant injection, fast and slow hemodynamic responses were identified from the fMRI signal change throughout the brain. The %CBV change maps were computed by using these fast and slow response regressors. Excepting cerebellum, initial short increase of %CBV was followed by long decrease of %CBV. Interestingly, cerebellum showed opposite %CBV change for the fast response. After the challenge, the PET uptake began to decrease most obviously in cerebellum. The CB1R occupancy estimates showed that the radiotracer binding to CB1R was blocked by rimonabant highly in cerebellum and several brain regions. By comparing the %CBV change and %Occ, we found interesting results that the %CBV change and %Occ are inconsistent in thalamus, and cerebellum, showing the highest CB1R occupancy, had opposite %CBV change compared to other regions of brain for the fast response. Few limitations of this study, such as only single antagonist was used or the occupancy was not estimated from the binding potential, hindered further explanation of these observations. However, future PET/fMRI studies with other CB1R agonists/antagonists with different dose and more accurate occupancy estimates using the binding potential are expected to provide further understanding.Acknowledgements
No acknowledgement found.References
- Quick HH. Integrated PET/MR. J Magn Reson Imaging. 2014;39(2):243-58. doi: 10.1002/jmri.24523.
- Sander CY, Hooker JM, Catana C, Normandin MD, Alpert NM, Knudsen GM, Vanduffel W, Rosen BR, Mandeville JB. Neurovascular coupling to D2/D3 dopamine receptor occupancy using simultaneous PET/functional MRI. Proc Natl Acad Sci U S A. 2013;110(27):11169-74. doi: 10.1073/pnas.1220512110.
- Page RL 2nd, Allen LA, Kloner RA, Carriker CR, Martel C, Morris AA, Piano MR, Rana JS, Saucedo JF; American Heart Association Clinical Pharmacology Committee and Heart Failure and Transplantation Committee of the Council on Clinical Cardiology; Council on Basic Cardiovascular Sciences; Council on Cardiovascular and Stroke Nursing; Council on Epidemiology and Prevention; Council on Lifestyle and Cardiometabolic Health; and Council on Quality of Care and Outcomes Research. Medical Marijuana, Recreational Cannabis, and Cardiovascular Health: A Scientific Statement From the American Heart Association. Circulation. 2020 Sep 8;142(10):e131-e152. doi: 10.1161/CIR.0000000000000883.
- Rohlfing T, Kroenke CD, Sullivan EV, Dubach MF, Bowden DM, Grant KA, Pfefferbaum A. The INIA19 Template and NeuroMaps Atlas for Primate Brain Image Parcellation and Spatial Normalization. Front Neuroinform. 2012;6:27. doi: 10.3389/fninf.2012.00027.
- Mandeville JB. IRON fMRI measurements of CBV and implications for BOLD signal. Neuroimage. 2012;62(2):1000-8. doi: 10.1016/j.neuroimage.2012.01.070.
- Liu CH, Greve DN, Dai G, Marota JJ, Mandeville JB. Remifentanil administration reveals biphasic phMRI temporal responses in rat consistent with dynamic receptor regulation. Neuroimage. 2007;34(3):1042-53. doi: 10.1016/j.neuroimage.2006.10.028.
Figures