4421
Spin-lock dispersion imaging detects changes in the intrinsic susceptibility microstructure of brain induced by oxygen1Vanderbilt University Medical Center, Nashville, TN, United States
Synopsis
Previous research has shown that spin-lock imaging with low locking amplitude can quantify the spatial characteristics of intrinsic susceptibility gradients in tissues which likely reflect vascular microstructure. We evaluated the capability of spin-lock dispersion imaging with weak locking fields to detect vasoconstriction in rat brains under oxygen challenges.
PURPOSE
It has previously been shown that spin-lock sequences with low locking amplitudes (ω1) can reduce the losses caused by diffusion in regions containing susceptibility inhomogeneities. Judicious selection of locking powers and combinations of data acquired with different ω1 can isolate susceptibility effects from other influences on signal losses, and may be used to quantify the spatial frequencies of intrinsic susceptibility gradients. In tissues these are likely dominated by microvasculature 1-3. Breathing oxygen causes vasoconstriction in the brain, and detection of the effects of breathing gas challenges may be useful for assessing cerebrovascular integrity. Previously, vessel size imaging by MRI has been based on comparing gradient-echo (GE) and spin-echo (SE) signals after injection of a paramagnetic contrast agent 4, 5. We evaluated the capability of spin-lock imaging with low locking amplitudes to detect changes of vessel diameter caused by breathing oxygen.METHODS
Spin-lock experiments were performed on a 4.7T Varian animal system. A spin-lock preparation cluster (90x-τy/2-180y-τ-y/2-90x) was applied before single-shot spin-echo EPI readouts. R1𝞀 values were obtained by acquiring images with spin-lock times (SLT) varying as 1, 5, 10, 15, 20, 25, 50, 75, 100 ms. Values of R1𝞀 were obtained by fitting the spin-locking signal (S) with a mono-exponential function S/S0 = exp(-R1𝞀﹒SLT), in which S0 is the signal measured with SLT of 0 ms. R1𝞀 values at different fields (= R1𝞀 dispersion) were obtained by varying ω1 from 0 Hz to 10 kHz. All images were acquired with matrix size 64 × 64, FOV = 30 ×30 mm, and a single-slice scan with slice thickness of 2 mm.All animal procedures were approved by the local Animal Care and Usage Committee. All rats were immobilized and anesthetized with 2-3% isoflurane (ISO) and lab air before MR imaging. Four healthy rats with first intake of air and then 97-98% O2 were scanned. Respiration rate was monitored to be in a range from 40 to 70 breaths per minute. Rectal temperature was maintained at 37°C using a warm-air feedback system.
When ω1 is weak errors in the quantification of R1𝞀 arise because of B0 variations that introduce off-resonance effects. Previously, we have described a data correction which can reduce this error when the B0 shift is not too large 6. To use this correction, B0 and B1 maps were measured. B0 maps were obtained from two images acquired with a GE sequence with TEs of 5 ms and 8 ms, TR of 30 ms, and flip angle of 20º. B1 maps were obtained by a double-angle approach using two images acquired with a GE sequence with excitation flip angles of 60º and 120º, TR of 2 s, and TE of 10 ms.
R1ρ in biological tissues can be expressed as the superposition of R1ρDiff, R1ρEx, and R2a 1, 2,
$$ R_{1ρ}=R_{1ρ}^{Diff}+R_{1ρ}^{Ex}+R_{2a} $$ (1)
where R1ρDiff and R1ρEx are the relaxation rates due to water diffusion through susceptibility gradients and chemical exchange effects, respectively. R2a is the intrinsic transverse relaxation rate. The contribution to R1ρDiff from water with self-diffusion coefficient D is given by 1-3
$$ R_{1ρ}^{Diff}=γ^2 g^2 D/((q^2 D)^2+ω_1^2 ) $$ (2)
where q represents an effective spatial frequency that characterizes the scale of the inhomogeneities, and g is the mean gradient strength. R, the scale of the inhomogeneities producing the gradients, can then be estimated as ≈ π/q. R1ρEx + R2a can be regarded as constant (c) over a range of low ω1, so q in biological tissues can be obtained by using Equations 1 and 2. Here, q values were obtained by fitting R1𝞀 acquired with ω1 of 0, 56, 100, 177, and 316 Hz so any dispersion is mainly due to diffusion effects.
Maps of R1𝞀 and R were calculated voxel-wise but voxels with B0 shift > 20 Hz were omitted. Similarly, voxels indicating R values > 15 µm were also omitted as they corresponded to low SNR.
RESULTS
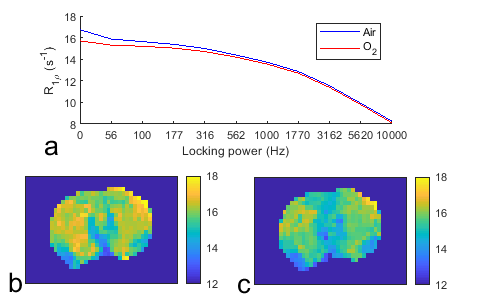
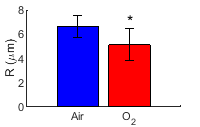
Fig. 1a shows the average of the corrected R1𝞀 dispersions acquired with intake of air and O2, respectively. Note that R1𝞀 values with low ω1, but not high ω1, decrease after the intake of O2, suggesting that the oxygen challenge changes the intrinsic susceptibility but not chemical exchange or intrinsic transverse relaxation. Fig. 1b and 1c show the corrected R1𝞀 maps with ω1 of 100 Hz acquired with intake of air and O2, respectively, from a representative rat brain. Fig. 2 shows the statistical analysis of R values from the whole brain acquired with intake of air and O2, respectively. Note that R values significantly decrease after the intake of O2. R values with intake of air and O2 were estimated to be 6.6 ± 0.9 µm and 5.1 ± 1.3 µm, respectively (assuming D = 2×10⁻⁵ cm2s-1), which are roughly in agreement with a previous report 5.DISCUSSION AND CONCLUSION
Spin-lock dispersion imaging with low locking amplitudes and appropriate data corrections may be an alternative method for vessel size imaging and does not require contrast agent.Acknowledgements
The authors acknowledge grant support from NIH (R01 EB024525)References
1. Spear JT, Gore JC. Effects of diffusion in magnetically inhomogeneous media on rotating frame spin-lattice relaxation. J Magn Reson. 2014;249:80-87
2. Spear JT, Gore JC. New insights into rotating frame relaxation at high field. Nmr Biomed. 2016;29:1258-1273
3. Zu ZL, Janve V, Gore JC. Spin-lock imaging of intrinsic susceptibility gradients in tumors. Magn Reson Med. 2020;83:1587-1595
4. Tropres I, Grimault S, Vaeth A, et al. Vessel size imaging. Magn Reson Med. 2001;45:397-408
5. Shen YJ, Pu IM, Ahearn T, et al. Quantification of venous vessel size in human brain in response to hypercapnia and hyperoxia using magnetic resonance imaging. Magn Reson Med. 2013;69:1541-1552
6. Zu Z, Adelnia F, Harkins K, et al. Correction of errors in estimates of t1ρ at low spin-lock amplitudes in the presence of b0 and b1 inhomogeneities. ISMRM Annual Meeting, May 2021. 2021:1476
Figures