4420
Double offsets and powers magnetization transfer ratio (dopMTR) for specific MT MR imaging1Vanderbilt University Medical Center, Nashville, TN, United States
Synopsis
Magnetization transfer (MT) effect has been analyzed by the MT ratio (MTR) or quantitative MT (qMT). However, because the MTR lacks sensitivity and specificity to MT effect and qMT needs a long scan time, their application into clinical scenarios has been limited. In this paper, we introduce the dopMTR, a new MT data analysis and acquisition method that uses double saturation pulse offsets and powers. Simulations and experiments show that the dopMTR can provide more specific and sensitive quantification of the MT effect than the conventional MTR, with relatively brief acquisition times and easy data processing.
PURPOSE
Magnetization transfer (MT) is a magnetic resonance imaging (MRI) contrast mechanism that enables the detection of less mobile protons whose transverse relaxation times (T2) is too short to be detected directly. Conventionally, a magnetization transfer ratio (MTR), defined by Eq. (1), has been used to analyze the degree of signal attenuation due to the MT effect,$$ MTR(Δω,ω_1 )=(S_0-S(Δω,ω_1 ))/S_0 $$ (1)
where S0 and S(Δω, ω1) are the water signals acquired without/with off-resonance RF saturation, respectively, Δω is the RF frequency offset (Hz), and ω1 is the RF saturation power (rad/sec). However, although the MTR value depends on the MT effect, it is a complex combination of various parameters, including MT parameters and water relaxations. As a result, although the MTR value has been linked to the extent of myelin damage 1, it can also be influenced by edema and inflammation 2, 3, and its variation in multiple sclerosis is often small 4. In this work, we developed a new MT data analysis and acquisition method with improved sensitivity and specificity to the MT effect compared to the conventional MTR.
METHODS
We define a new method, termed the double offsets and powers magnetization transfer ratio (dopMTR) in Eq. (2), which is the inverse subtraction of two MT signals acquired at two sets of sequence parameters including (Δω, ω1) and (cΔω, cω1) together with T1w normalization (c is a constant). $$dopMTR(Δω,ω_1)=|S_0/S(Δω, ω_1 ) -S_0/S(cΔω, cω_1 ) | R_{1w} $$ (2)Simulations of two-pool coupled Bloch equations, with varied macromolecular pool concentration (fm), MT rate between macromolecular and water pools (kmw), and water relaxations (T1w, T2w), were performed to study the specificity and sensitivity of the MTR and dopMTR to MT effect. Experiments on a series of cross-linked bovine serum albumin (BSA) samples and 4 healthy rat brains were also performed to evaluate the two methods. Three samples of 5% (sample #1), 10% (sample #2), and 15% (sample #3) (w/w) BSA in phosphate-buffered Saline (PBS) with pH of 7.0 were prepared. 0.075mM MnCl2 was added to these three samples to vary their water relaxations. These three samples have different fm values (and thus also different R1w values) and were used to study the dependence of the two MT analysis methods on fm. Three additional samples of 0.05 mM (sample #4), 0.075 mM (sample #5), and 0.1 mM (sample #6) MnCl2 in PBS with pH of 7.0 were prepared. BSA was added to these samples until they reached 10% (w/w). These three samples, which have different R1w but the same fm, were used to study the dependence of the two MT analysis methods on R1w. All animal experiments were approved by the local Animal Care and Usage Committee. Experiments were performed on a Varian 4.7T magnet with a 38-mm RF coil. The MT sequence contains a 5s continuous wave saturation pulse followed by a SE-EPI readout. For comparison with the two MT analysis methods, quantitative MT (qMT) using a selective inversion recovery (SIR) method was also performed 5.
RESULTS
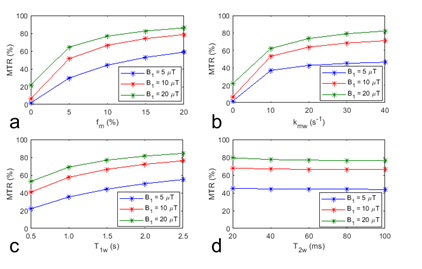
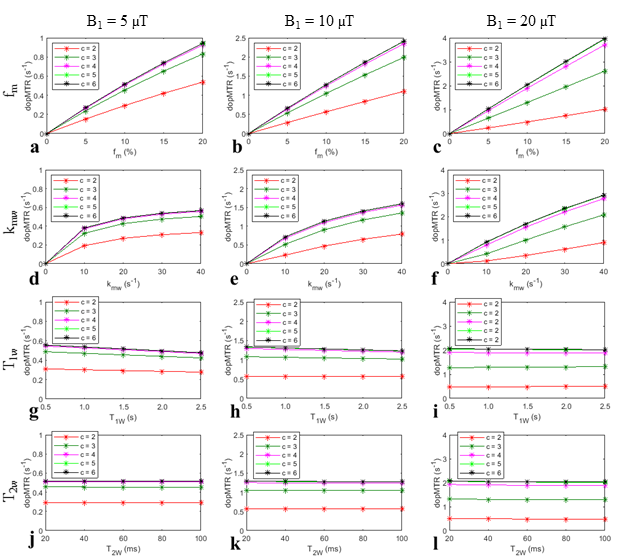
Fig.1 shows simulations of MTR as a function of several sample parameters. The MTR values are nonlinearly dependent on fm, kmw, and T1w. When fm was increased from 5% to 15% (3 times), the MTR value was increased only from 64% to 83% (1.3 times), suggesting that the sensitivity of MTR to fm was low. The MTR values have a weak dependence on T1w. However, given its weak dependence on fm this weak dependence on T1w may still reduce the specificity of the MTR to the MT effect.Fig.2 shows the simulated dopMTR as a function of several sample parameters. The dopMTR value is proportional to fm, increases nonlinearly with kmw, and is roughly independent of T1w and T2w, showing improved specificity and sensitivity to the MT effect when compared with the MTR method.
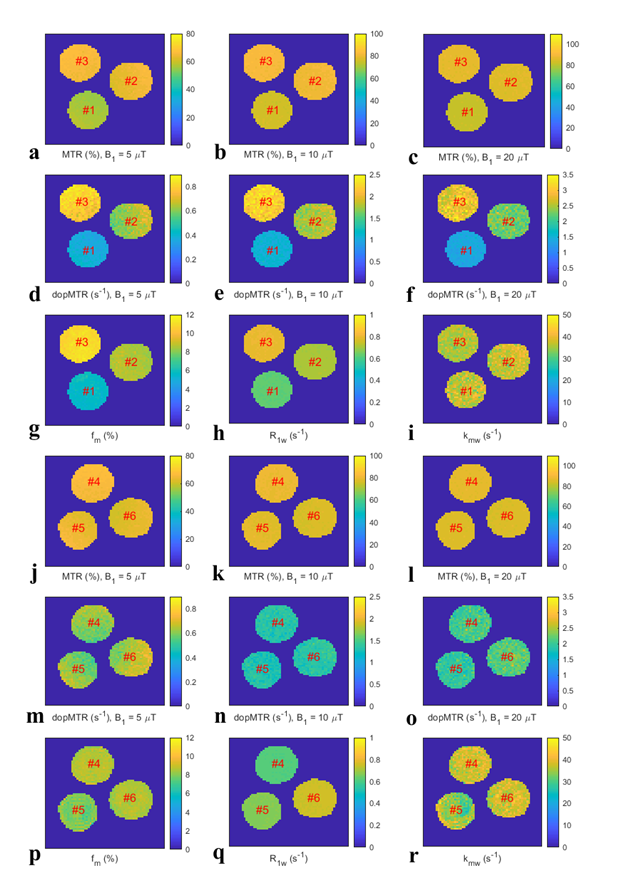
Fig. 3 shows images of the MTR, dopMTR, and qMT-determined fm, R1w, kmw on BSA samples #1-6. The contrast among samples #1-3 in the dopMTR images is similar to the image of qMT-determined fm. The images of the MTR, on the other hand, show nearly no contrast. Additionally, contrast among samples #4-6 can be observed in the image of the qMT-determined R1w, but not in the image of the dopMTR.
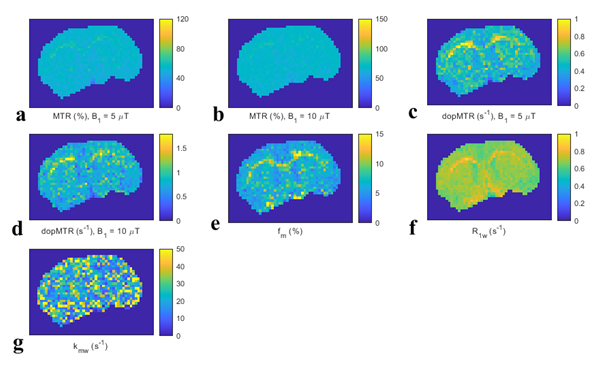
Fig. 4 shows images of the MTR, dopMTR, and qMT-determined fm, R1w, kmw in a representative rat brain. The white matter (WM) can be clearly found in the images of the dopMTR and qMT-determined fm, but not the MTR.
DISCUSSION AND CONCLUSION
MT signals usually have contributions from both MT and direct water saturation (DS) effects. The MTR subtracts a control signal acquired without saturation from an MT signal which cannot fully remove DS and induces a complex dependence on T1w. According to Bloch equations, the DS, but not MT effect, remains constant when Δω and ω1 are changed in the same proportion. Thus, the MT signal measured with cΔω and cω1 can be used as a reference signal, whereas the MT signal measured with Δω and ω1 can be used as a label signal, to isolate the MT from DS effect. After removing the DS effect, R1w can be easily removed by normalizing T1w 6.Acknowledgements
The author acknowledges grant support from NIH (R21 AR074261, R03 EB029078, and R01 EB029443)References
1. Schmierer K, Scaravilli F, Altmann DR, et al. Magnetization transfer ratio and myelin in postmortem multiple sclerosis brain. Ann Neurol. 2004;56:407-415
2. Vavasour IM, Laule C, Li DKB, et al. Is the magnetization transfer ratio a marker for myelin in multiple sclerosis? J Magn Reson Imaging. 2011;33:713-718
3. vanWaesberghe JHT, Castelijns JA, Scheltens P, et al. Comparison of four potential mr parameters for severe tissue destruction in multiple sclerosis lesions. Magn Reson Imaging. 1997;15:155-162
4. Vrenken H, Pouwels PJW, Ropele S, et al. Magnetization transfer ratio measurement in multiple sclerosis normal-appearing brain tissue: Limited differences with controls but relationships with clinical and mr measures of disease. Multiple sclerosis. 2007;13:708-716
5. Gochberg DF, Gore JC. Quantitative magnetization transfer imaging via selective inversion recovery with short repetition times. Magn Reson Med. 2007;57:437-441
6. Zaiss M, Zu ZL, Xu JZ, et al. A combined analytical solution for chemical exchange saturation transfer and semi-solid magnetization transfer. Nmr Biomed. 2015;28:217-230
Figures