4419
Fast Multi-slice Quasi-steady-state (QUASS) APT MRI: Preliminary Results from Brain Tumor Patients at 3 Tesla
Hahnsung Kim1,2, Lisa C. Krishnamurthy 3,4, Kimberly B Hoang5, Ranliang Hu2, and Phillip Zhe Sun1,2
1Yerkes Imaging Center, Yerkes National Primate Research Center, Emory University, Atlanta, GA, United States, 2Department of Radiology and Imaging Sciences, Emory University School of Medicine, Atlanta, GA, United States, 3Center for Visual and Neurocognitive Rehabilitation, Atlanta VA, Decatur, GA, United States, 4Department of Physics & Astronomy, Georgia State University, atlanta, GA, United States, 5Department of Neurosurgery, Emory University School of Medicine, Atlanta, GA, United States
1Yerkes Imaging Center, Yerkes National Primate Research Center, Emory University, Atlanta, GA, United States, 2Department of Radiology and Imaging Sciences, Emory University School of Medicine, Atlanta, GA, United States, 3Center for Visual and Neurocognitive Rehabilitation, Atlanta VA, Decatur, GA, United States, 4Department of Physics & Astronomy, Georgia State University, atlanta, GA, United States, 5Department of Neurosurgery, Emory University School of Medicine, Atlanta, GA, United States
Synopsis
The multi-slice CEST signal evolution was described by the spin-lock relaxation during saturation duration (Ts) and longitudinal relaxation during the relaxation delay time (Td) and post-label delay (PLD), from which the QUASS CEST was generalized to fast multi-slice acquisition. In addition, normal human subjects and tumor patients scans were performed to compare the conventional apparent and QUASS CEST measurements with different Ts, Td, and PLD. Bland-Altman analysis bias of the proposed QUASS CEST effects was much smaller than the PLD-corrected apparent CEST effects (0.03% vs. -0.54%), indicating the proposed fast multi-slice CEST imaging is robust and accurate.
Introduction
Chemical exchange saturation transfer (CEST) MRI is sensitive to detecting tissue changes following acute stroke, tumors, and epilepsy1-3. CEST MRI is versatile, but the CEST measurement depends not only on labile proton concentration and exchange rate but also on experimental parameters, such as the duration of radiofrequency (RF) saturation (Ts) and the relaxation recovery delay (Td). Although the use of long RF irradiation enhances the CEST effect, it unavoidably prolongs the total scan time, making CEST MRI challenging for routine clinical use. For typical human CEST scans, the RF saturation time can range from 0.2 to 3.5 s at 3 T3-5. Therefore, CEST protocols vary substantially among centers, and it is urgent to unify results obtained under different Ts and Td. A quasi-steady-state (QUASS) CEST algorithm has been recently proposed to reduce impacts of experimental Ts and Td parameters on the CEST measurement6. We hypothesized that the QUASS algorithm can be generalized for the multi-slice acquisition in addition to Ts and Td correction and tested it for fast multi-slice imaging in tumor patients.Theory
A schematic diagram of the fast multi-slice spin echo (SE) echo planar imaging (EPI) CEST MRI sequence is shown in Figure 1. The apparent CEST Z-spectrum is calculated by normalizing the saturated scan signal ($$$I'_{sat}$$$) with the unsaturated control scan signal ($$$I'_{0}$$$)7:$$\frac{I'_{sat}\left(\Delta\omega\right)}{I'_{0}}=\frac{\left(1-e^{-R_{1w}T_{d}}\right)e^{-R_{1\rho}\cdot T_{s}}+\frac{R_{1w}}{R_{1\rho}}\cos^{2}\theta\left(1-e^{-R_{1\rho}\cdot T_{s}}\right)}{1-e^{-R_{1w}\cdot \left(T_{s}+T_{d}+pld\right)}}e^{-R_{1w}\cdot pld}+\frac{1-e^{-R_{1w}\cdot pld}}{1-e^{-R_{1w}\cdot \left(T_{s}+T_{d}+pld\right)}}\qquad\qquad\left[1\right]$$
where $$$R_{1w}$$$ is the bulk water longitudinal relaxation rate, $$$I_{0}$$$ is the equilibrium magnetization, $$$R_{1\rho}$$$ is the spin-lock relaxation rate and $$$\theta=\arctan\left(\frac{\gamma B_{1}}{\Delta \omega}\right)$$$, in which $$$\gamma$$$ is the gyromagnetic ratio and B1 and $$$\Delta \omega$$$ are the amplitude and offset frequency of the RF saturation, respectively. Under the assumption that Ts and Td are much longer than the post-label delay (PLD) time, the PLD-corrected apparent CEST Z-spectrum can be derived as,
$$\frac{I'^{pldcor}_{sat}\left(\Delta \omega\right)}{I'^{pldcor}_{0}}\cdot \left\{\frac{1-e^{-R_{1w}\left(T_{s}+T_{d}\right)}}{1-e^{-R_{1w}\cdot T_{d}}}\right\}=e^{-R_{1\rho}\cdot T_{s}}+\frac{R_{1w}\cdot \cos^2 \theta}{R_{1\rho}\cdot \left(1-e^{-R_{1w}\cdot T_{d}}\right)}\cdot \left(1-e^{-R_{1\rho}\cdot T_{s}}\right)\qquad\qquad\left[2\right]$$
in which the superscript pldcor denotes the PLD-corrected apparent signals. $$$R_{1\rho}$$$ can be numerically solved, and the QUASS-corrected CEST Z-spectrum can be calculated as
$$\left(\frac{I_{sat}\left(\Delta \omega\right)}{I_{0}}\right)^{QUASS}=\frac{R_{1w}}{R_{1\rho}}\cos^{2}\theta\qquad\qquad\left[3\right]$$
Methods
Informed written consent was obtained following IRB-approved protocol. Three healthy volunteers (1 male and 2 females, age 25-39) and a brain tumor patient underwent CEST brain MRI using a 3T MR scanner (Magnetom Prisma, Siemens Medical Solutions, Erlangen, Germany) with a 64-channel head and neck coil. Two sets of multi-slice brain images with different pairs of saturation duration and relaxation delays (Ts/Td =1 s/1 s and 2 s/2 s) were acquired in the axial orientation. Multiple rectangular RF pulse (duration = 499.8 ms, duty cycle = 99.9 %, B1 = 0.7 µT) were exploited to emulate continuous wave saturation. The alternating offset frequencies of RF saturation were varied from -5 to 5 ppm, with increments of 0.125 ppm. The imaging parameters were: imaging readout time = 547 ms, TE = 33 ms, FOV = 220 × 220 mm2, in-plane matrix = 110 × 110, the number of slices = 8, interleaving slice ordering, slice thickness = 5 mm with 25% slice gap, with fat suppression, 1 average, and readout bandwidth = 1976 Hz/pix. Total imaging time was 3 min 31 s and 6 min 17 s for Ts/Td of 1 s/1 s and Ts/Td of 2 s/2 s, respectively. T1w-weighted images were acquired using eight inversion recovery delay (0.25, 0.5, 0.75, 1.0, 1.25, 1.5, 2.0, and 3.0 ms) with relaxation delay of 5.0 s, and 2 average.Results/Discussion
Figure 2 shows CESTR′, PLD-corrected CESTR′, and CESTRQUASS of healthy human brain images at 3.5 ppm with Ts/Td of 1/1 s and 2/2 s. The apparent CEST effects noticeably differed in the direction of the multi-slice acquisition and under different Ts and Td (Figs. 2A, B). Although PLD-corrected apparent CEST effects showed little PLD dependency, there was a noticeable CEST contrast discrepancy between Ts/Td of 1/1 s and 2/2 s (Figs. 2C, D). In contrast, the QUASS CEST effects were more consistent between Ts/Td of 1/1 s and 2/2 s (Figs. 2E, F). Specifically, for WM, the PLD-corrected CESTR′ was 3.32±1.09% and 3.83±1.11% for Ts/Td of 1/1 s and 2/2 s, respectively, while CESTRQUASS being 4.91±1.23% and 4.87±1.20%. In GM, the PLD-corrected CESTR′ was 2.00±1.09% and 2.54±1.09% for Ts/Td of 1/1 s and 2/2 s, respectively, while their corresponding CESTRQUASS being 3.36±1.56% and 3.28±1.34%. In Figure 3, the Bland-Altman analysis bias was -0.54% for PLD-corrected CESTR′ and 0.03% for CESTRQUASS, indicating that the proposed QUASS algorithm minimizes the bias in the CEST measurement, advantageous over simple PLD correction. Compared with the contralateral normal tissue, the tumor region shows greater CESTR in Figure 4. In particular, the apparent CEST effect increased with the increase of Ts and Td, while the QUASS CEST effects showed little Ts and Td dependency.Conclusion
Our study demonstrated fast multi-slice CEST brain MRI with healthy volunteer and brain tumor patient scans. In addition, the QUASS algorithm minimizes the effect of the choice of saturation duration, relaxation delay, and post-label delay time on the CEST MRI quantification. In summary, the QUASS algorithm enables an expedited CEST MRI acquisition strategy, thereby increasing its clinical translatability, particularly at high magnetic fields, while providing accurate steady-state CEST measurement.Acknowledgements
No acknowledgement found.References
[1] Sun PZ et al., Detection of the ischemic penumbra using pH-weighted MRI. J Cereb Blood Flow Metab 2007;27(6):1129-1136. [2] Daivis KA et al., Glutamate imaging (GluCEST) lateralizes epileptic foci in nonlesional temporal lobe epilepsy. Sci Transl Med. 2015;7(309):309ra161. [3] Togao O et al., Amide proton transfer imaging of adult diffuse gliomas: correlation with histopathological grades. Neuro Oncol. 2014;16(3):441-448. [4] Harston GW et al., Identifying the ischaemic penumbra using pH-weighted magnetic resonance imaging. Brain 2015;138(1):36-42 [5] Goerke S et al., Clinical routine acquisition protocol for 3D relaxation‐compensated APT and rNOE CEST‐MRI of the human brain at 3T. Magn Reson Med 2021. [6] Sun PZ., Quasi‐steady state chemical exchange saturation transfer (QUASS CEST) analysis—correction of the finite relaxation delay and saturation time for robust CEST measurement. Magn Reson Med 2021;85(6):3281-3289. [7] Jin T, et al., Spin‐locking versus chemical exchange saturation transfer MRI for investigating chemical exchange process between water and labile metabolite protons. Magn Reson Med 2011;65(5):1448-1460.Figures

Figure
1. (A) The proposed multi-slice SE
EPI CEST imaging pulse sequence that includes a long relaxation delay (Td)
and a continuous wave RF saturation (Ts), followed by concatenated
multi-slice image readout. (B) MRI signal recovers toward the equilibrium state
during Td and approaches the steady-state during the RF saturation
of Ts. After the RF
saturation, the signal evolves towards the equilibrium state during the
post-label delay time. Note that PLD differs with the order of slice readout, leading to
decreased apparent CEST effect as PLD time increases.
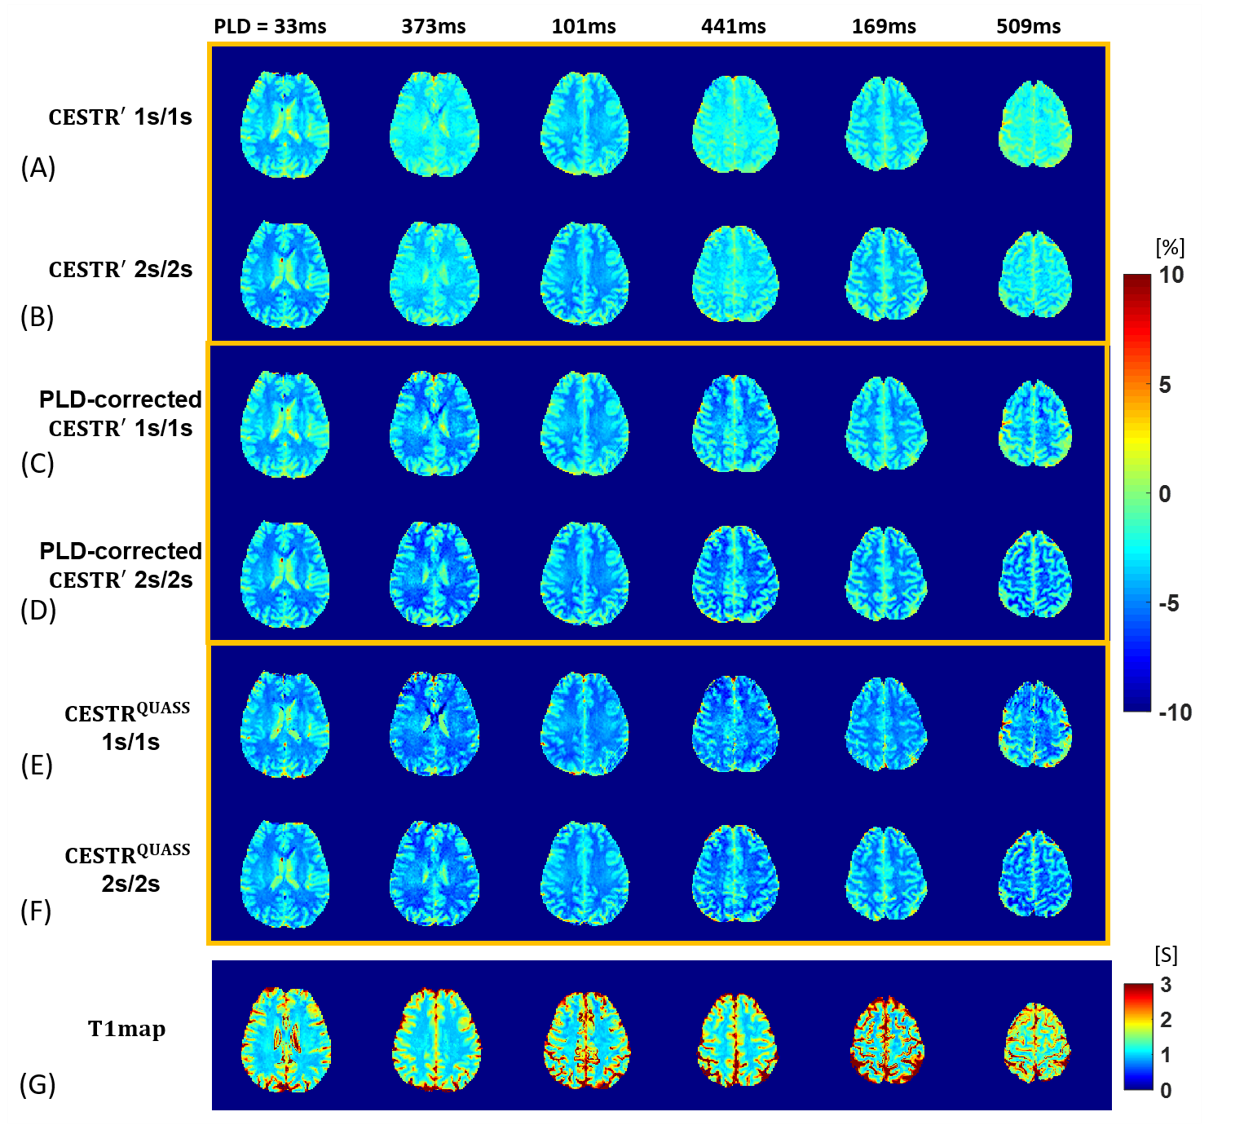
Figure
2. Comparison of multi-slice brain images obtained from (A) apparent CESTR (CESTR') images with
Ts/Td of
1/1 s, (B) CESTR' images with Ts/Td of 2/2 s, (C) PLD-corrected CESTR' images with Ts/Td of 1/1 s, (D) PLD-corrected CESTR' images with Ts/Td of 2/2 s, (E) QUASS-corrected apparent CESTR
(CESTRQUASS) images with Ts/Td of 1/1 s, and (F) CESTRQUASS images with Ts/Td of 2/2 s. (G) The corresponding T1w map images. Note that top
and bottom slices were removed throughout inter-scan volume registration
postprocessing.
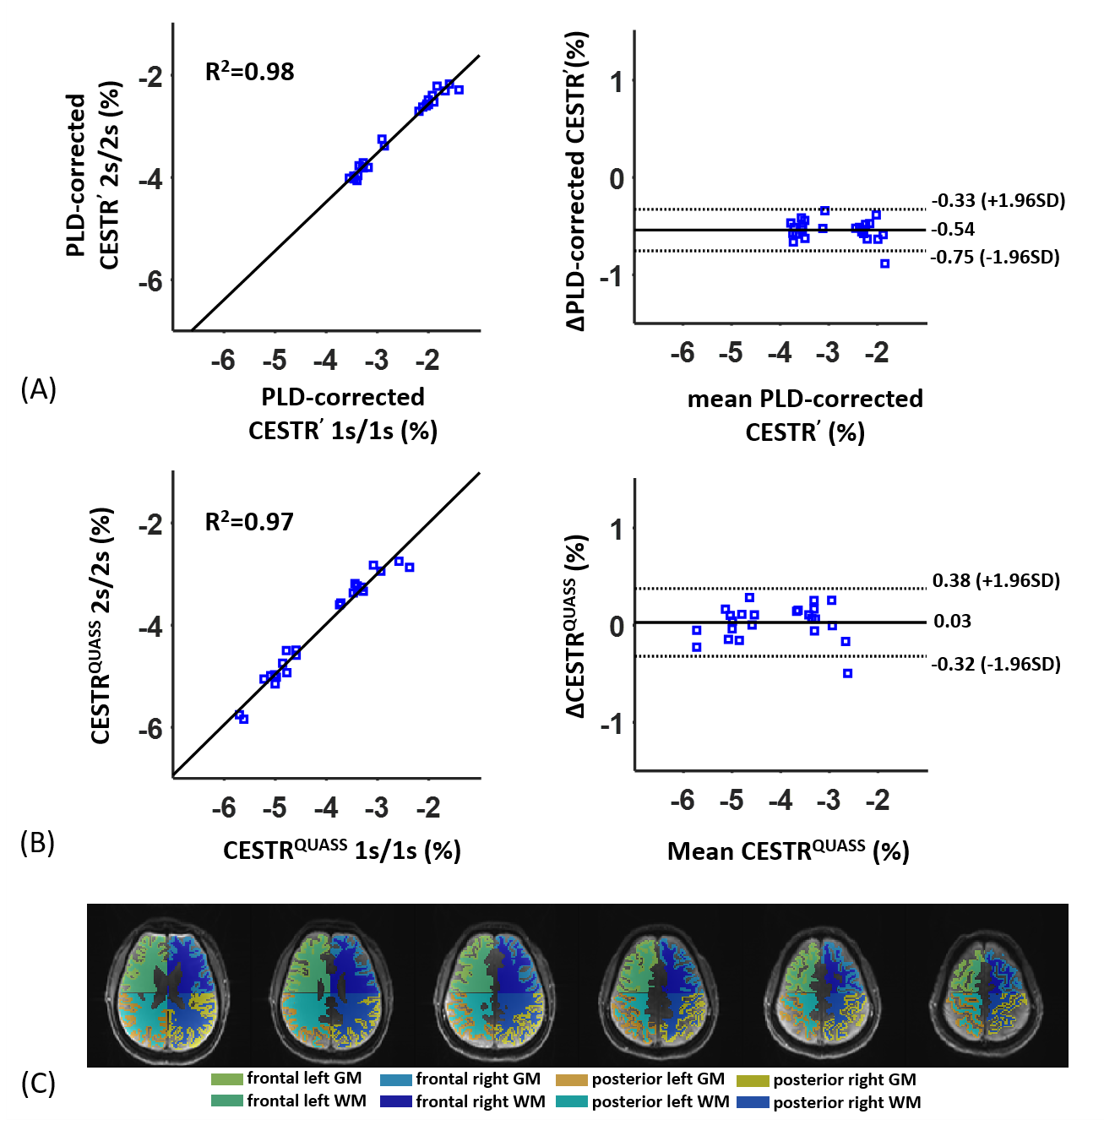
Figure
3.
Correlation plots and Bland-Altman
plots of (A) PLD-corrected apparent CEST effect and (B) QUASS CEST effect. The
eight ROIs for three subjects were used for Bland-Altman analysis. In the
correlation plots, the horizontal and vertical axis represents the CESTR for Ts/Td of 1/1 s and 2/2 s, respectively. In
the Bland-Altman plots, the horizontal axis is the mean CESTR for Ts/Td of 1/1 s and 2/2 s, and the vertical axis is
their difference. (C) WM and GM segmentations were divided into four
compartments: frontal right, frontal left, posterior right, and posterior left
hemisphere.
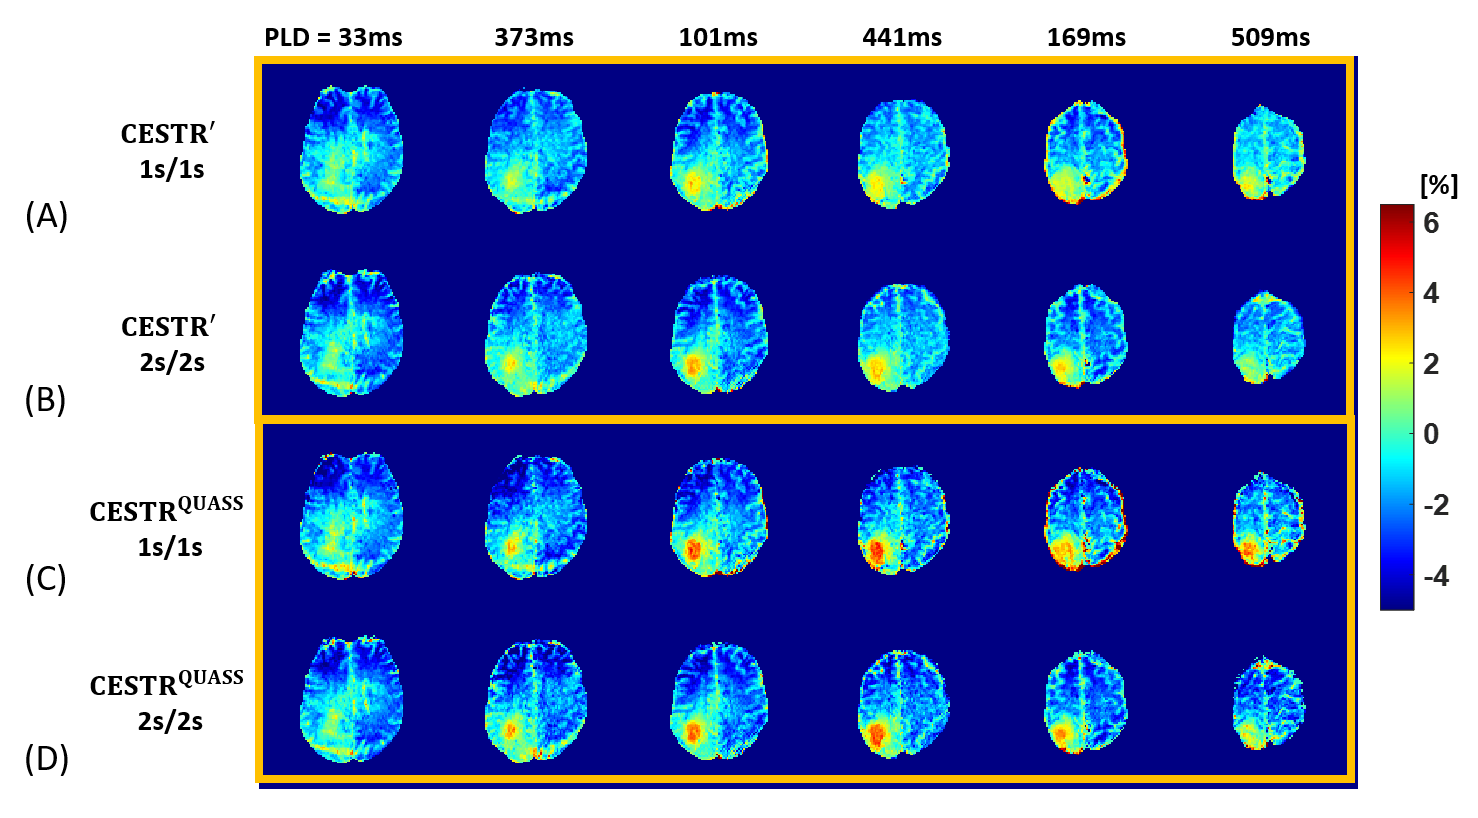
Figure
4. Comparison of multi-slice tumor patient images (A-D)
obtained from (A) apparent CESTR (CESTR') images with Ts/Td of 1/1
s, (B) CESTR' images with Ts/Td of 2/2 s, (C) CESTRQUASS images with Ts/Td of 1/1 s, and (D) CESTRQUASS images with Ts/Td of 2/2 s.
DOI: https://doi.org/10.58530/2022/4419