4417
Deep learning-based CEST MRI classification of injured kidneys in multiple preclinical models
Chongxue Bie1,2,3, Zheng Han1,2, Peter C. M. van Zijl1,2, Nirbhay N. Yadav1,2, and Guanshu Liu1,2
1F.M. Kirby Research Center for Functional Brain Imaging, Kennedy Krieger Institute, Baltimore, MD, United States, 2The Russell H. Morgan Department of Radiology, The Johns Hopkins University School of Medicine, Baltimore, MD, United States, 3Department of Information Science and Technology, Northwest University, Xi'an, China
1F.M. Kirby Research Center for Functional Brain Imaging, Kennedy Krieger Institute, Baltimore, MD, United States, 2The Russell H. Morgan Department of Radiology, The Johns Hopkins University School of Medicine, Baltimore, MD, United States, 3Department of Information Science and Technology, Northwest University, Xi'an, China
Synopsis
Accurate detection of kidney injury is of immense importance for the diagnosis and treatment of acute kidney injury (AKI). While CEST MRI has the potential to reveal the pathophysiological changes on a molecular level, no automatic, CEST-based classification model has been developed. We developed a deep neural network (DNN) to analyze features of the Z-spectral data and to classify injured and healthy renal tissues. The results show that the classification model was capable of reliable prediction of kidney injury among different AKI mouse models. Results correlated well with serum creatinine (SCr) measurement.
Introduction
Acute kidney injury (AKI) is a major complication of renal disease associated with rapid progression and high mortality.1 Recently, CEST MRI has been developed as a promising technology to detect AKI.2 However, no study has been conducted to fully utilize the comprehensive information buried in the Z-spectral data, which reflects the combined contribution of all protons with different saturation transfer properties encompassed in a tissue voxel. In this study, we developed a deep neural network (DNN), to analyze the Z-spectral data and establish a model to classify kidney injury. Our goal was to fully utilize Z-spectral data for comprehensively evaluating the status of renal tissues. To validate our developed method, we conducted studies in three different AKI animal models, i.e., lipopolysaccharide-induced AKI (LPS-AKI), glycerol-induced rhabdomyolysis AKI (Gly-AKI), and unilateral ischemia-reperfusion injury (IRI) AKI (IRI-AKI). The trained model, in principle, can be extrapolated to other types of kidney injuries.Materials and Methods
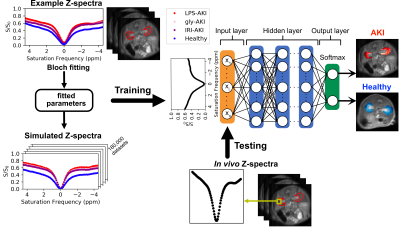
LPS-AKI (n=3), Gly-AKI (n=4), and IRI-AKI (n=3) mouse models were prepared by intramuscular (i.m.) injection of 10 mg/kg (in 0.1 mL 0.9% normal saline), 8 ml/kg glycerol (50% v/v in saline), and renal vascular pedicle clamping for 45 min in C57BL/6J mice, respectively. Depending on the speed of disease progression, CEST assessments were performed on day 1 for LPS-AKI and IRI-AKI and day 7 for Gly-AKI. Blood was collected after imaging, and SCr levels were measured using an SCr kit (ThermoFisher). CEST MRI was acquired using a RARE-based CEST sequence (TR/TE= 5000/ 5 ms) on an 11.7 T Bruker Biospec scanner equipped with a 23-mm volume transceiver coil as described previously2.Data analysis was performed by normalizing the CEST images by the corresponding S0 images, correcting for B0 shifts using the WASSR method3, and interpolating to a spectral resolution of 0.1 ppm. To ensure sufficient SNR, images were denoised using a median filter with a kernel size of 3. To establish training data, the Z-spectra (whole kidney ROIs) of four randomly selected kidneys from each group (3 AKI models and control) were fitted with the 5-pool Bloch-McConnel equations4, including proton pools of water, amine (2.5 ppm), amide (3.5 ppm), relayed Nuclear Overhauser effect (rNOE, -3.5 ppm), and semi-solid macromolecular signals (MTC). The fitted parameters were then used to generate a library of 180,000 simulated Z-spectra for injured and healthy tissues as the training dataset. To mimic true signal variation, the ranges of the exchangeable proton pool sizes were fixed in simulations. The trained DNN model was fine-tuned using the four selected kidneys and tested using the remaining mouse data (n=10). The illustration of the classification process is shown in Figure 1. To evaluate the diagnostic efficiency, the ratio of the number of injury voxels predicted by the model and total voxel number in the kidneys in each mouse was calculated and compared to Scr (ground truth). For comparison, the amide proton transfer weighted (APTw) and rNOE weighted (rNOEw) CEST contrasts were computed using the Lorentzian difference (LD) at 3.5 ppm, respectively. LD is defined as the difference signal after fitting out the direct saturation and MTC broad background.
Results
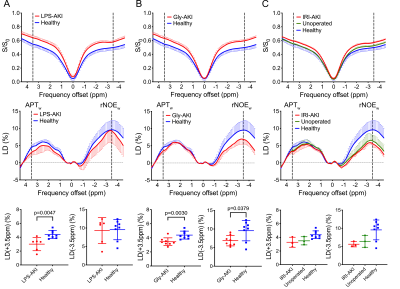
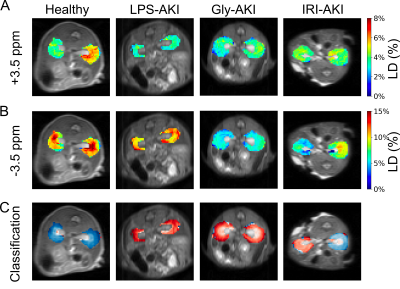
Consistent with previous findings in LPS-AKI2, all types of AKI caused noticeable changes in CEST contrast in the kidneys (Figure 2). Figure 3 show the representative APTw and rNOEw maps using voxel-by-voxel LD analysis and the corresponding classification maps that were predicted by the DNN model using in vivo Z-spectral data on a voxel-wise basis. The results show that the DNN classification model could reliably distinguish injured tissues from normal ones and predict “injured” and “healthy” voxels in all three different AKI models. The DNN classification model exhibited higher correlation with SCr levels (correlation coefficients |CC|= 0.69) on a per mouse basis than APTw (|CC|= 0.49) or rNOEw (|CC|= 0.09) contrast obtained using the LD method (Figure 4), indicating a higher diagnostic efficiency.Discussion
In this study, we first obtained the fitted parameters of 5-pool Bloch equations of the normal and injured kidneys and generated artificial datasets using simulated Z-spectra based on these fitted parameters. The DNN-based classification model was proven to be effective. The predicted values could reliably reflect the status of renal tissue. Compared to conventional APTw and rNOEw metrics, the DNN-based classification model provided higher correlation with SCr, indicative of higher diagnosis accuracy. Of note, the unoperated kidneys in IRI-AKI models were classified as healthy tissues by the DNN model, but misinterpreted as injured kidneys by APTw and rNOEw. Finally, further studies and technical improvements are still needed to address the issues of “misclassified” voxels. In some control animals, we found misclassified voxels on the edge of the kidneys, which may be caused by motion artifacts that cause tissue mixing. Misclassified voxels were also found in the AKI kidneys. It is possible the kidneys were uniformly damaged and future histological correlation study is warranted to investigate the spatial distribution of injury in these kidneys.Conclusion
We developed a DNN-based CEST MRI classification model for accurately classifying injured and healthy renal tissues in three different AKI models. The classification model was capable of providing reliable prediction of kidney injury in spite of different injury mechanisms, and the results correlated well with SCr measurement.Acknowledgements
No acknowledgement found.References
- Schrier, R. W., Wang, W., Poole, B. & Mitra, A. Acute renal failure: definitions, diagnosis, pathogenesis, and therapy. The Journal of Clinical Investigation 114, 5-14, doi:10.1172/JCI22353 (2004).
- Liu, J. et al. CEST MRI of sepsis-induced acute kidney injury. NMR Biomed 31, e3942, doi:10.1002/nbm.3942 (2018).
- Kim, M., Gillen, J., Landman, B. A., Zhou, J. & van Zijl, P. C. M. Water saturation shift referencing (WASSR) for chemical exchange saturation transfer (CEST) experiments. Magnetic resonance in medicine 61, 1441-1450, doi:10.1002/mrm.21873 (2009).
- Zaiss, M. CEST sources, <http://www.cest-sources.org> (2014).
Figures

Figure 1. Illustration of the study design. Using the mean ROI Z-spectra of randomly selected kidneys from 4 groups (3 AKI kidneys and 1 control kidney), the proton pool parameters were computed by fitting the Z-spectral data to 5-pool Bloch equations. Then the fitted parameters were used to generate simulated Z-spectra, labeled with injured or healthy tissues, for training a binary-classifier DNN model. Finally, the established model performed classification and generated predictive maps on experimental datasets.

Figure 2. Conventional analysis for Z-spectra by using APTw (LD(+3.5ppm)) and rNOEw (LD(-3.5ppm)). The comparison between (A) LPS-AKI and healthy kidneys, (B) Gly-AKI and healthy kidneys, (C) IRI-AKI, unoperated and healthy kidneys. CEST MRI parameters were: CW saturation pulse (tsat =3 s, B1= 1.8 μT), and offset range = 4.5 ppm (step= 0.2 ppm). The B0 inhomogeneity maps were acquired using the WASSR method3 (tsat =0.5 s, B1= 0.5 μT, CW pulse).

Figure 3. Kidney classification using CEST MRI contrast of (A) APTw and (B) rNOEw parametric maps showing the kidneys of four representative mice from different groups. (C) Prediction maps of classification. Red regions are the voxels that were predicted to be injured, whereas blue regions are those predicted to be healthy.

Figure 4. Comparison of diagnostic efficiency of conventional CEST analysis method (A,B) and DNN-based classification (C). (A) and (B) Correlation with SCr levels for conventional LD(+3.5 ppm) and LD(-3.5 ppm) analyses. (C) DNN results. Correlation between classification ratio (predicted injured voxels /all voxels) and SCr levels. Correlation coefficients (|CC|) are shown in each subplot.
DOI: https://doi.org/10.58530/2022/4417