4415
CEST and ZAP Measurements of the Abdominal Organs
Vadim Malis1, Jirach Kungsamutr2, Won Bae1, Xiaowei Zhang1, Yoshimori Kassai3, and Mitsue Miyazaki1
1Radiology, UC San Diego, San Diego, CA, United States, 2Bioengineering, UC San Diego, San Diego, CA, United States, 3Canon Medical Systems Corp., Tochigi, Japan
1Radiology, UC San Diego, San Diego, CA, United States, 2Bioengineering, UC San Diego, San Diego, CA, United States, 3Canon Medical Systems Corp., Tochigi, Japan
Synopsis
Chemical exchange saturation transfer (CEST) is a molecular imaging technique for specific exchange of hydroxy (-OH, ~1.0 ppm), amine (-NH2, ~2 ppm), and amide (-NH, ~3.5 ppm), whereas ZAP is overall exchange protons of relatively free exchange protons (T2,f) and restricted protons (T2,r) from a wide frequency range of +/– 100 kHz. Combining CEST and ZAP to measure qualitative values of abdominal organ is aiming to be established.
Introduction
Chemical exchange saturation transfer (CEST) is a molecular imaging technique to detect specific exchange of hydroxy (-OH, ~1.0 ppm), amine (-NH2, ~2 ppm), and amide (-NH, ~3.5 ppm) which are processed to provide MTRAsym signals [1]. ZAP is overall exchange protons of relatively free exchange protons (T2,f) and restricted protons (T2,r) from a wide frequency range using two-pool compartments [2]. In general, MTRAsym signals in CEST are quite small a few percentages like ~2 – 4% in signals. ZAP shows two components of T2,f and T2,r, and their fractions Ff and Fr, respectively. The aim of our study is to establish quantitative CEST and ZAP measures of abdominal organs in healthy subjects.Methods
Five male volunteers (39 ± 17 years) were scanned on a clinical 3T scanner (Vantage Galan 3T, Canon Medical Systems, Japan) after obtaining IRB-approved written informed consent. Images were acquired with body and spine SPEEDER coils. The scanning protocol included two imaging series: (a) Water Fat Separation images (TE/TR = X (in-phase) and X (out-phase)/ 5.1 ms, NEX = 1, FA = 12°); FOV = 38×38 cm, matrix size 384×384, 20 5-mm thick slices, obtained in the axial orientation. (b) 2D single-shot FSE (TE = 10 ms, NEX = 1, FA = 90°) scanned with respiratory gating and magnetization transfer (MT) preparation pulses at 56 off-resonance frequencies ranging from –100 to +100 kHz, FOV = 38×30 cm, matrix size 384×356, single 5-mm thick slice, and B1rms of about 1-2 T. The following anatomies were identified from the in-phase image of (a) and were selected as regions of interest: liver, gallbladder, spine, spleen, iliocostalis muscles, and pancreas. The entire abdomen region was fit into eclipse divided into 8 segments with equal area. The segments of the ellipse were then used for consistent automatic separation of liver into segments. For each of the region B0 correction was performed prior to the analysis. Two-compartment model Z-spectrum fitting yielded several metrics such as apparent relaxation times (T2,f and T2,r) in free and restricted proton pools and their fractions (Ff and Fr) [2]. The images of the narrower range [-900 Hz, 900 Hz] were used to obtain CEST-spectrum and calculate MTRAsym.Results
Montage with the 56 offset frequencies images is demonstrated in Figure 1. An example of ROIs superimposed on the ZAP image along with the logarithmic Z-spectrum plots provided in Figure 2. Similar arrangement of CEST results is shown in Figure 3, but for the MTRAsym plots obtained from the narrow frequency range ± 7 ppm of CEST. Table 1 provides average values of ZAP and summarizes MTRAsym observations for all the anatomies in all 5 subjects.Discussion
We have successfully obtained CEST and ZAP values of organs in abdomen. Noticeable CEST peaks are spleen has peaks of (-OH) at 1 ppm and (NH2) at 2 ppm; vertebrate spine with distinct (NH) at 3 – 3.5 ppm; iliocostalis muscles with all OH, NH2, and NH peaks, at 1, 2, and 3.5 ppm; pancreas with -OH at 1 ppm, gallbladder without noticeable CEST peaks; and liver without noticeable CEST peaks. ZAP values are varied in T2,f such as gallbladder in around 2000 μs, liver 500 μs, muscle ~600 μs, pancreas ~900 μs, spleen 680 μs, and spine vertebrate of 630 μs. T2,r was varied less than 1 μs to 4 μs. Their relative fractions of Ff and Fr varied dependent of organs. Gallbladder stone shows quite different ZAP values of 9000 μs as compared to bile fluid of ~2000 μs. This irregularity and measures of CEST and ZAP may serve as abnormal biomarkers.Conclusions
General CEST and ZAP values of abdominal organs were measured. We will further investigate CEST and ZAP in the patients with abdominal diseases.Acknowledgements
Authors acknowledge the grant support from Canon Medical Systems Corp., Japan.References
[1] P van Zijl, N Yadav, Magn Reson Med 2011; Apr;65(4):927-48.
[2] Miyazaki M et al., PLOS ONE 2015; Mar;10(3): e0119915.
Figures
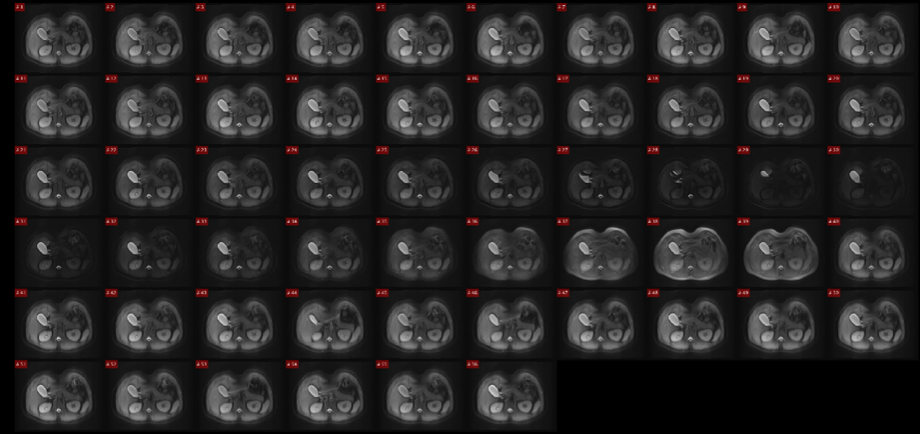
Figure 1. Montage of all images with 56 different offset frequencies between +/– 100 kHz. High saturation level can be visually appreciated for the image 29 corresponding to 0 offset.
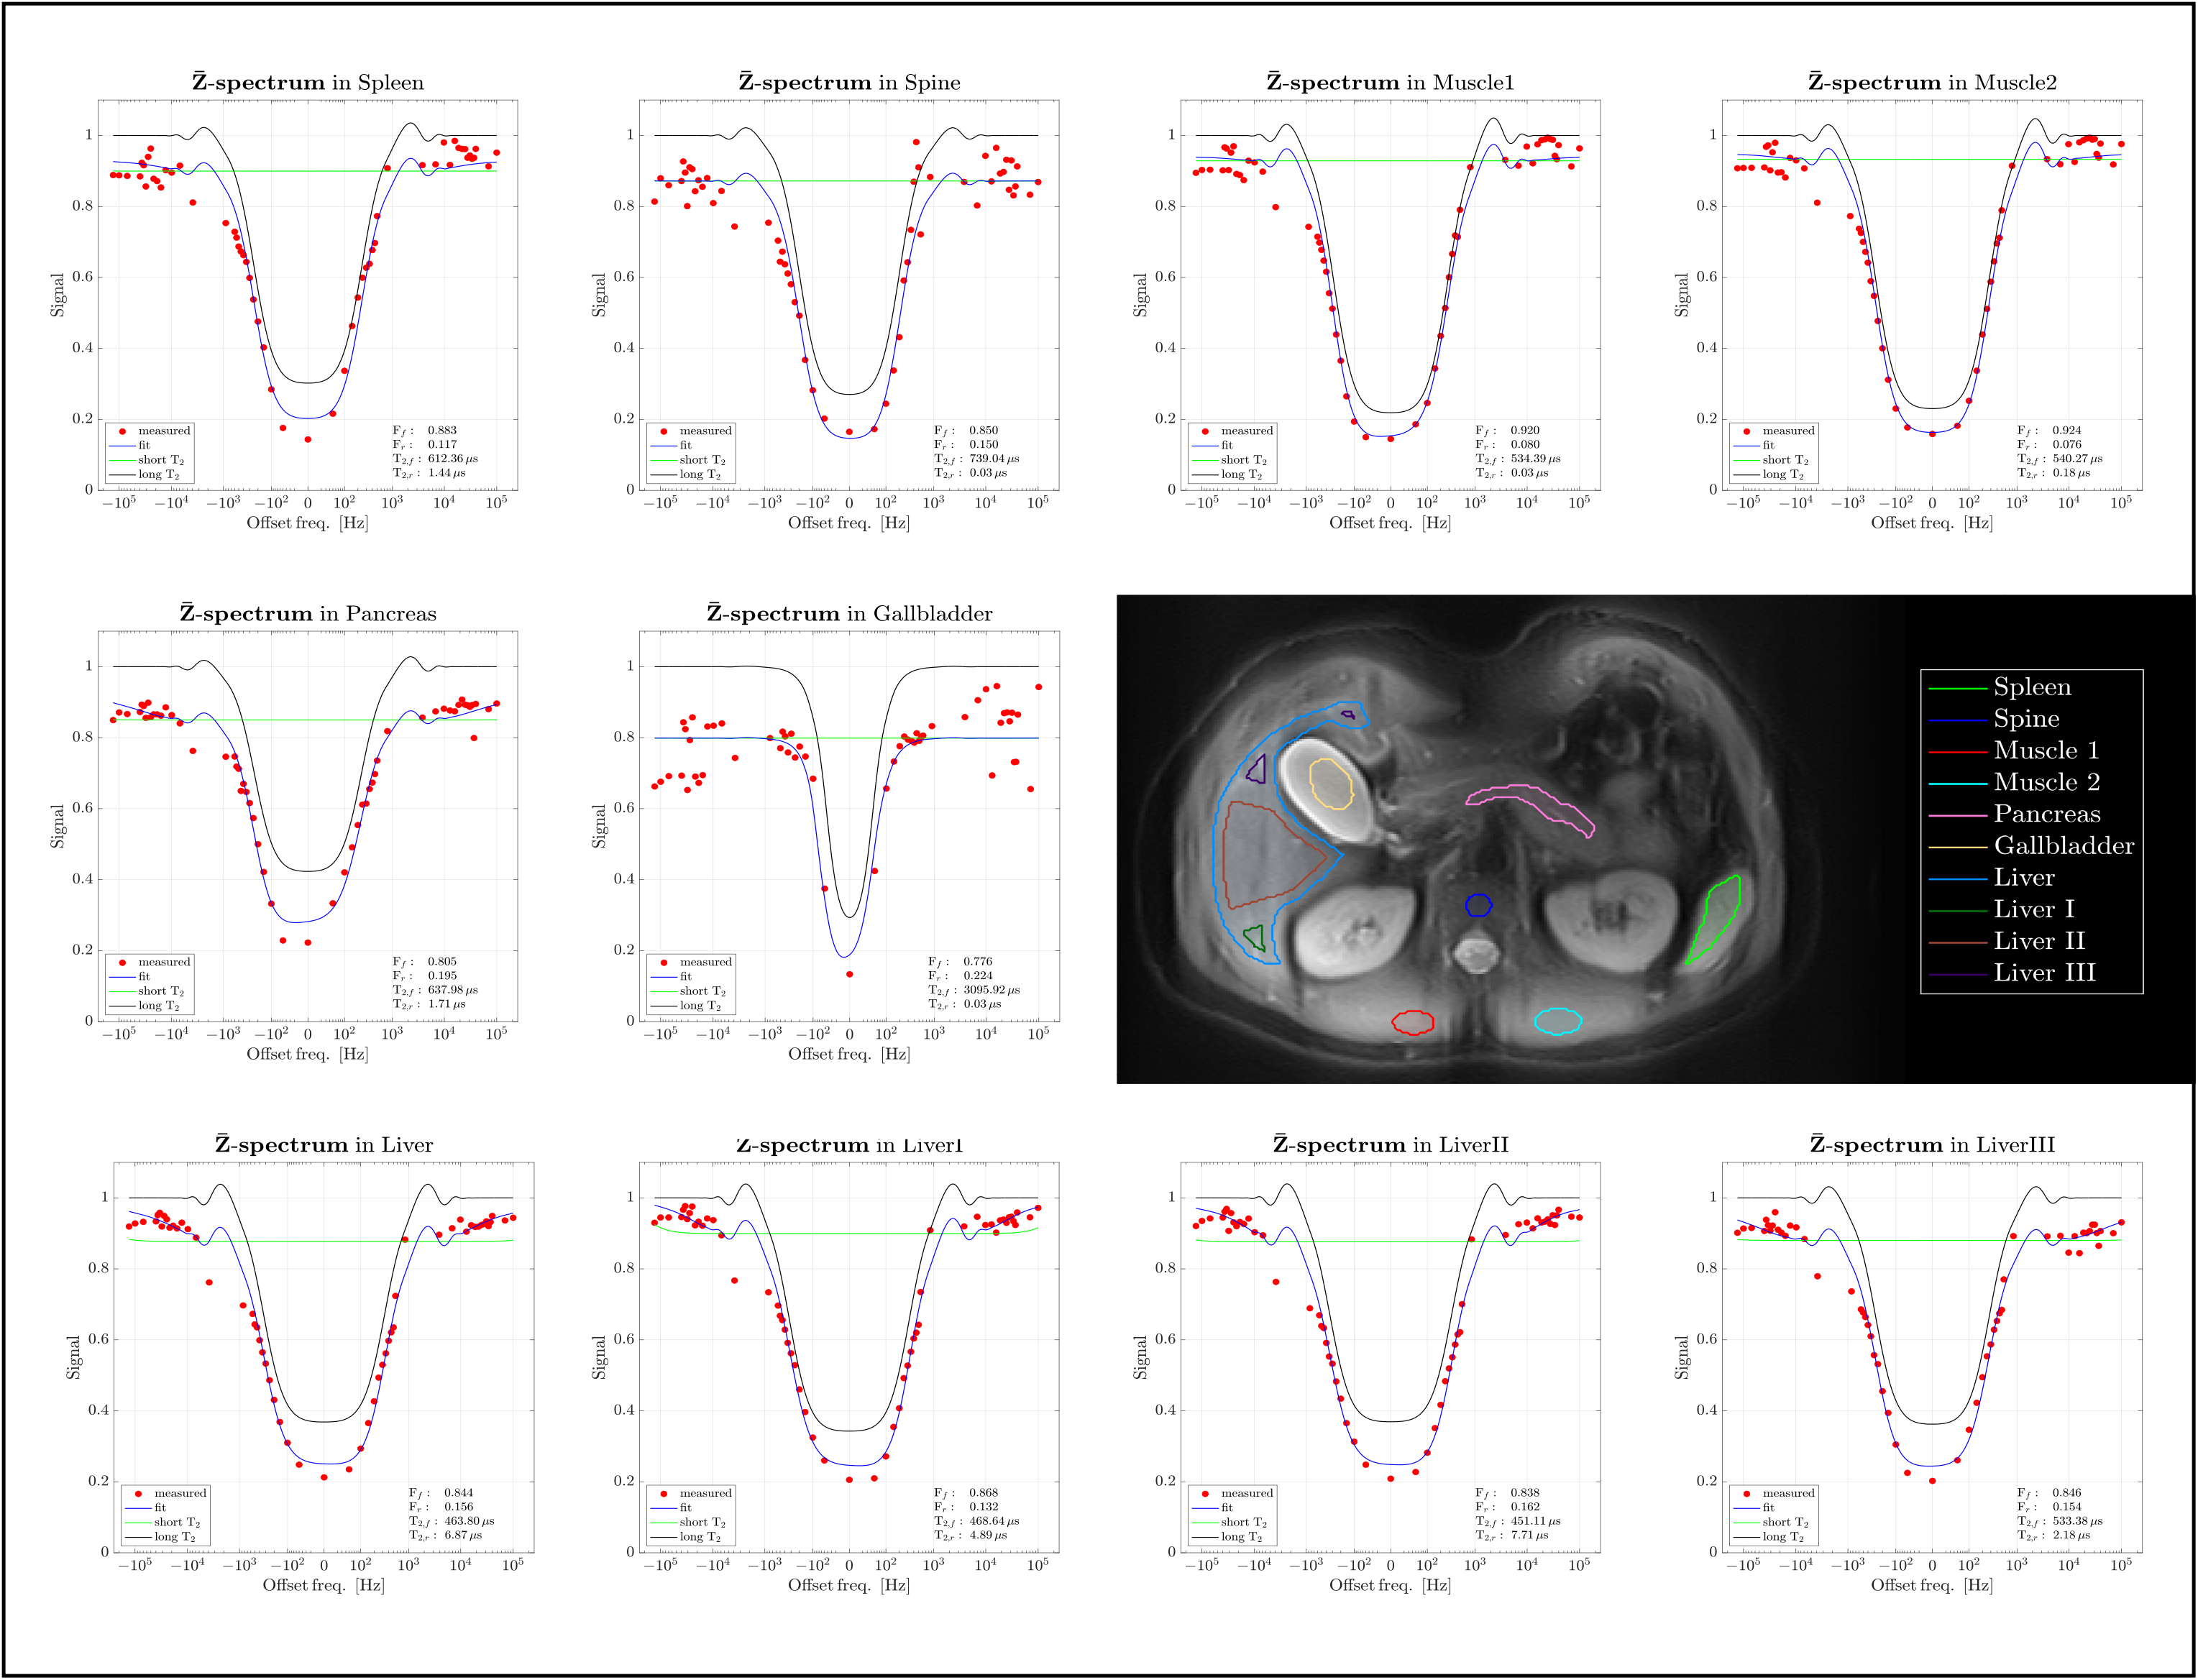
Figure 2. Z-spectrum plots with logarithmic frequency axis alongside the image with superimposed ROIs’ boundaries. All Z-spectra show quite good fits of two components of T2,f and T2,r.
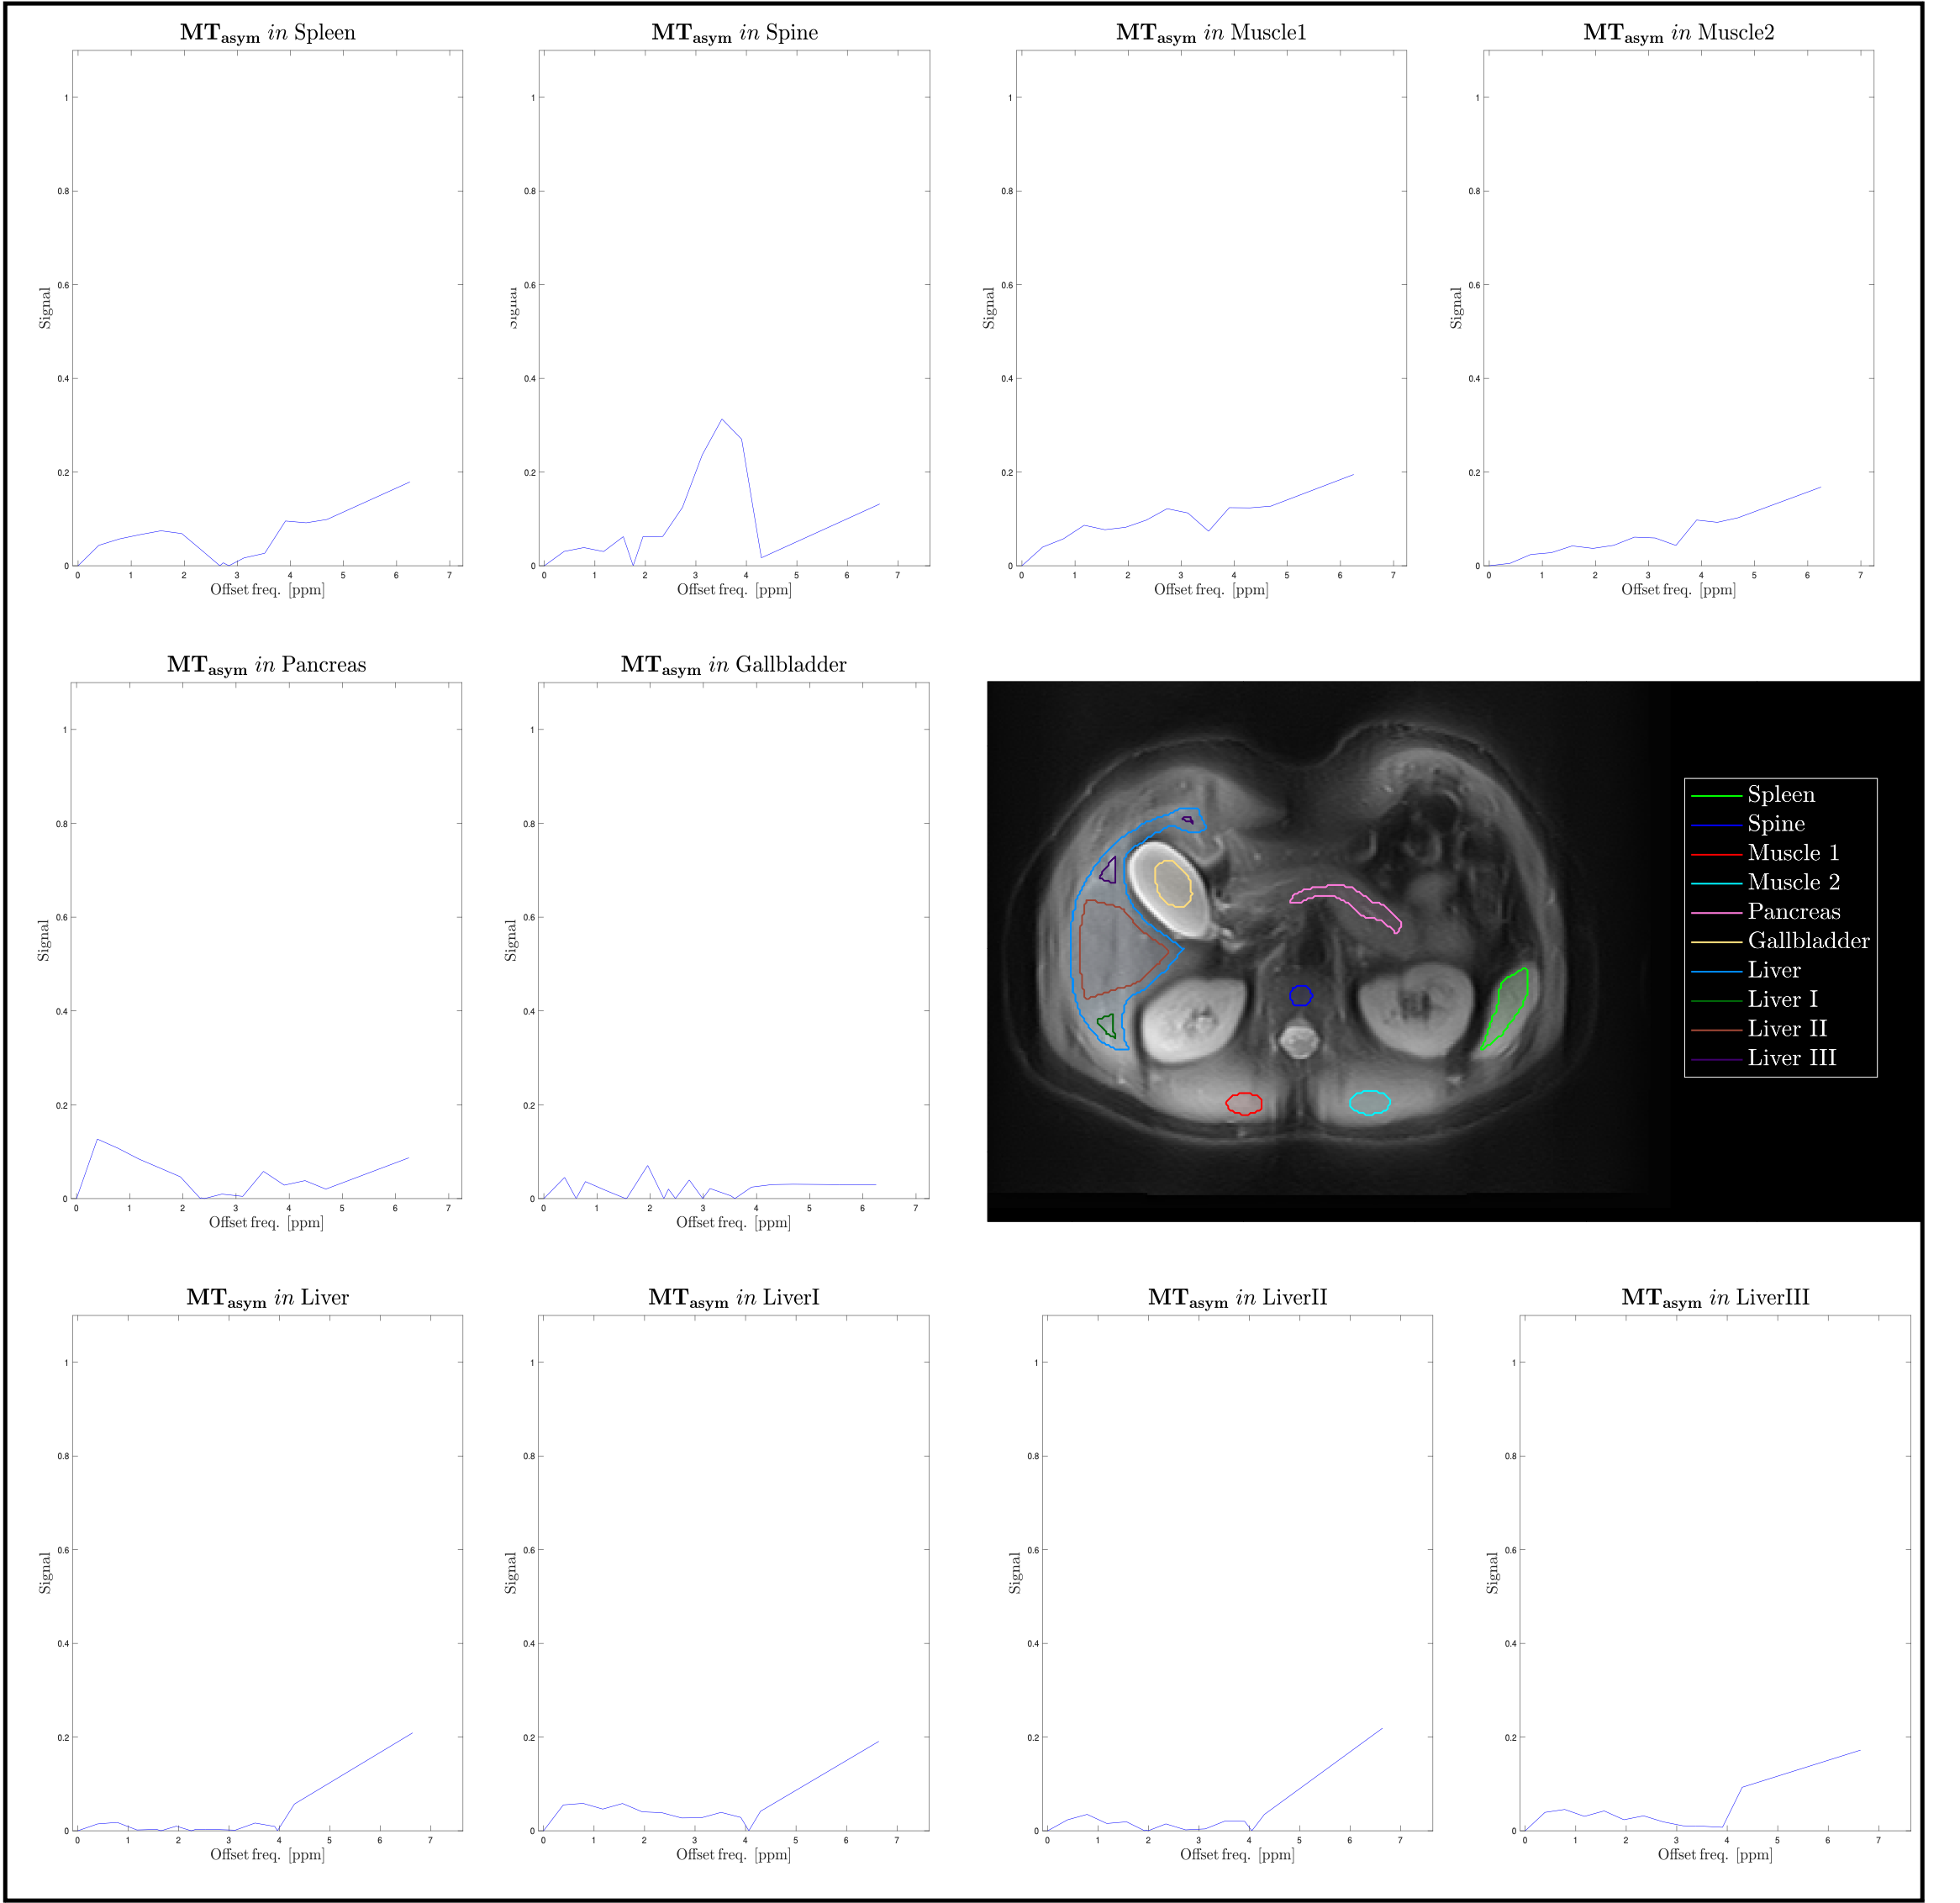
Figure 3. MTRAsym plots alongside the image with superimposed ROIs’ boundaries. Note that spleen has peaks of (-OH) at 1 ppm and (NH2) at 2 ppm; vertebrate spine with distinct (NH) at 3 – 3.5 ppm; iliocostalis muscles with all OH, NH2, and NH peaks, at 1, 2, and 3.5 ppm; pancreas with -OH at 1 ppm, gallbladder without noticeable CEST peaks; and liver with small OH, NH2, and NH CEST peaks.
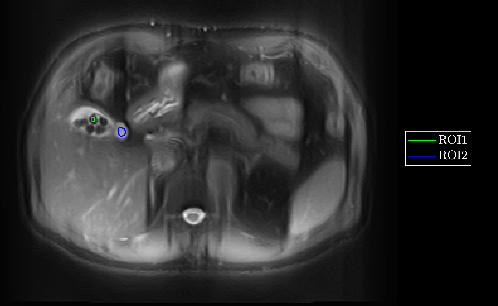
Figure 4. ZAP image of subject with gallbladder stones. ZAP values for two ROIs (ROI1 and ROI2) placed in gallbladder stone and bile fluid, respectively were measured.
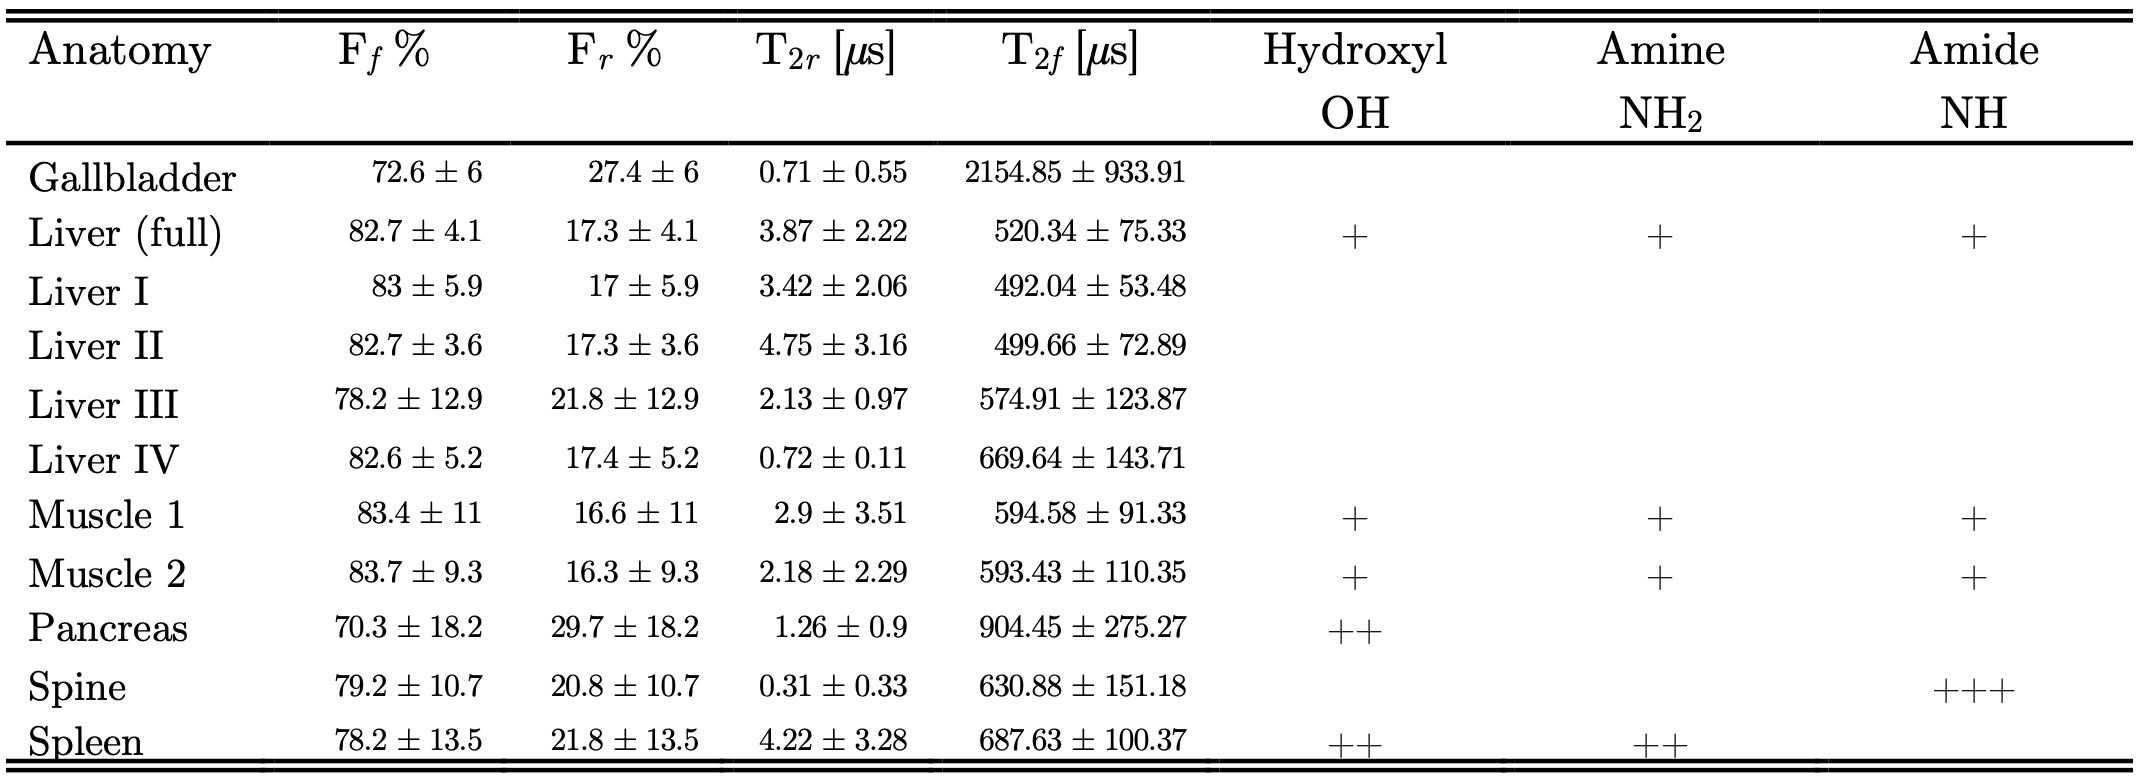
Table 1. Average values of ZAP and MTRAsym observations for all the anatomies.
DOI: https://doi.org/10.58530/2022/4415