4412
Quantitative mapping of Gd-DOTA accumulation in mouse brain by MRI after intraperitoneal administration - Validation by mass spectroscopy.1CRMBM UMR 7339, Aix Marseille University, CNRS, Marseille, France
Synopsis
Maps of the contrast agent concentration over time in mouse brains upon intraperitoneal administration were obtained by a dynamic MRI technique. The mice had different degrees of contrast agent accumulation clearly distinguishable on the maps with a particular distribution resembling the pathways of the glymphatic system. The average brain concentration computed 2 hours post contrast agent administration correlates with the gadolinium dosage in the brain by inductively coupled plasma mass spectroscopy proving that quantification is feasible although the signal analysis can be improved.
INTRODUCTION
The dynamic RSST1-MRI technique has been developed for cerebral blood volume fraction mapping and has demonstrated clinical potential 1 but has mainly been applied in preclinical studies 1,2. It requires a concentration of MRI contrast agents (CA) above a particular threshold and confinement to the blood pool to reduce the blood T1 below a critical value, which was initially achieved with intravenous CA injections 1-3. In mice, intraperitoneal (ip) CA administration is less invasive and leads to a lengthened measurement window which allows for pharmacological modulation 1. Here, the RSST1-signal being dependent on the tissue CA concentration, we aim to use this dynamic technique to detect regional blood brain barrier (BBB) opening and estimate the resulting accumulation of the CA in brain tissue. The quantification is however based on several NMR parameters that are not precisely known in tissue and likely region dependent. This pilot study aims at verifying at least the (semi-)quantitative nature of the measurement, by an MRI-independent quantitative method.METHODS
All procedures on animals were authorized by our local committee on ethics. Thirteen isoflurane anesthetized female mice (C57Bl6/J strain) were explored at 7T (PharmaScan 7/16 US, Bruker) using a whole-body volume coil for excitation and a 2x2-array cryocoil for reception. Following acquisition of a proton density (PD) weighted image 1, the CA was manually injected ip (10 mmol/kg Gd-DOTA, Guerbet) during continuous RSST1-MRI acquisition as described in ref 1 (3D inversion recovery spoiled fast gradient echo sequence, TR = 750 ms, TE 1.5 ms, TI = 295 ms, flip angle = 10°, TRecho = 5 ms, matrix 64 x 64 x 33, FOV 15 x 15 x 16.5 mm3). The total acquisition duration was two hours (300 repetitions). Seven mice were additionally administered a hyperosmolar solution of mannitol (20%, 5 g/kg, ip, Macopharma) 15 min after administration of the CA in an attempt to increase the permeability of the BBB to Gd-DOTA and achieve a higher accumulation in tissue. At completion of the scan, the mice were euthanized with saline-diluted pentobarbital (140 mg/kg ip, time to death <5 min), intracardially perfused with normal saline solution to prevent rupture of the BBB and further extravasation of the CA during sacrifice and the brain frozen at -80°. Thereafter, brains were desiccated, pulverized and mineralized. The average gadolinium concentration of the whole brains was measured by inductively coupled plasma mass spectroscopy (ICP-MS, AGILENT 7800 equipped with Agilent SPS4 autosampler). The PD-acquisition (SPD) being proportional to the magnetization at equilibrium M0, and the RSST1-signal (SRSST1) proportional to the longitudinal magnetization Mz 1,5, the following ratio is a function of the longitudinal relaxation rate R1 $$S_{RSST1} (t))/S_{PD} =M_z (t)/M_0 =1-[2 exp(-TI∙R_1 (t))/(1+exp(-TR∙R_1 (t))) ]$$This function is analytically non-invertible but conversion from Mz to R1 can be achieved by an iterative algorithm that we implemented in ImageJ to generate maps of R1. Maps of the tissue CA concentration C over time can be estimated assuming a linear relationship with the tissue R1 and values for the native relaxation rate R10 (set to 0.8 s-1) and the CA relaxivity in tissue r1 (set to 3.6 mM-1s-1, the r1- value for water at 7T and 37°) 6: $$C(t)=(R_1 (t)- R_{10})/r_1$$
An average brain CA concentration (in mM) was computed from the maps at 2 hours post CA injection following manual delineation taking care to exclude structures likely lost during brain harvest (e.g., cranial nerves) but including ventricles. The CA concentration was converted to gadolinium concentration in μg/g dry brain tissue using a ratio of dry brain to wet brain of 0.2 and a brain tissue density of 1046 g/l. A nonparametric test was used to analyze correlation.
RESULTS
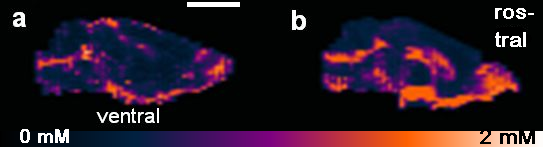
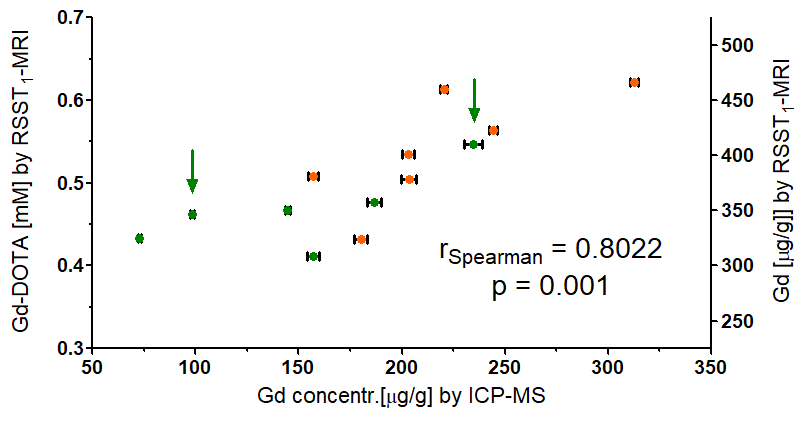
Figure 1 shows maximum intensity projections (MIP) of the CA concentration maps in the sagittal view for two mouse brains in which different degrees of CA accumulation were observed. The distribution of the CA seems to follow the glymphatic system 7 and ends up in the cerebrospinal fluid. Figure 2 shows that the average gadolinium concentration estimated by MRI correlates with the one obtained by ICP-MS.DISCUSSION
Despite several uncertainties (magnetic tissue parameters, brain tissue to exclude) in comparing the CA concentration obtained by MRI in vivo and ICP-MS ex vivo, the values correlate and are of the same order of magnitude. Indeed, the BBB becomes highly permeable once death occurs and it is uncertain whether the perfusion technique was efficient to avoid this bias. Also, we were unable to find out whether the ventricular CSF is preserved when the mouse is perfused. The values of the magnetic parameters are first estimates. A single average R1 value was used although R1 maps can be acquired in the same mouse to refine the quantification. The tissue CA r1 at 7 T is likely closer to 3 mM-1s-1 8,9 but hard to estimate locally. A two-compartment tissue model is necessary to estimate the distribution volume fraction beyond the vascular space.CONCLUSION
Despite approximation of multiple unknown tissue parameters during signal analysis, the RSST1-MRI technique allows to detect BBB opening qualitatively and CA accumulation semi-quantitatively as a function of time. Further methodological development is under way to assess the CA distribution volume fraction.Acknowledgements
We acknowledge France Life Imaging (grant ANR-11-INBS-0006 from the French “Investissements d’Avenir” program).References
1. Perles-Barbacaru AT, Lahrech H. A new Magnetic Resonance Imaging method for mapping the cerebral blood volume fraction: the rapid steady-state T1 method. J Cereb Blood Flow Metab. 2007;27(3):618-31.
2. Perles-Barbacaru TA, Tropres I, Sarraf MG, Chechin D, Zaccaria A, Grand S, et al. Technical Note: Clinical translation of the Rapid-Steady-State-T1 MRI method for direct cerebral blood volume quantification. Med Phys. 2015;42(11):6369-75.
3. Sarraf M, Perles-Barbacaru AT, Nissou MF, van der Sanden B, Berger F, Lahrech H. Rapid-Steady-State-T1 signal modeling during contrast agent extravasation: toward tumor blood volume quantification without requiring the arterial input function. Magn Reson Med. 2015;73(3):1005-14.
4. Perles-Barbacaru AT, Berger F, Lahrech H. Quantitative rapid steady state T1 magnetic resonance imaging for cerebral blood volume mapping in mice: Lengthened measurement time window with intraperitoneal Gd-DOTA injection. Magn Reson Med. 2013;69(5):1451-6.
5. Jivan A, Horsfield MA, Moody AR, Cherryman GR. Dynamic T1 measurement using snapshot-FLASH MRI. J Magn Reson. 1997;127(1):65-72.
6. Elst LV, Raynaud J-S, Vives V, Santus R, Louin G, Robert P, et al., editors. Comparative Relaxivities and Efficacies of Gadolinium-based Commercial Contrast Agents. Proc Intl Soc Mag Reson Med 21; 2013.
7. Xue Y, Liu X, Koundal S, Constantinou S, Dai F, Santambrogio L, et al. In vivo T1 mapping for quantifying glymphatic system transport and cervical lymph node drainage. Sci Rep. 2020;10(1):14592.
8. Noebauer-Huhmann IM, Szomolanyi P, Juras V, Kraff O, Ladd ME, Trattnig S. Gadolinium-based magnetic resonance contrast agents at 7 Tesla: in vitro T1 relaxivities in human blood plasma. Invest Radiol. 2010;45(9):554-8.
9. Shen Y, Goerner FL, Snyder C, Morelli JN, Hao D, Hu D, et al. T1 relaxivities of gadolinium-based magnetic resonance contrast agents in human whole blood at 1.5, 3, and 7 T. Invest Radiol. 2015;50(5):330-8.
Figures