4410
Quantitative multiple boli arterial spin labelling1EPIC, University of Leeds, Leeds, United Kingdom, 2GEMRIC, University of Glasgow, Glasgow, United Kingdom, 3Centre for Clinical Brain Sciences, University of Edinburgh, Edinburgh, United Kingdom, 4INP Grenoble - Phelma, Grenoble, France
Synopsis
The mbASL sequence is a hybrid between PASL and pCASL. It was shown to produce high SNR perfusion data. Quantification is crucial in order to produce accurate mbASL CBF maps. We have shown successful quantification by modifying the Buxton ASL kinetic model, optimising the number of pulses used for inversion and examining the optimal labelling slab thickness needed to maximise the SNR. We found CBF values that agree with current literature for mice and rats.
Introduction
Multiple boli arterial spin labelling (mbASL) uses a train of adiabatic pulses to label successive inversion slabs of arterial blood water. The sequence can be described as a hybrid between pseudo-continuous ASL (pCASL) and pulsed ASL (PASL). mbASL has been successfully used previously to produce high SNR ASL images1 and has potential to be used clinically. In this work we introduce a new mbASL kinetic model and systematically assess it using preclinical experiments in mice and rats. We highlight the hybrid pCASL/PASL nature of mbASL and compare the mbASL sequence with the commonly used FAIR sequence. Subsequently, we produce mbASL CBF maps which compare favourably with existing rodent CBF literature.Theory
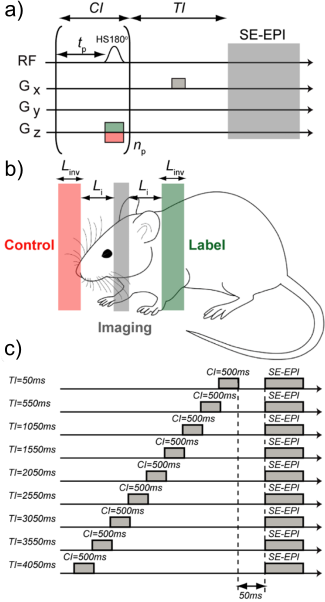
The Buxton PASL kinetic model for was modified to account for the train of adiabatic pulses (Figure 1). The arterial transit time , described as the time for blood to travel from the inversion slab to the imaging slice is given as and is the labelling slab thickness. The mbASL signal can be described by: ΔM(t) = fΣi = npi = 1 ΔMi, PASL(t) [1]Where, np is the number of pulses. The PASL kinetic model is described as: ΔMi, PASL (t) = 0 for 0 < t < δ
ΔMi, PASL (t) = 2Mb0(t - δ)αexp(-t/T1b)(exp(kt)(exp(-kδ)-exp(-kt)/k(t-δ)) for Δt < t < τ + Δt
ΔMi, PASL (t) = 2Mb0ταexp(-t/T1b)(exp(kt)(exp(-kδ)-exp(-k(t+δ))/kt) for τ + δ < t [2]
Where δ and τ are given by: δ = Li/Vblood [3]
And: τ = (Linv + Li)/Vblood [4]
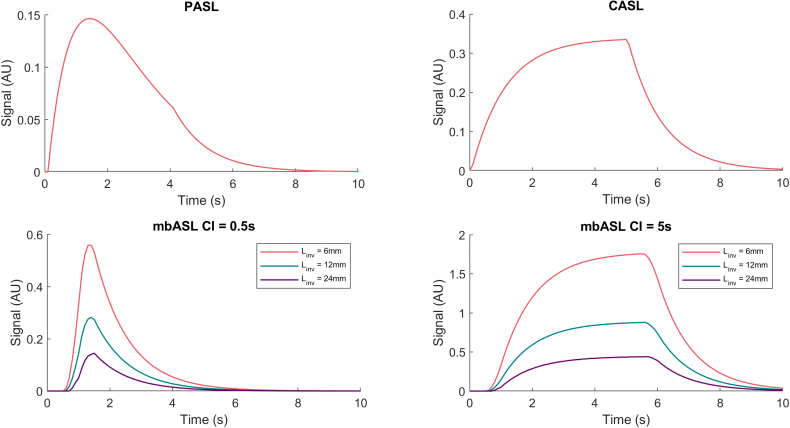
The mbASL kinetic model was used to demonstrate the hybrid nature of the sequence by varying the size of the inversion slab and varying the number of pulses used (Figure 2). The model demonstrates a pCASL distribution of signal at short labelling slab thicknesses, with the shape changing to similar to a PASL distribution at larger thicknesses.
Methods
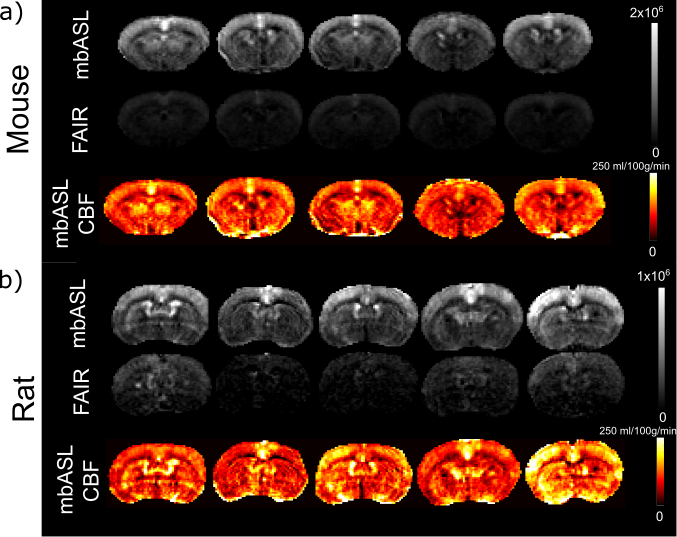
Experiments were conducted on C57 mice (n = 5) and rats (n = 5). Three inversion slab thicknesses for mice (Linv = 4, 8, 16 mm) and rats (Linv = 6, 12 , 36mm ) were chosen to explore. Experimental parameters were as follows: matrix of 96x96, with FOV = 1.76x1.76cm for mice and FOV = 2.5x2.5cm for rats. The imaging slice thickness was 1mm for mice and 1.5 mm for rats, centered at 4mm and 7mm posterior from the rhinal fissure respectively. The mbASL sequence uses a train of slice-selective hyperbolic secant (HS) inversion pulses (duration = 3.3ms, dimensionless amplitude parameter = 8, angular modulation = 760 s-1).The following experiments were conducted: A) The number of pulses used were varied to find an optimal number that gave sufficient signal. B) The inversion time was varied to examine the distribution of signal at various labelling slab thicknesses. C) mbASL and FAIR images were produced for comparison of ΔM signal. D) The mbASL kinetic model was used to produce quantitative cerebral blood flow maps at the chosen optimal labelling slab thickness.Results
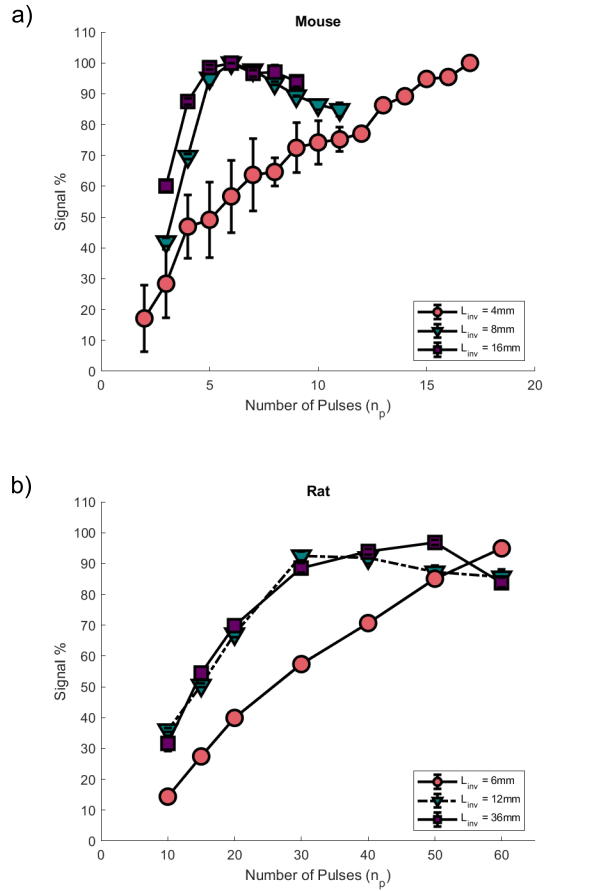
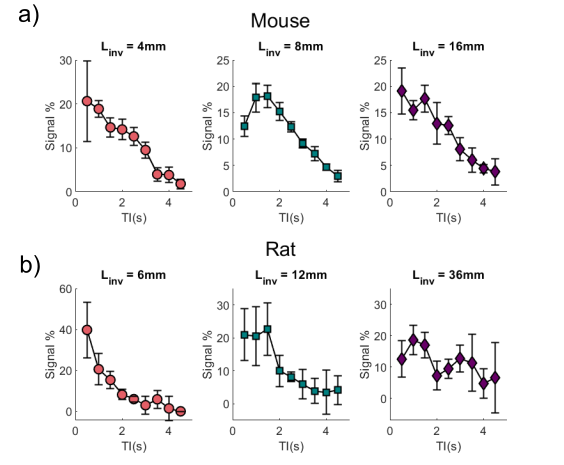
We optimised the mbASL SNR by finding the number of pulses that gave maximum signal for each labelling slab thickness. Figure 3 shows the increase in signal as the number of pulses is increased. The signal reaches a plateau when the number of pulses used gives a (pseudo)-continuous signal. The larger the labelling slab thickness, the less pulses are needed to reach this optimal signal. A larger number of pulses overall is needed for rats compared to mice. To highlight the hybrid nature of the mbASL sequence, we varied the inversion time. Figure 4 shows the peak signal shift as the labelling slab thickness is increased. For rats, the larger labelling slab thickness shows two peaks due to the heart circulation. This also allowed us to highlight the optimal labelling slab thickness. We compared the mbASL sequence against FAIR using perfusion maps, with the mbASL producing 367% higher signal in mice compared to FAIR and 275% in rats. These perfusion maps were used to produce quantitative CBF maps (Figure 5) with an average value for mice as 110 ml/100g/min and rats 120 ml/100g/min, which agrees with existing literature 2,3Discussion and Conclusion
We have successfully quantified and validated the mbASL kinetic model and demonstrate that the model can produce quantitative CBF maps with values agree with the existing literature. These experiments have demonstrated the hybrid nature of the sequence and have shown that the sequence can be readily optimized for used on different strains of rodents. We are able to produce sufficient signal whilst keeping within SAR limits, and this means the mbASL sequence is of interest to both pre-clinical and clinical users as robust alternative to other ASL sequences.Acknowledgements
This work was funded through EPSRC. Thanks also go to Mr. James Mullin, Mrs. Linda Carberry and Mrs. Lindsay Gallagher for their advice and assistance on animal setup and scanning protocols.References
1. Vallatos A, Gilmour L, Chalmers AJ, Holmes WM. Multiple boli arterial spin labeling for high signal-to-noise rodent brain perfusion imaging. Magn Reson Med 2018;79(2):1020-1030.
2. Wells JA, Siow B, Lythgoe MF, Thomas DL. Measuring biexponential transverse relaxation of the ASL signal at 9.4 T to estimate arterial oxygen saturation and the time of exchange of labeled blood water into cortical brain tissue. J Cereb Blood Flow Metab 2013;33(2):215-224.
3. Duhamel G, Callot V, Tachrount M, Alsop DC, Cozzone PJ. Pseudo-continuous arterial spin labeling at very high magnetic field (11.75 T) for high-resolution mouse brain perfusion imaging. Magn Reson Med 2012;67(5):1225-1236.
Figures