4409
Improved Harmonization of Renal T2 Mapping Between Vendors using Stimulated Echo Compensation1Department of Radiology, University of Cambridge, Cambridge, United Kingdom, 2Sir Peter Mansfield Imaging Centre, University of Nottingham, Nottingham, United Kingdom, 3Centre for Cardiovascular Science, University of Edinburgh, Edinburgh, United Kingdom, 4Department of Infection, Immunity and Cardiovascular Disease, University of Sheffield, Sheffield, United Kingdom, 5Neuroradiological Academic Unit, UCL Queen Square Institute of Neurology, University College London, London, United Kingdom, 6Dementia Research Centre, UCL Queen Square Institute of Neurology, University College London, London, United Kingdom, 7Wellcome Centre for Human Neuroimaging, UCL Queen Square Institute of Neurology, University College London, London, United Kingdom, 8Department of Radiology, Addenbrooke’s Hospital, Cambridge, United Kingdom
Synopsis
B1 inhomogeneity and non-ideal slice profiles introduce contributions from stimulated and indirect echoes into the multi-echo spin-echo (MESE) T2 mapping sequence, leading to variations in quantitative T2 values across scanners and vendors despite the use of a harmonised scan protocol. This study used an EPG-based fitting method to include corrections for stimulated-echo effects, applied to phantom and ‘travelling kidney’ data collected on scanners from three different MR vendors (GE, Philips, Siemens). Compared with conventional monoexponential fitting, EPG-based fitting substantially reduced the inter-scanner variations of T2 measurements. This improves the harmonization of the MESE T2 mapping sequence across MR scanner vendors.
INTRODUCTION
T2 mapping has been proposed as a potential tool for renal disease evaluation1. However, B1 field inhomogeneities and imperfect slice selection pulse profiles can lead to simulated and indirect echoes for a multi-echo spin-echo (MESE) sequence. This can impair T2 estimation accuracy and cause inconsistencies in measured T2 between different scanners with varying hardware and protocol implementations—which would be problematic for multi-centre clinical trials. Model-based methods using the extended phase graph (EPG) algorithm2 have been developed, which can estimate the transmit field and incorporate stimulated echo contributions for accurate T2 estimation3. This study aims to harmonize renal T2 measurements from a ‘travelling kidney’ study including three MR vendor scanners, using an EPG-based fitting method to reduce cross-vendor variations in both volunteer and phantom measurements.METHODS
Data was acquired on six healthy volunteers (age 32±6 yrs), with four scanned on each of the three 3T scanners of different vendors (GE, Philips and Siemens; randomly labelled Vendor 1, 2 and 3), while two volunteers only underwent scans on two vendors. Only one scanner (vendor 1) was equipped with a dual-channel transmit system. The ISMRM/NIST system phantom4 was used to evaluate the accuracy of T2 measurements against known reference values.Following initial harmonisation work5, a respiratory-triggered MESE sequence was harmonised across vendors: TR 1 breath (min 3000 ms), TE 12.9–129 ms in 12.9 ms steps, echo train length 10, refocusing flip angle 180°, FOV 38.4 cm, acquired matrix 128×128, 5 slices with thickness/gap of 4.5/1.0 cm, parallel imaging factor 3.
To evaluate T2 variations caused by B1 inhomogeneity and validate the flip angle maps estimated by the EPG model, separate B1 maps were acquired using the available B1 mapping scheme for each vendor (DREAM/ TurboFLASH B1 mapping /Bloch-Siegert method) (5). The acquired B1 maps were converted into the range [0, 1] to compare with the estimated B1 maps from the StimFit cB1 = (1− abs(FAnominal − FAactual)/ FAnominal).
Masks of whole kidneys, cortex and medulla were acquired based on harmonised native 5(3)3 MOLLI T1 map images and applied to the T2 maps for quantitative evaluation. The StimFit toolbox based on the EPG algorithm3,6 was used as a fitting model with stimulated echo compensation and compared with conventional monoexponential fitting using nonlinear least-squares. The EPG simulation used vendor-specific information about RF and gradient pulse shapes and timing.
RESULTS
Figure 1 compares the T2 measurement on the NIST phantom across the different vendors using exponential fitting and StimFit. The mean absolute percentage error (MAPE) was calculated in the physiologically relevant range (45–286 ms). Compared with exponential fitting, StimFit reduced the MAPE from 11.0%, 5.5% and 19.3% to 6.1%, 4.2% and 4.6% for the three vendors respectively.Figure 2 shows example T2 maps and cB1 maps from the same volunteer collected across the three vendors. In regions where the flip angle is close to the nominal value, the T2 maps agree well between fitting methods and between vendors. However, flip angle variations (non-ideal B1) caused overestimation by exponential fitting in the right kidney for vendor 1, the upper left kidney for vendor 2 and both kidneys for vendor 3. For vendor 3, in particular, a widespread low B1 (with 82.7% of the nominal flip angle) caused a global overestimate of T2 in all subjects. All these variations are largely corrected using StimFit which gives much more consistent T2 values between kidneys and between vendors. Also, the cB1 maps estimated by StimFit show similar features to the measured B1 maps.
Similar results were found for the other five volunteers. Figure 3 shows scatterplots of the T2 measurements in the left and right kidneys; the values are much more consistent, between kidneys and between vendors, for StimFit than for exponential fitting.
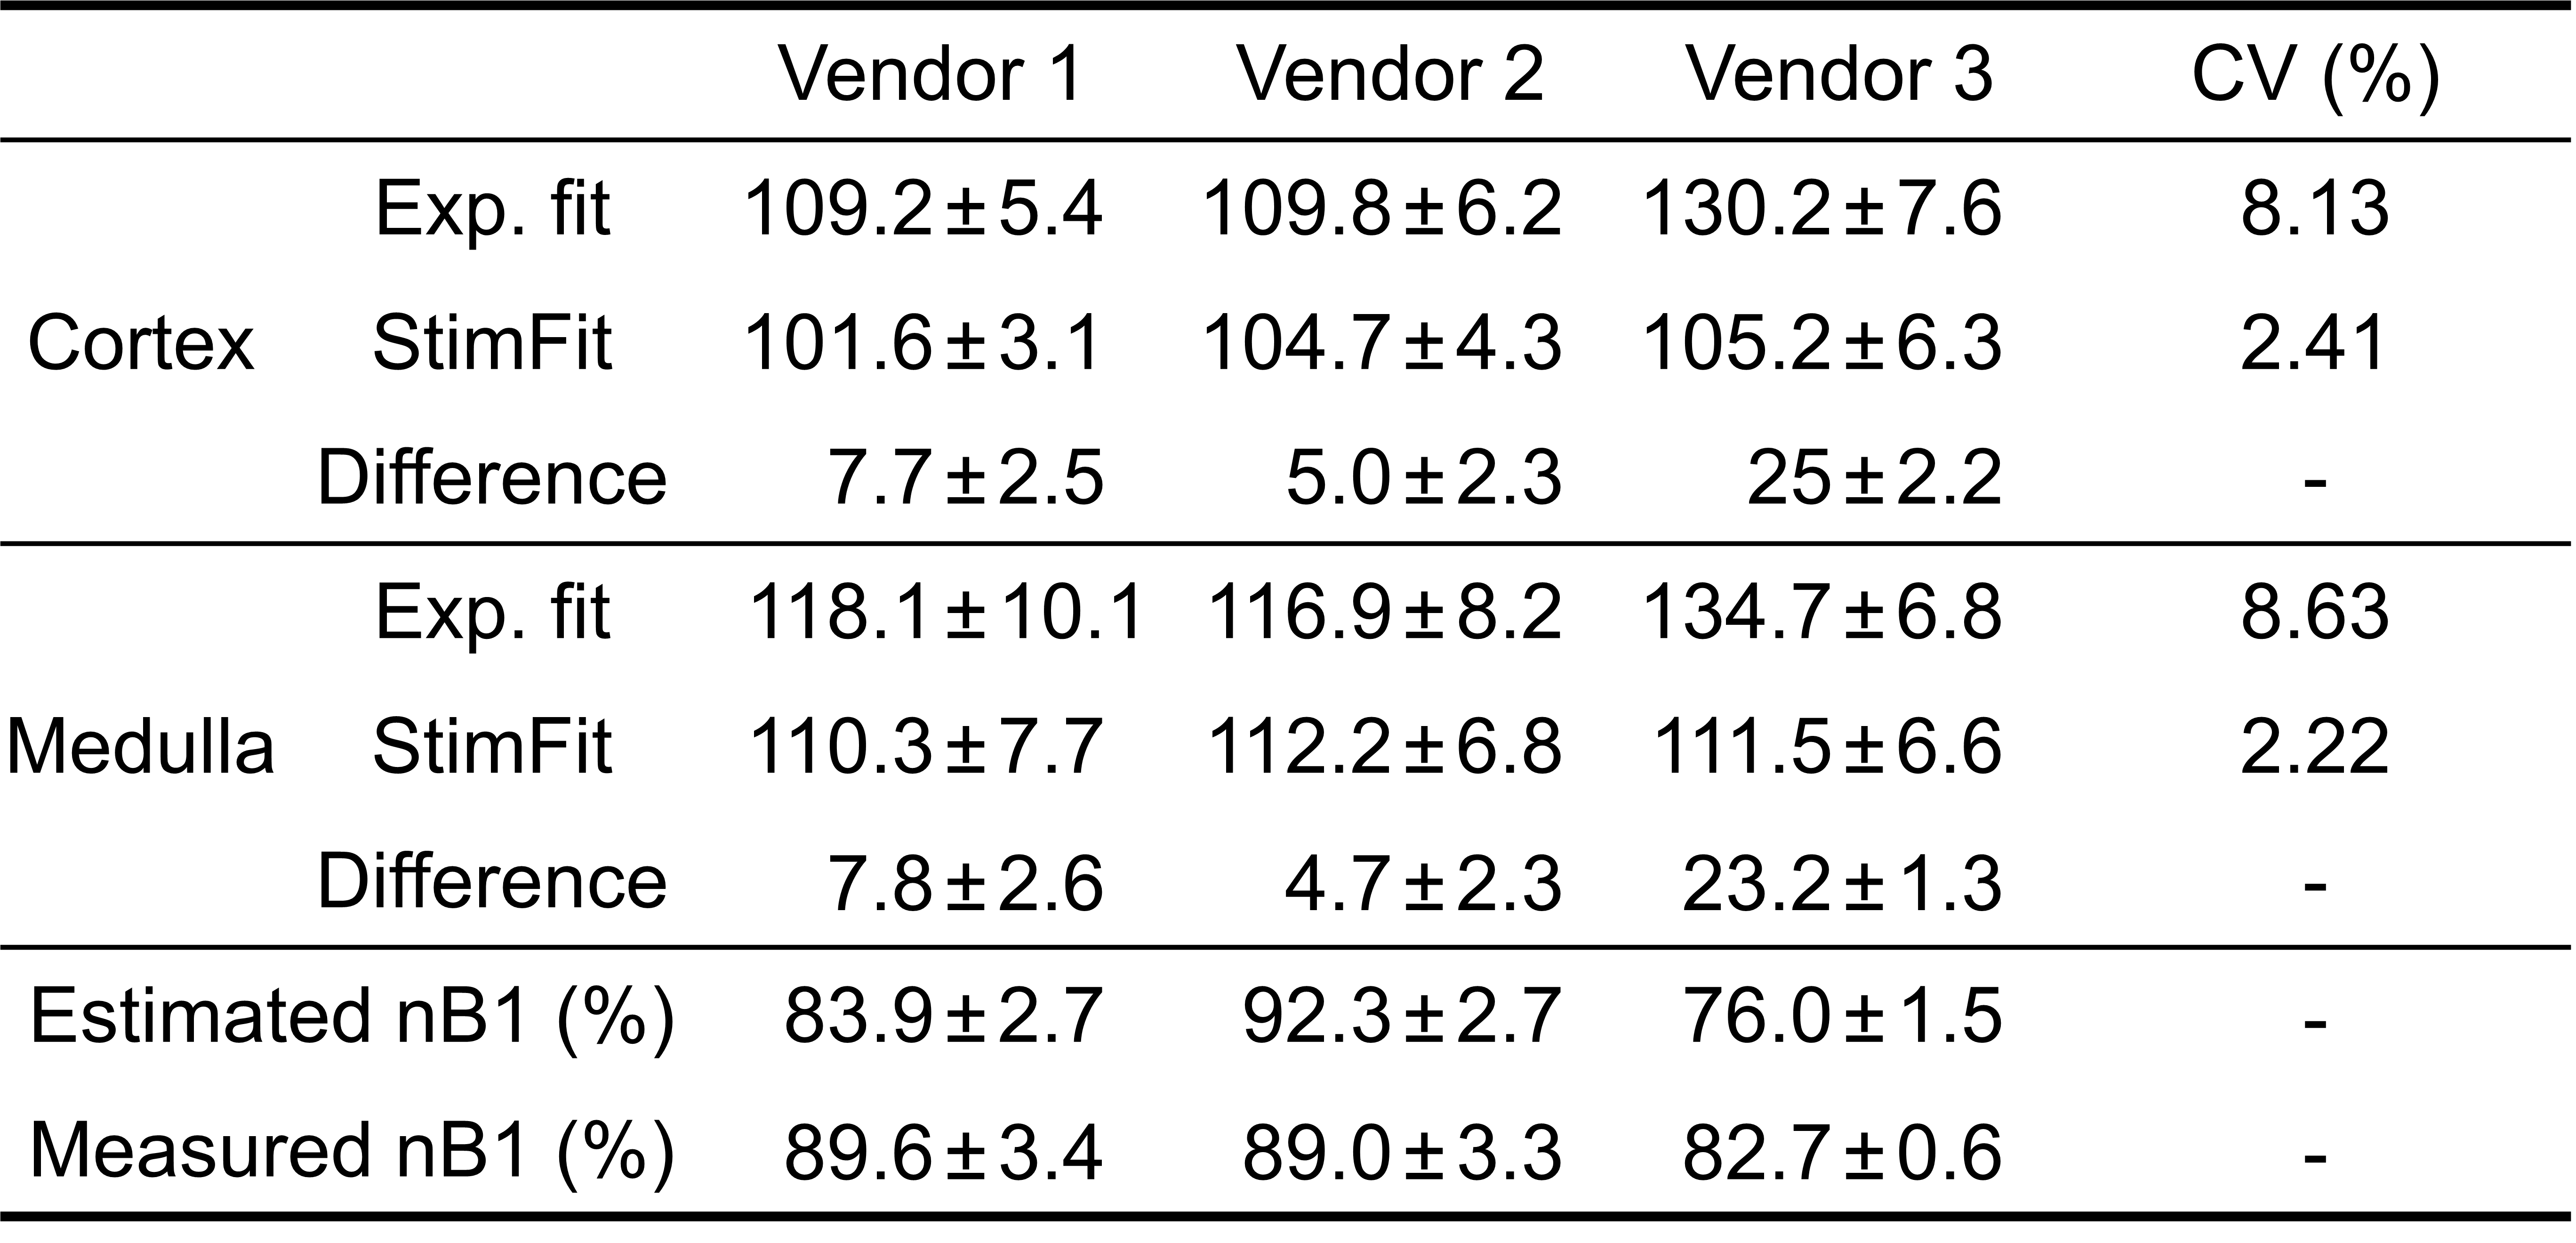
The T2 values in the cortex and medulla are summarised in Table 1 for the three vendors. The coefficients of variation (CV) across vendors were reduced from 8.13% (cortex) and 8.63% (medulla) with exponential fitting to 2.41% and 2.22% with StimFit. Corresponding reductions in inter-vendor bias and variance canT2 values also be observed in Bland-Altman plots showing the agreement between different vendors using the two fitting methods (Figure 4).
Discussion
We demonstrate a large variance in renal T2 mapping using a harmonised MESE scheme with exponential fitting, with up to a ~30 ms difference in whole kidney T2 in the same volunteer between vendors. This would substantially impair the reliability of T2 mapping as a potential disease biomarker.Variations observed between scans were all corrected by StimFit without additional knowledge or data input. The inter-vendor variations we observed are not necessarily specific to all scanners from these vendors, and can also relate to configuration issues such as using single or parallel transmit systems. The specific Vendor 3 scanner used in this study suffered B1 miscalibrations for all subjects, but this issue is less severe in our other measurements on different Vendor 3 systems. Future research will further investigate factors related to cross-site variation, as well as increasing the number of ‘travelling kidney’ scans.
CONCLUSION
Fitting with stimulated echo correction reduces inter-scanner T2 variations to aid the harmonization of the MESE T2 mapping measures across MR scanner vendors.Acknowledgements
This work was supported by the UK Medical Research Council (MR/R02264X/1) and NIHR Cambridge Biomedical Research Centre (BRC-1215-20014). The authors acknowledge Dr Ali Aghaeifar from Siemens Healthineers for providing RF pulse parameters.References
1. Wolf M, de Boer A, Sharma K, et al. Magnetic resonance imaging T1- and T2-mapping to assess renal structure and function: a systematic review and statement paper. Nephrol. Dial. Transplant 2018;33:ii41–ii50 doi: 10.1093/ndt/gfy198.
2. Hennig J. Multiecho imaging sequences with low refocusing flip angles. J. Magn. Reson. 1988;78:397–407 doi: 10.1016/0022-2364(88)90128-X.
3. Lebel RM, Wilman AH. Transverse relaxometry with stimulated echo compensation. Magn. Reson. Med. 2010;64:1005–1014 doi: 10.1002/mrm.22487.
4. Stupic KF, Ainslie M, Boss MA, et al. A standard system phantom for magnetic resonance imaging. Magn. Reson. Med. 2021;86:1194–1211 doi: 10.1002/mrm.28779.
5. Charlotte Buchanan, Hao Li, Fabio Nery, Alexander Daniel, João De Sousa, Steven Sourbron, Andrew N Priest, David L Thomas SF. Harmonisation of Multiparametric Renal MRI for Multi-Centre Studies. In: The 29th Annual Meeting of the International Society for Magnetic Resonance in Medicine. ; 2021.
6. Lebel RM. StimFit: A toolbox for robust T2 mapping with stimulated echo compensation. In: In: Proceedings from the 20th Annual Meeting of ISMRM, Melbourne, Australia. Vol. 37. ; 2012. p. 2558.
Figures