4407
Evaluation of 3D-QALAS Multiparametric Imaging with Compressed SENSE Acceleration1Philips Healthcare, Gainesville, FL, United States, 2University of Texas Southwestern Medical Center, Dallas, TX, United States, 3Mayo Clinic College of Medicine, Rochester, MN, United States
Synopsis
Simultaneous parametric mapping techniques like 3D-QALAS offer means for reliable measurement of T1, T2, and proton density while also offering the generation of standard imaging contrasts. 3D-QALAS has also been shown to provide consistent brain tissue segmentation and volumetric analysis. However, high-resolution 3D-QALAS scans suffer from long scan times. Applying acceleration techniques like compressed SENSE, which are highly effective at reducing 3D scan times, can bring 3D-QALAS scan times under 3-minutes. Here we evaluate the acceleration of 3D-QALAS using multiple compressed SENSE factors on scan times, image quality, multiparametric mapping, and volumetric analysis.
Introduction
3D-QALAS (3D-quantification using an interleaved Look-Locker acquisition sequence with a T2 preparation pulse) provides reliable measurement of T1, T2, and proton density values of the whole brain with high spatial resolution1. It has also shown consistent and reproducible results for measuring cortical thickness and subcortical structures2. Moreover, simultaneous multiparametric mapping techniques provide objective tissue property maps and post-processing can produce the normally acquired T1-weighted, T2-weighted, and FLAIR image contrasts3. Despite these benefits, 3D-QALAS scan times can be more than 10-minutes3. These long scan acquisition times make it difficult for 3D-QALAS to be well suited for everyday clinical use. Given the high compatibility of compressed sensing acceleration with 3D acquisitions3 we set out investigate the acceleration of 3D-QALAS using compressed SENSE on scan times, image quality, multiparametric mapping, and volumetric analysis.Methods
Five male subjects were scanned at 3T (Philips Elition X, Philips Healthcare, Best, Netherlands) using a 32-channel head coil. 3D-QALAS scans were acquired (FOV=242 x 242 x 192 mm, 160 slices, resolution= 1.2 x 1.2 x 1.2 mm, TE= 2.4 ms, TR= 5.3 ms, min TI= 8.9ms, TFE shots=74, TFE shot duration= 849.2 ms) with increasing compressed SENSE factors of 2 (scan time= 5:35), 4 (scan time= 2:48), 8 (scan time= 1:23), and 16 (scan time= 0:42). Images were post-processed using SyMRI software (SyntheticMR, Linköping, Sweden) to produce quantitative maps (T1, T2, and PD) including volumetric analysis (white mater, gray matter, cerebrospinal fluid, brain parenchymal volume, and intracranial volume). T1-weighted, T2-weighted, proton density, T2-FLAIR, dual inversion recovery (DIR), and phase sensitive inversion recovery (PSIR) images were also generated.Results
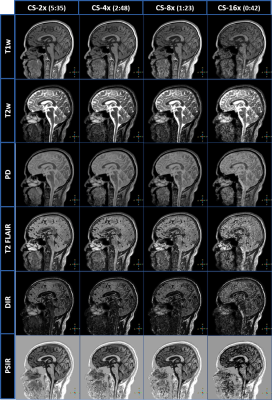
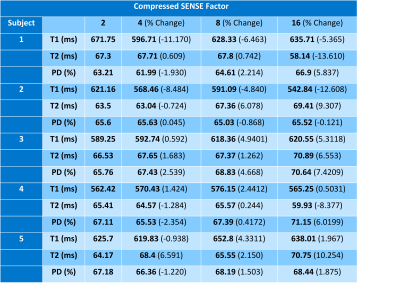
All acquired images and accelerations were able to be successfully post-processed using the SyMRI software. Figure 1 shows a sample of the synthetic image contrasts and image quality generated as a function of increasing compressed SENSE acceleration factors. Visual inspection of the generated contrasts for signal to noise and artifacts show adequate image quality up to an acceleration factor of 8. A compressed SENSE factor of 16 showed proper image contrasts but suffered from higher noise and ghosting artifacts resulting in the worst image quality of the evaluated acceleration factors. Similarly, the volumetric analysis showed that the compressed SESNE acceleration of 16 consistently showed the largest percent change for white matter and gray matter volumes compared to the compressed SENSE acceleration factor of 2 (table 1). However, brain parenchymal volume (BPV) and intracranial volume (ICV) remained largely unaffected by the compressed SENSE acceleration factor. ROI analysis of the splenium of the corpus callosum was done to assess quantitative T1, T2, and PD maps across the increasing compressed SENSE acceleration factors (table 2). A similar trend of higher acceleration factors leading to larger percent changes in T1, T2, and PD values was also seen with the quantitative mapping data. However, this variability based on compressed SENSE acceleration factors for tissue volumes and quantitative maps still showed consistently less than a ±5 percent change for acceleration factors of 4 and 8.Discussion
A recent study looked at applying a compressed sensing factor of 2 to 3D-QALAS brain imaging bringing the scan time down to approximately 6-minutes with no significant differences in image quality3. While this is a dramatic improvement these long scan times remain a hurdle for widespread clinical adoption of 3D-QALAS. Here we applied compressed SENSE with factors beyond 2 to evaluate image quality and the effect on post-processing image analysis. Applying an acceleration factor of 4 produced a 2:48 scan time with no evidence of significant differences in image quality, volumetric analysis, and quantitative maps. Pushing the compressed SENSE acceleration to 8 yielded synthetic image contrasts with a higher noise profile yet were still clinically diagnostic with a 1:23 scan time. The higher noise led to a slightly larger percent change in the volumetric and quantitative maps. While synthetic image contrasts, volumetric analysis, and quantitative maps were able to be generated with the compressed SENSE factor of 16, image quality was the most degraded out of all factors tested. Further analysis and evaluation of smaller incremental increases of compressed SENSE and 3D-QALAS are needed to find the ideal relationship between acceleration and reliability.Conclusion
Use of 3D-QALAS with compressed SENSE can be used to achieve clinically viable scan times while maintaining image quality. Drastically lowering the acquisition time of simultaneous multiparametric mapping techniques like 3D-QALAS to below 3-minutes could lead to more widespread clinical adoption.Acknowledgements
No acknowledgement found.References
1. Fujita, Shohei, et al. "Three-dimensional high-resolution simultaneous quantitative mapping of the whole brain with 3D-QALAS: an accuracy and repeatability study." Magnetic resonance imaging 63 (2019): 235-243.
2. Fujita, Shohei, et al. "3D quantitative synthetic MRI‐derived cortical thickness and subcortical brain volumes: Scan–rescan repeatability and comparison with conventional T1‐weighted images." Journal of Magnetic Resonance Imaging 50.6 (2019): 1834-1842.
3. Fujita, Shohei, et al. "Accelerated isotropic multiparametric imaging by high spatial resolution 3D-QALAS with compressed sensing: a phantom, volunteer, and patient study." Investigative radiology 56.5 (2021): 292.
Figures


