4406
Automatic Quantification of Enlarged Perivascular Space aided with Super-resolution 2D T2 images1Diagnostic Radiology and Nuclear Medicine, University of Maryland School of Medicine, Baltimore, MD, United States, 2Electrical and Computer Engineering, Johns Hopkins University, Baltimore, MD, United States
Synopsis
The perivascular space (PVS) is key to brain waste clearance and brain metabolic homeostasis. Enlarged PVS (ePVS) can be automatically quantified reliably by combining the 3D T1w and 3D T2w images to produce enhanced PVS contrast followed with frangi filtering and thresholding. However often times only 2D T2w images are available, especially in clinical exams. In this study, we investigate the feasibility of using an innovative deep learning based super-resolution technique (SMORE) to produce 3D T2w images (SR T2) for ePVS quantification. We show that the SR T2 volume provided comparable ePVS estimation as a 3D T2 volume.
Introduction
The perivascular space (PVS) is key to brain waste clearance and brain metabolic homeostasis. The PVS typically becomes visible on MRI when enlarged, as hyper-intensity on T2-weighted MRI images. Enlarged PVS (ePVS) has been associated with dementia and Alzheimer’s Diseases [1-3]. Quantification of ePVS is however challenging and is typically qualitatively assessed by identifying focal hyper intensity spots on T2w MRI images. Recently Sepehrband et al. [4] proposed an automatic image processing methods to enhance PVS visibility and quantification using 3D volumetric T1w and T2w images. While 3D T1w acquisition are often available, clinical exams often only acquire 2D T2w images instead of 3D isotropic resolution images. Recently developments in super-resolution methods with deep learning (SMORE)[5,6] was introduced by our group . In this study, we investigate the use of SMORE to enhance the 2D T2w images to aid in ePVS quantification and compare the results using the 3D T1w volume only.Methods
Data acquisition: On 30 recruited volunteers (Age: 36±17yrs, range: 19-74yrs, 15M/15F), we acquired 3D T1w, 3D T2w and 2D T2w acquisitions in the same imaging session on a 3T Siemens Prisma scanner with a 64ch head neck coil. Both the 3D T1 and T2 were acquired with 1mm3 isotropic resolution, 256mm FOV and 176 sagittal sections. 3D-T1w: TE/TR/TI = 3.37ms/4000ms/1400ms, FA = 6⁰, BW = 200Hz/Px. 3D-T2w: TE/TR = 349ms/3200ms, Turbo factor 280, BW = 781 Hz/Px. 2D T2 sequence was taken from a standard clinical exam protocol. 26 axial slices (5mm thickness with 1mm gap) with 230mm FOV. TE/TR = 85ms/5820ms, in-plane resolution 0.4mm x 0.4mm, Turbo factor 13, BW = 195 Hz/Px.Image processing: The 3D T1w & T2w images were processed using the Human Connectome Project (HCP) pipeline [7], which include registration and sub-cortical segmentation with Freesurfer. T1w and T2w volumes were further intensity normalized using histogram normalization module in the Quantitative Imaging Toolkit (QIT) [8]. ePVS quantification was performed as in [4] where an enhanced perivascular contrast (EPC) image was calculated first, followed by Frangi filter and thresholding. ePVS values were calculated within the whole brain white matter, as well as in 70 subregions from segmentation results. ePVS volumes calculated from the pair of 3D T1w and 3D T2w were considered as the ground truth.
For the 2D T2w acquisition, images were first processed using the SMORE pipeline [5] to generated super-resolution T2w volume (SR T2). SMORE is a self-super-resolution algorithm that uses the high-resolution in-plane slices to train a super resolution network and then applies it in the through-plane directions. The training data were created by blurring the in-place patches to match the through-plane resolution, with the FWHM of the blurring filter designed based on the estimated slice profile by ESPRESO [6]. Following obtaining the SR T2 to substitute as the 3D T2, the same image processing steps were used for ePVS quantification.
With a slightly different pipeline skipping the EPC image calculation, ePVS could also be quantified using the 3D T1w images only. ePVS from T1 only was calculated to provide a comparison basis in absence of T2w volume.
Results
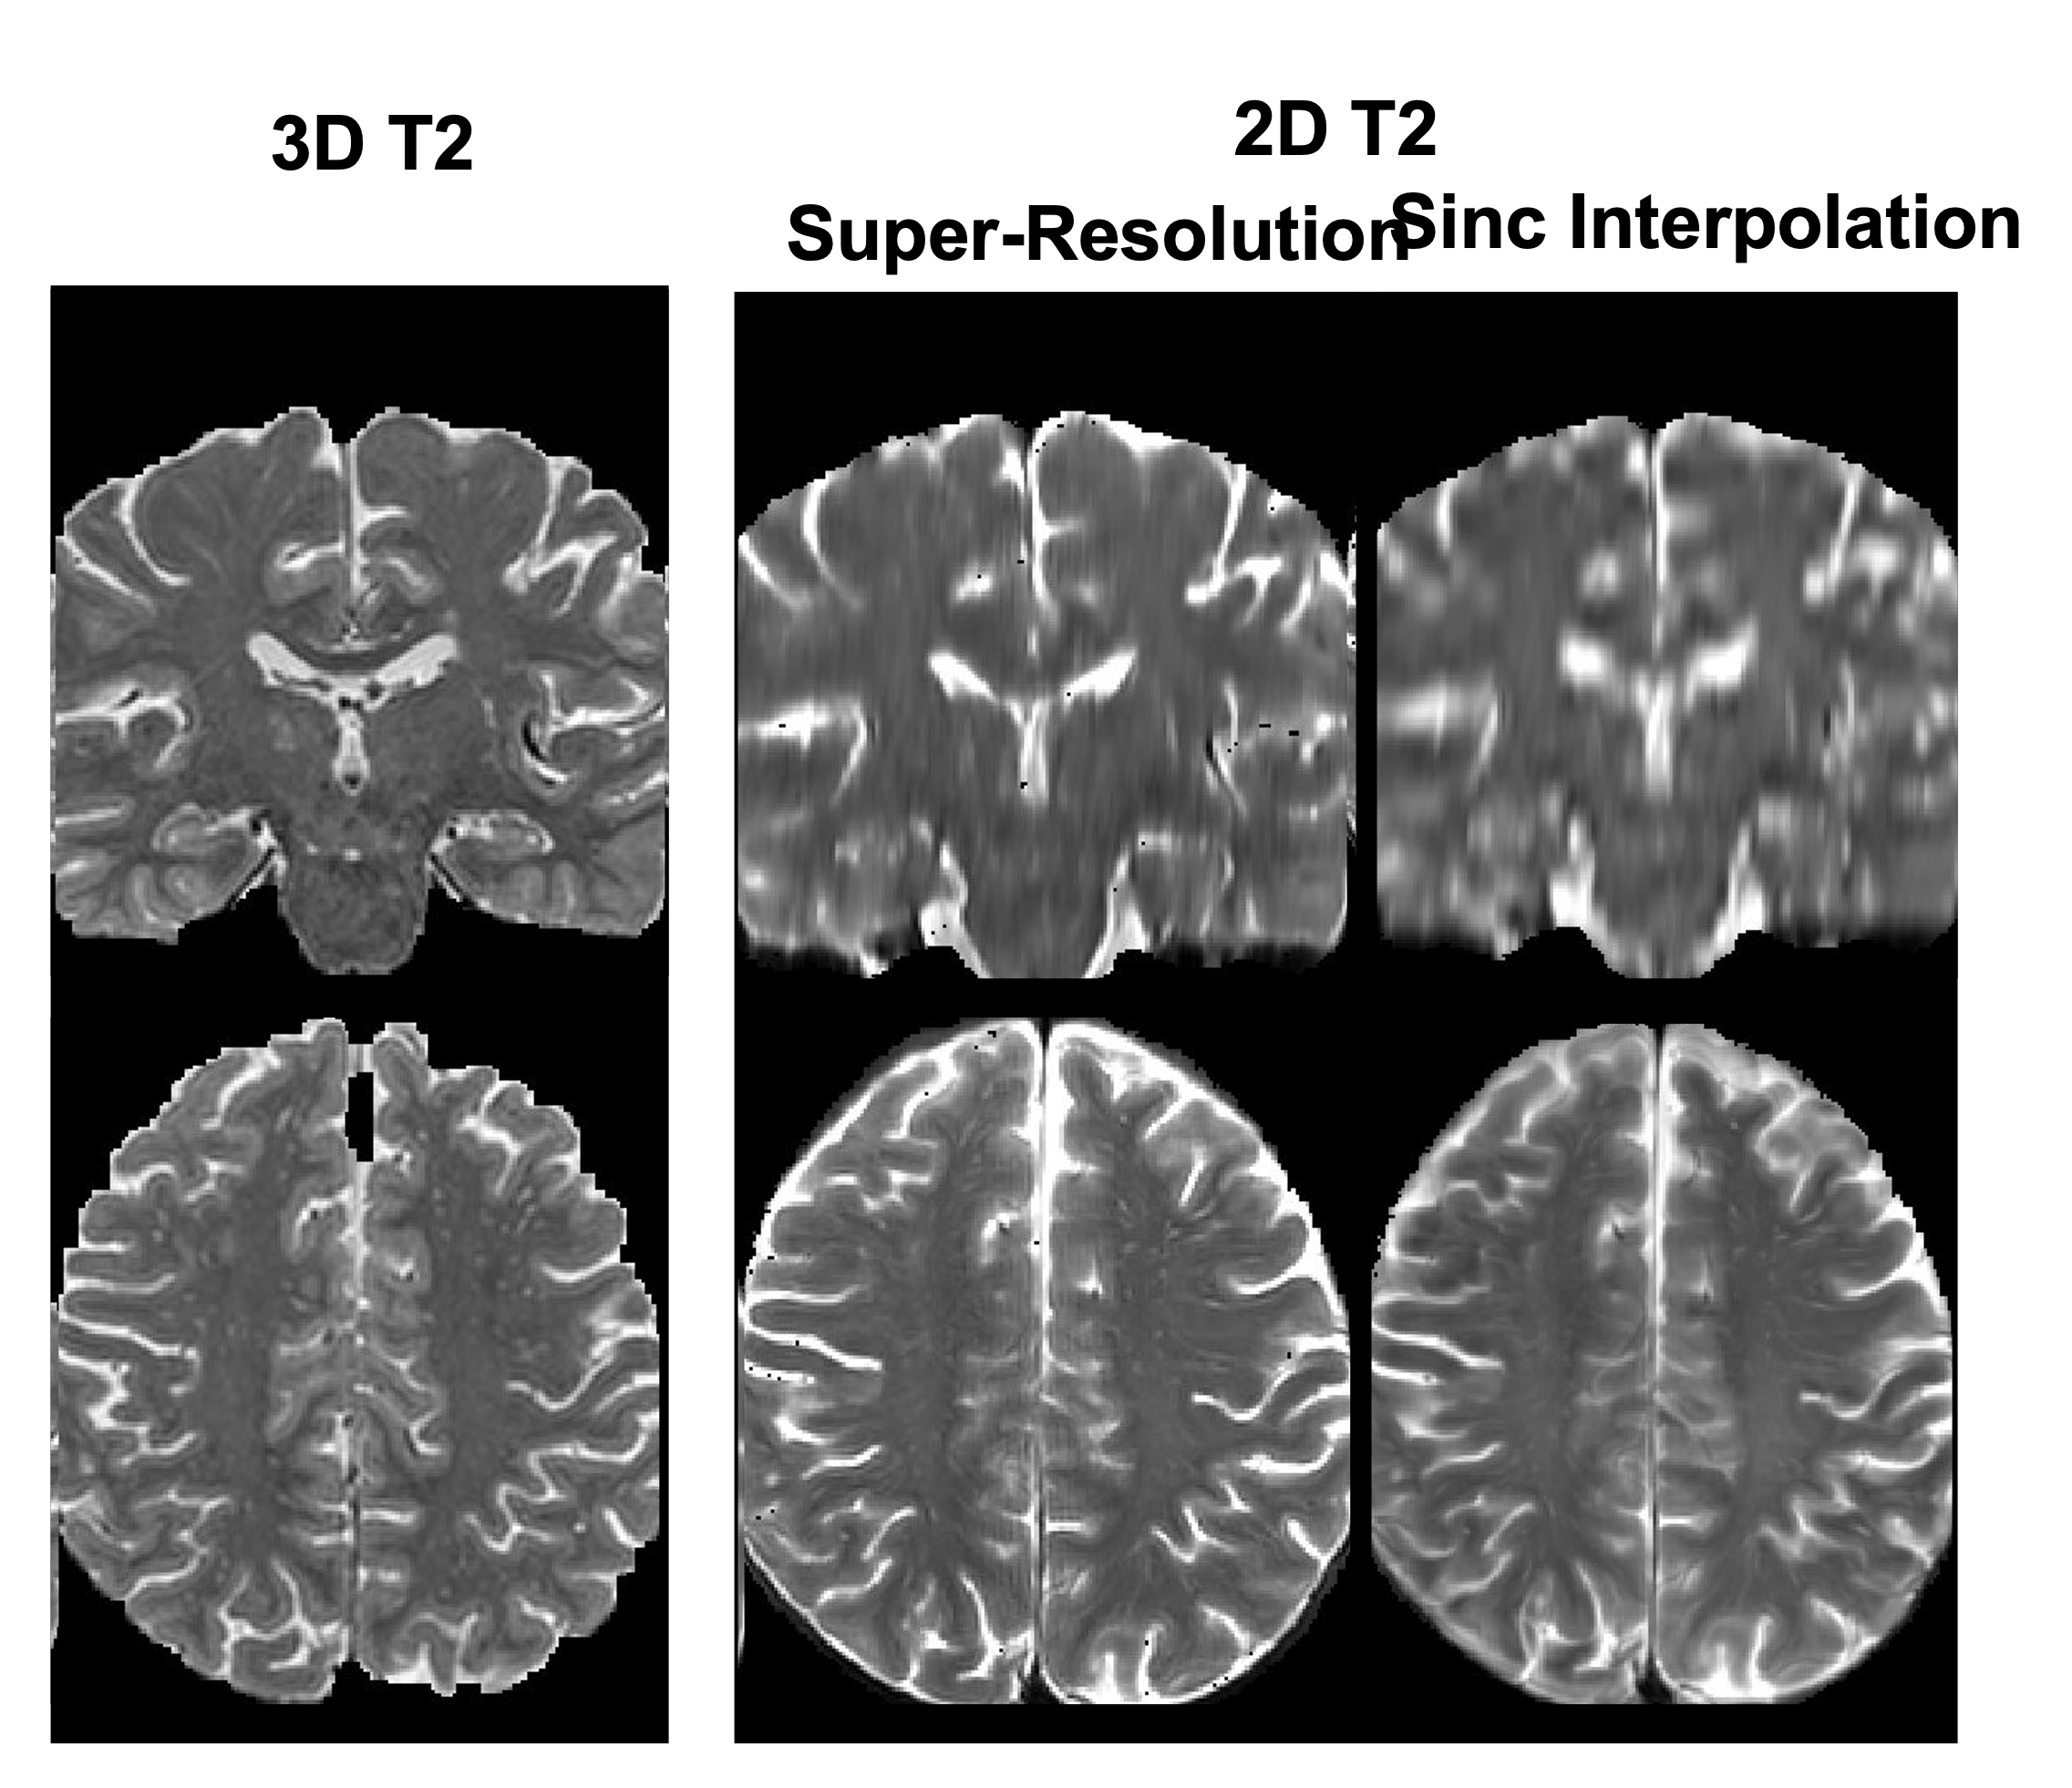
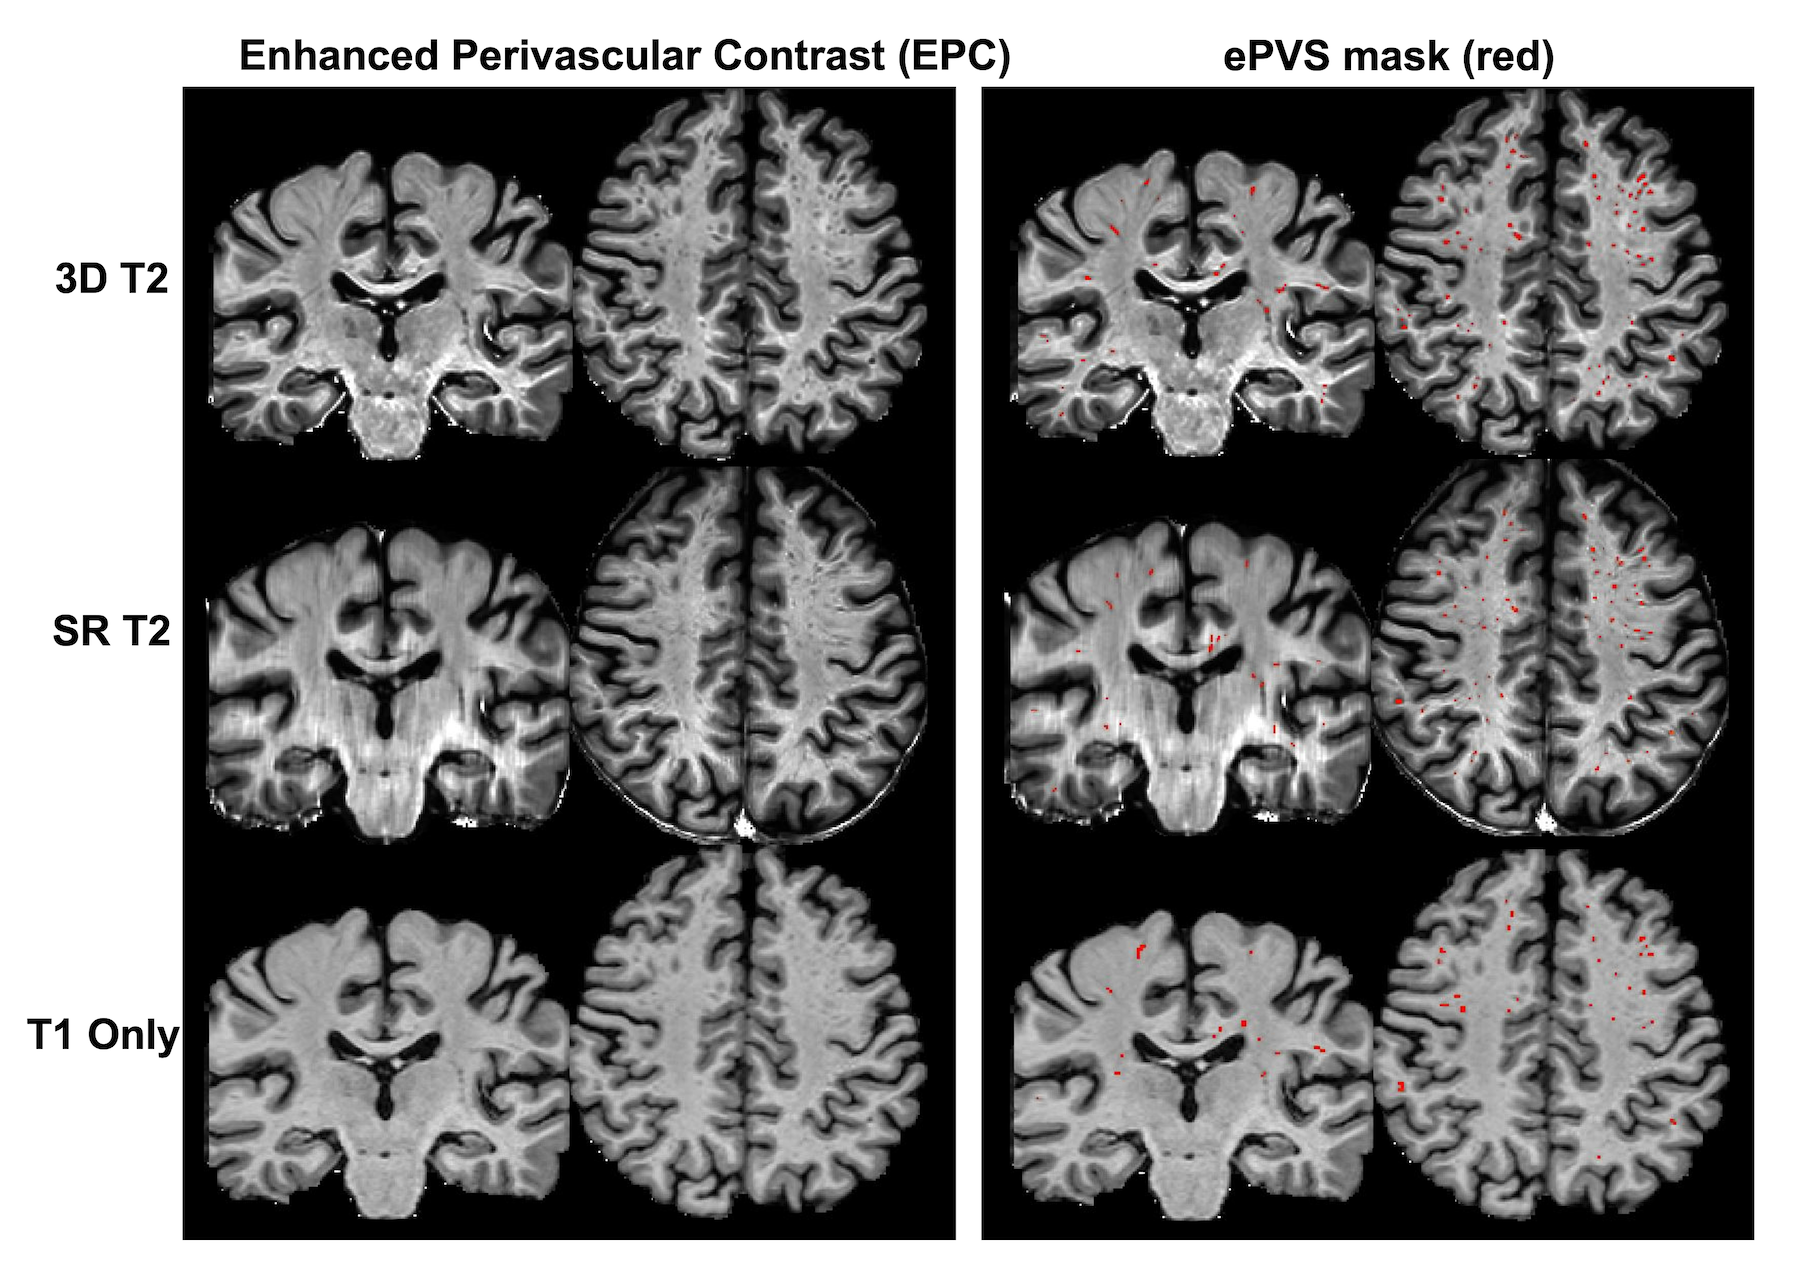
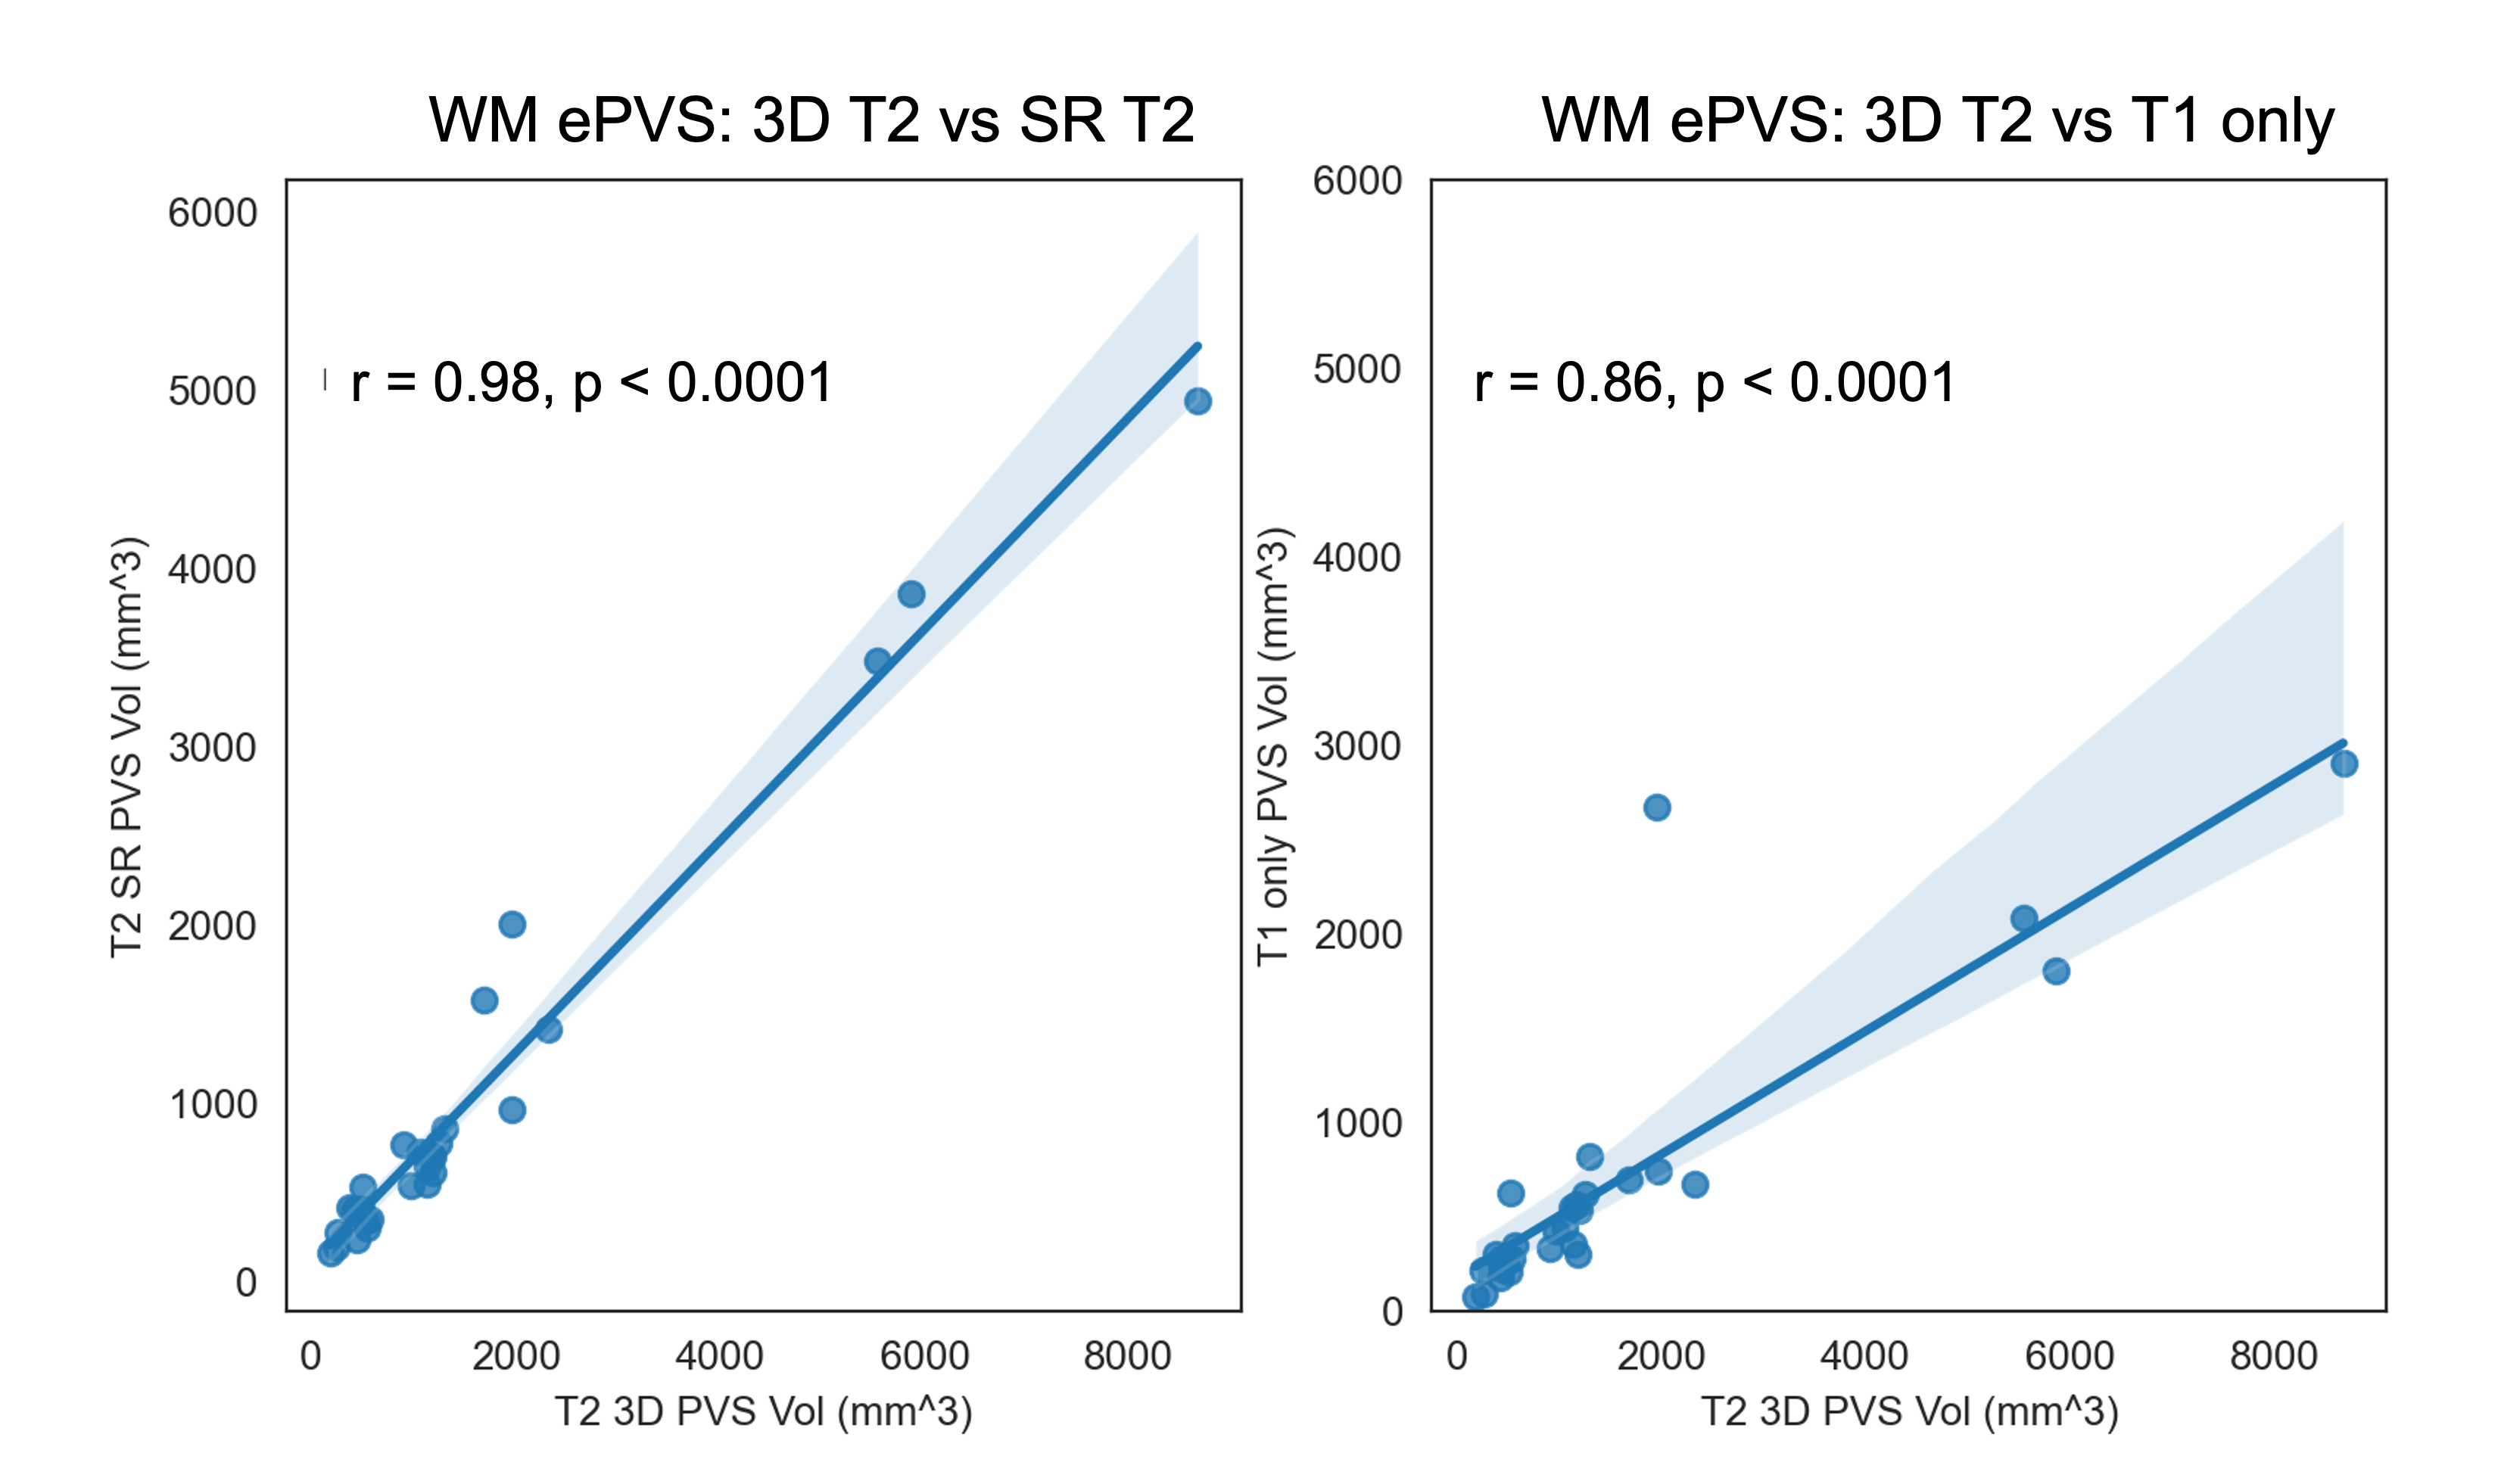
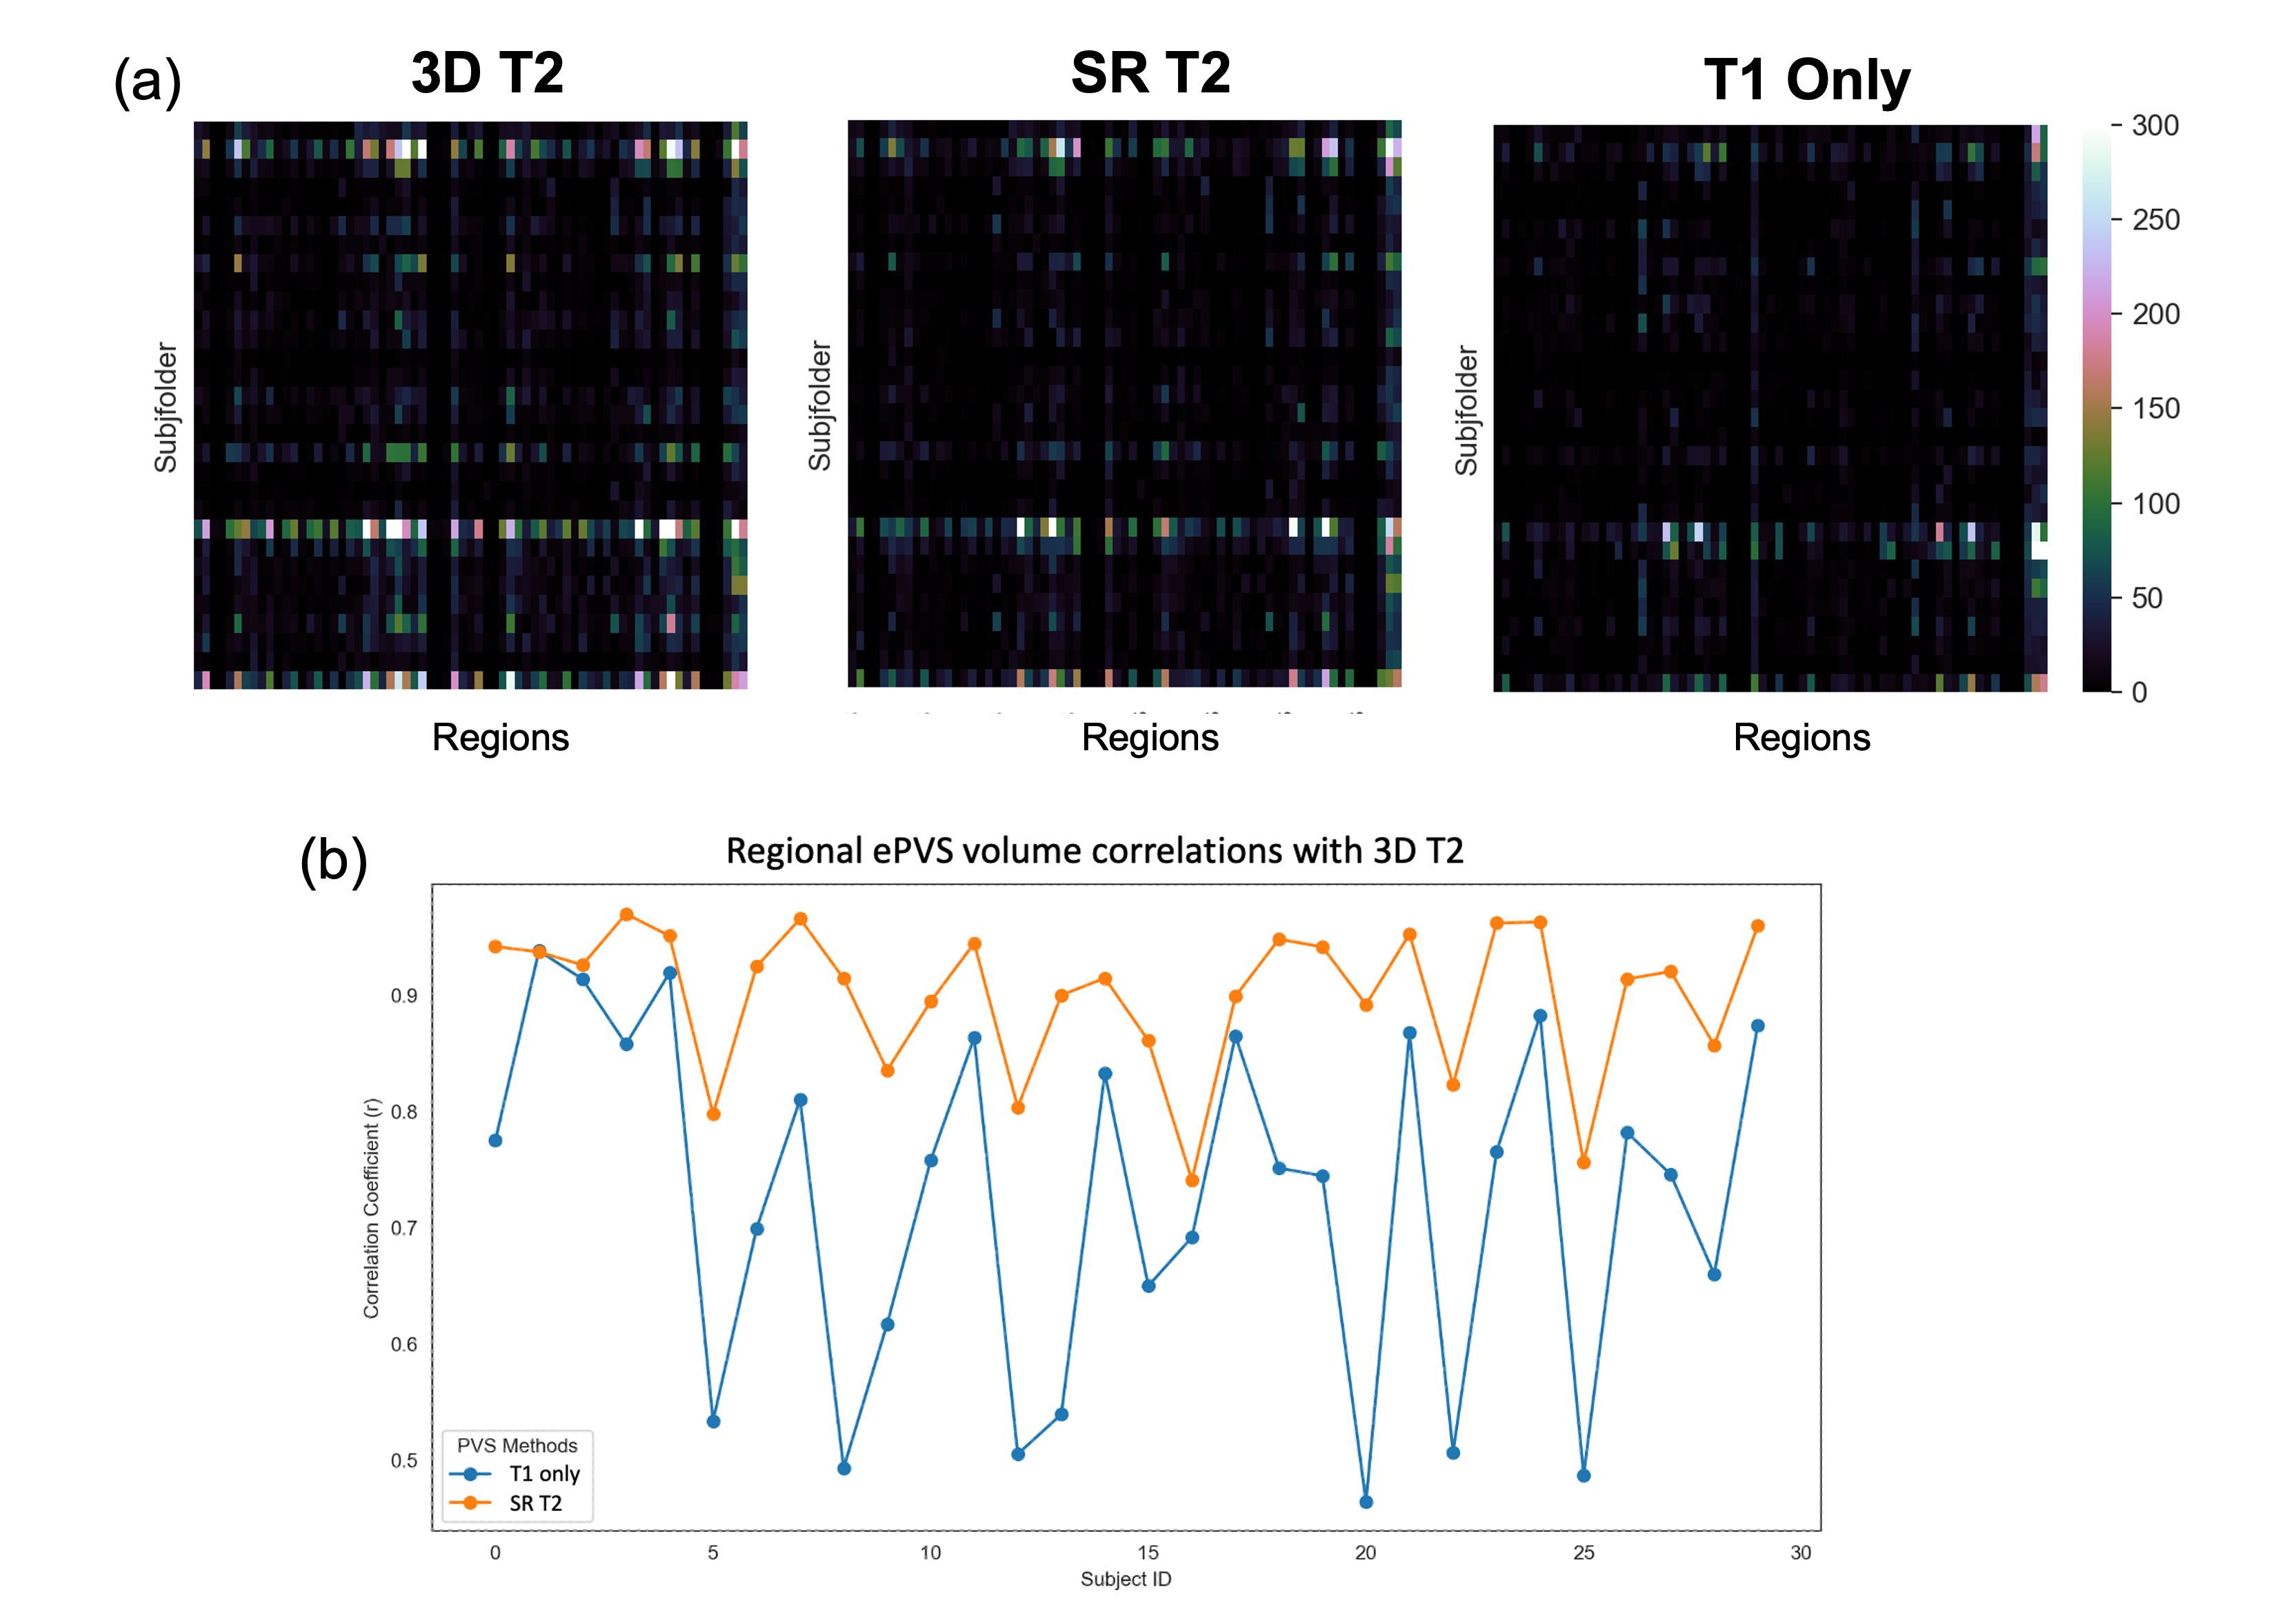
The processed SR T2 images are shown in Figure 1 in comparison to the 3D T2 images and 2D T2 with simple Sinc interpolation. The SR T2 showed much improved resolution in the slice direction than simple interpolation. The EPC images are roughly of T1/T2 contrast, therefore highlighting the low T1w contrast enhanced by high T2w contrast in the ePVS regions. Figure 2 shows the EPC images along with the automatically detected ePVS masks on three sets of images: 3D T2, SR T2 and T1 only. Notice the EPC enhanced the contrast of ePVS regions with T2w images (3D T2 and SR T2) as compared to the T1 only image. SR T2 also provided similar ePVS detection as the 3D T2. Figure 3 shows the calculated total ePVS volume within whole brain white matter for SR T2 and T1 only, as compared to the 3D T2. SR T2 was strongly correlated with the ground truth values from 3D T2 (r = 0.98, p < 0.0001), and clearly is more advantageous than using the T1w volume only. Figure 4 shows the regional ePVS volumes using different methods. The correlation coefficient of regional ePVS volumes using SR T2 showed higher correlation with the 3D T2 than the T1 only case in nearly each subject.Discussion
Automatic ePVS quantification needs minimally a high-resolution 3D T1w volume but is much enhanced if high-resolution 3D T2w volume is available to derive an enhanced PVS contrast (EPC) image. In this study, we show that the innovative SMORE technique can super-resolve a stack of 2D T2w images to produce 3D T2 like images (SR T2). The SR T2 volume provides comparable ePVS estimation as a 3D T2 volume. This allows the extension of the technique to routine clinical exams where only 2D T2w images are collected and also to large multi-center data that was previously collected where only 2D T2w images are available.Acknowledgements
The study was conducted at University of Maryland School of Medicine Center for Innovative Biomedical Resources, Translational Research in Imaging @ Maryland (CTRIM) – Baltimore, Maryland. The study is supported by NIH under grant 5R01NS105503. We thank Dr. Sepehrband for providing us with the PVS quantification tools.References
[1] Matthew Paradise, John D. Crawford, Ben C.P. Lam, Wei Wen, Nicole A. Kochan, Steve Makkar, Laughlin Dawes, Julian Trollor, Brian Draper, Henry Brodaty, Perminder S. SachdevNeurology Mar 2021, 96 (11).
[2] Javierre-Petit C, Schneider JA, Kapasi A, Makkinejad N, Tamhane AA, Leurgans SE, Mehta RI, Barnes LL, Bennett DA, Arfanakis K. Neuropathologic and Cognitive Correlates of Enlarged Perivascular Spaces in a Community-Based Cohort of Older Adults. Stroke. 2020 Sep;51(9):2825-2833.
[3] Boespflug EL, Simon MJ, Leonard E, et al. Targeted Assessment of Enlargement of the Perivascular Space in Alzheimer's Disease and Vascular Dementia Subtypes Implicates Astroglial Involvement Specific to Alzheimer's Disease. J Alzheimers Dis. 2018;66(4):1587-1597. doi:10.3233/JAD-180367.
[4] Sepehrband, F., Barisano, G., Sheikh-Bahaei, N. et al. Image processing approaches to enhance perivascular space visibility and quantification using MRI. Sci Rep 9, 12351 (2019).
[5] C. Zhao, B. E. Dewey, D. L. Pham, P. A. Calabresi, D. S. Reich and J. L. Prince, "SMORE: A Self-Supervised Anti-Aliasing and Super-Resolution Algorithm for MRI Using Deep Learning," in IEEE Transactions on Medical Imaging, vol. 40, no. 3, pp. 805-817, March 2021.
[6] S. Han, A. Carass, M. Schär, P.A. Calabresi, and J.L. Prince, "Slice profile estimation from 2D MRI acquisition using generative adversarial networks", 18th IEEE International Symposium on Biomedical Imaging (ISBI 2021), Nice, France, April 13-16, 2021.
[7] Glasser MF, Sotiropoulos SN, Wilson JA, Coalson TS, Fischl B, Andersson JL, Xu J, Jbabdi S, Webster M, Polimeni JR, Van Essen DC, Jenkinson M; WU-Minn HCP Consortium. The minimal preprocessing pipelines for the Human Connectome Project. Neuroimage. 2013 Oct 15;80:105-24.
[8] Cabeen, R. P., Laidlaw, D. H., and Toga, A. W. (2018). Quantitative Imaging Toolkit: Software for Interactive 3D Visualization, Data Exploration, and Computational Analysis of Neuroimaging Datasets. Proceedings of the ISMRM, 2854.
Figures