4403
T1 mapping and automated segmentation of the brain at 0.55 T
Michael Bach1, Tom Hilbert2,3,4, Francesco Santini5,6, Hanns Christian Breit1, Markus Klarhöfer5,7, Davide Piccini2,3,4, Tobias Kober2,3,4, and Bénédicte Maréchal2,3,4
1Department of Radiology, University Hospital Basel, Basel, Switzerland, 2Advanced Clinical Imaging Technology, Siemens Healthcare, Lausanne, Switzerland, 3Department of Radiology, Lausanne University Hospital and University of Lausanne, Lausanne, Switzerland, 4LTS5, École Polytechnique Fédérale de Lausanne (EPFL), Lausanne, Switzerland, 5Division of Radiological Physics, Department of Radiology, University Hospital Basel, Basel, Switzerland, 6Department of Biomedical Engineering, University of Basel, Basel, Switzerland, 7Siemens Switzerland AG, Healthcare Sector, Zürich, Switzerland
1Department of Radiology, University Hospital Basel, Basel, Switzerland, 2Advanced Clinical Imaging Technology, Siemens Healthcare, Lausanne, Switzerland, 3Department of Radiology, Lausanne University Hospital and University of Lausanne, Lausanne, Switzerland, 4LTS5, École Polytechnique Fédérale de Lausanne (EPFL), Lausanne, Switzerland, 5Division of Radiological Physics, Department of Radiology, University Hospital Basel, Basel, Switzerland, 6Department of Biomedical Engineering, University of Basel, Basel, Switzerland, 7Siemens Switzerland AG, Healthcare Sector, Zürich, Switzerland
Synopsis
T1 mapping could potentially accurately diagnose microstructural changes due to pathology. In this work, a mp2rage based approach was optimized to perform fast whole-brain T1 mapping at 0.55 T. The mp2rage method was validated by the inversion recovery (IR) method. Finally, a fully automated brain segmentation was applied to perform region-based analysis of T1 values. Both methods (IR and mp2rage) yield comparable T1 values. The fully automated brain segmentation showed a good performance for the mp2rage sequence at 0.55 T. ROI extraction should further be optimized as it showed outliers most likely due to CSF voxels contaminating the ROIs.
Introduction
T1 mapping has a high potential to accurately detect microstructural changes caused by pathological processes. A robust and accurate, yet slow method to measure T1 is to sample the T1 decay by performing an inversion-prepared scan with different inversion times.1 For clinical application, it is however desirable to obtain maps of the whole brain in a feasible scan time and at a sufficiently high resolution to detect relevant tissue alterations. To this end, several acceleration techniques have been developed. At lower field strengths, the use of these methods is especially challenging due to the intrinsically lower signal-to-noise ratio and different relaxation times. In this work, an mp2rage-based2 approach was optimized to perform fast whole-brain T1 mapping at 0.55 T. The T1 values obtained by the mp2rage are validated against the inversion recovery gold standard. Finally, a fully automated brain segmentation is applied to perform region-based analysis of T1 values.Methods
An inversion recovery (IR) turbo spin-echo (TSE) sequence was used as the gold standard mapping sequence for comparison. IR-TSE acquisition parameters are: resolution 1.7x1.7x6 mm3, 5 slices, TR 8000 ms, TI: 0/50/100/200/300/500/700/900/2000/2700 ms, total scan time 8:20 min.The mp2rage sequence was used to obtain quantitative T1 maps. Acquisition parameters were optimized for the expected T1 value range, the most relevant parameters being: resolution 1.5 mm isotropic, 144 slices, TR 3000 ms, TI1/2: 436/1470 ms, FA1/2: 5/7 °, total scan time 8:02 min.
Five healthy volunteers were examined at 0.55 T (MAGNETOM Free.Max , Siemens Healthcare, Erlangen, Germany).
Manually drawn regions of interest (ROIs) are used to compare the relaxation times in gray (GM) and white matter (WM) obtained by the mp2rage and the IR-TSE method. The GM ROI is placed in the cerebellum and the WM ROI in the frontal lobe.
Additionally, brain regions are segmented with the MorphoBox prototype (Siemens Healthcare, Erlangen, Germany).3 The following regions are analyzed: corpus callosum, cerebellum, frontal/parietal/temporal lobe.
Results
Validation of the mp2rage mapping method: Figure 1 shows an example T1 map obtained with the MP2RAGE sequence at 0.55 T, showing good contrast between WM and GM. In WM ROIs, the mean T1 across subjects was 485+/-11 ms which is in good agreement with the values obtained with the IR-TSE (471+/-14 ms). In GM, the mean T1 across subjects was 773+/-19 ms differs by 9 % compared to the values obtained with the IR-TSE (702+/-19 ms).Brain region-based analysis of T1: A representative example of the brain segmentation is shown in figure 2. The T1 values are extracted from the ROIs obtained by the automated tissue segmentation. Mean and standard deviation of the T1 values in these ROIs are reported in table 1, along with the manually drawn ROI values.
A detailed depiction of the T1 value distribution within the ROIs is shown in figure 3. The five volunteers are labelled from “A” to “E”. There are several voxels with outlier T1 values. The outliers are dominated by segmentation errors and partial volume effects. The corpus callosum for example is in close vicinity to the ventricles with cerebrospinal fluid (CSF) and outliers with long CSF T1 values occur (approx.. 6 % of the voxels are outliers). The proportion of outliers depends on the region and is much lower for the other regions (e.g. frontal lobe: 0.2 %). The manually drawn ROIs are centrally placed in the relevant regions and avoid transitions between different brain regions. Outliers are clearly reduced in this case. The mean and standard deviation of the region-based T1 values for GM and WM are still in agreement with the values obtained by manually drawn ROIs. However, a slight tendency to higher T1 values occurs for the complete segmented brain regions because of the proximity to CSF, partial volume effects, and small segmentation errors.
Table 1: Extracted mean and standard deviation (std) T1 values (ms) from the different automatically segmented brain regions and the two manually segmented ROIs.
| | mean | std |
| Frontal WM | 496 | 12 |
| Corpus callosum WM | 492 | 19 |
| Cerebellar WM | 531 | 13 |
| Parietal WM | 495 | 11 |
| Frontal GM | 775 | 18 |
| Temporal GM | 820 | 13 |
| Cerebellar GM | 786 | 15 |
| Parietal GM | 767 | 15 |
| Frontal WM (manual ROI) | 485 | 11 |
| Cerebellar GM (manual ROI) | 773 | 19 |
Discussion & Conclusion
Our T1 measurements are in good agreement with previously published data at 0.55 T using an inversion recovery method4: GM = 717±82ms vs. 773±19ms here and WM = 493±33ms vs. 485±11 ms here. Obtaining T1 maps with the mp2rage has the advantage of providing whole-brain coverage at high resolution in a comparably short scan time of 8 minutes. We used a fully automated brain segmentation to avoid any reader bias when drawing ROIs; the preliminary results showed good performance of the employed algorithm also at 0.55T. ROI extraction should further be optimized as it showed outliers most likely due to CSF voxels contaminating the ROIs.Acknowledgements
No acknowledgement found.References
- Henoumont C, Laurent S, Vander Elst L. How to perform accurate and reliable measurements of longitudinal and transverse relaxation times of MRI contrast media in aqueous solutions. Contrast Media Mol Imaging. 2009;4(6):312-321. doi:10.1002/cmmi.294
- Marques JP, Kober T, Krueger G, van der Zwaag W, Van de Moortele PF, Gruetter R. MP2RAGE, a self bias-field corrected sequence for improved segmentation and T1-mapping at high field. NeuroImage. 2010;49(2):1271-1281. doi:10.1016/j.neuroimage.2009.10.002
- Roche A, Maréchal B, Kober T, et al. Assessing Brain Volumes Using MorphoBox Prototype. MAGNETOM Flash. 2017;68:33-37.
- Campbell-Washburn AE, Ramasawmy R, Restivo MC, et al. Opportunities in Interventional and Diagnostic Imaging by Using High-Performance Low-Field-Strength MRI. Radiology. 2019;293(2):384-393. doi:10.1148/radiol.2019190452
Figures
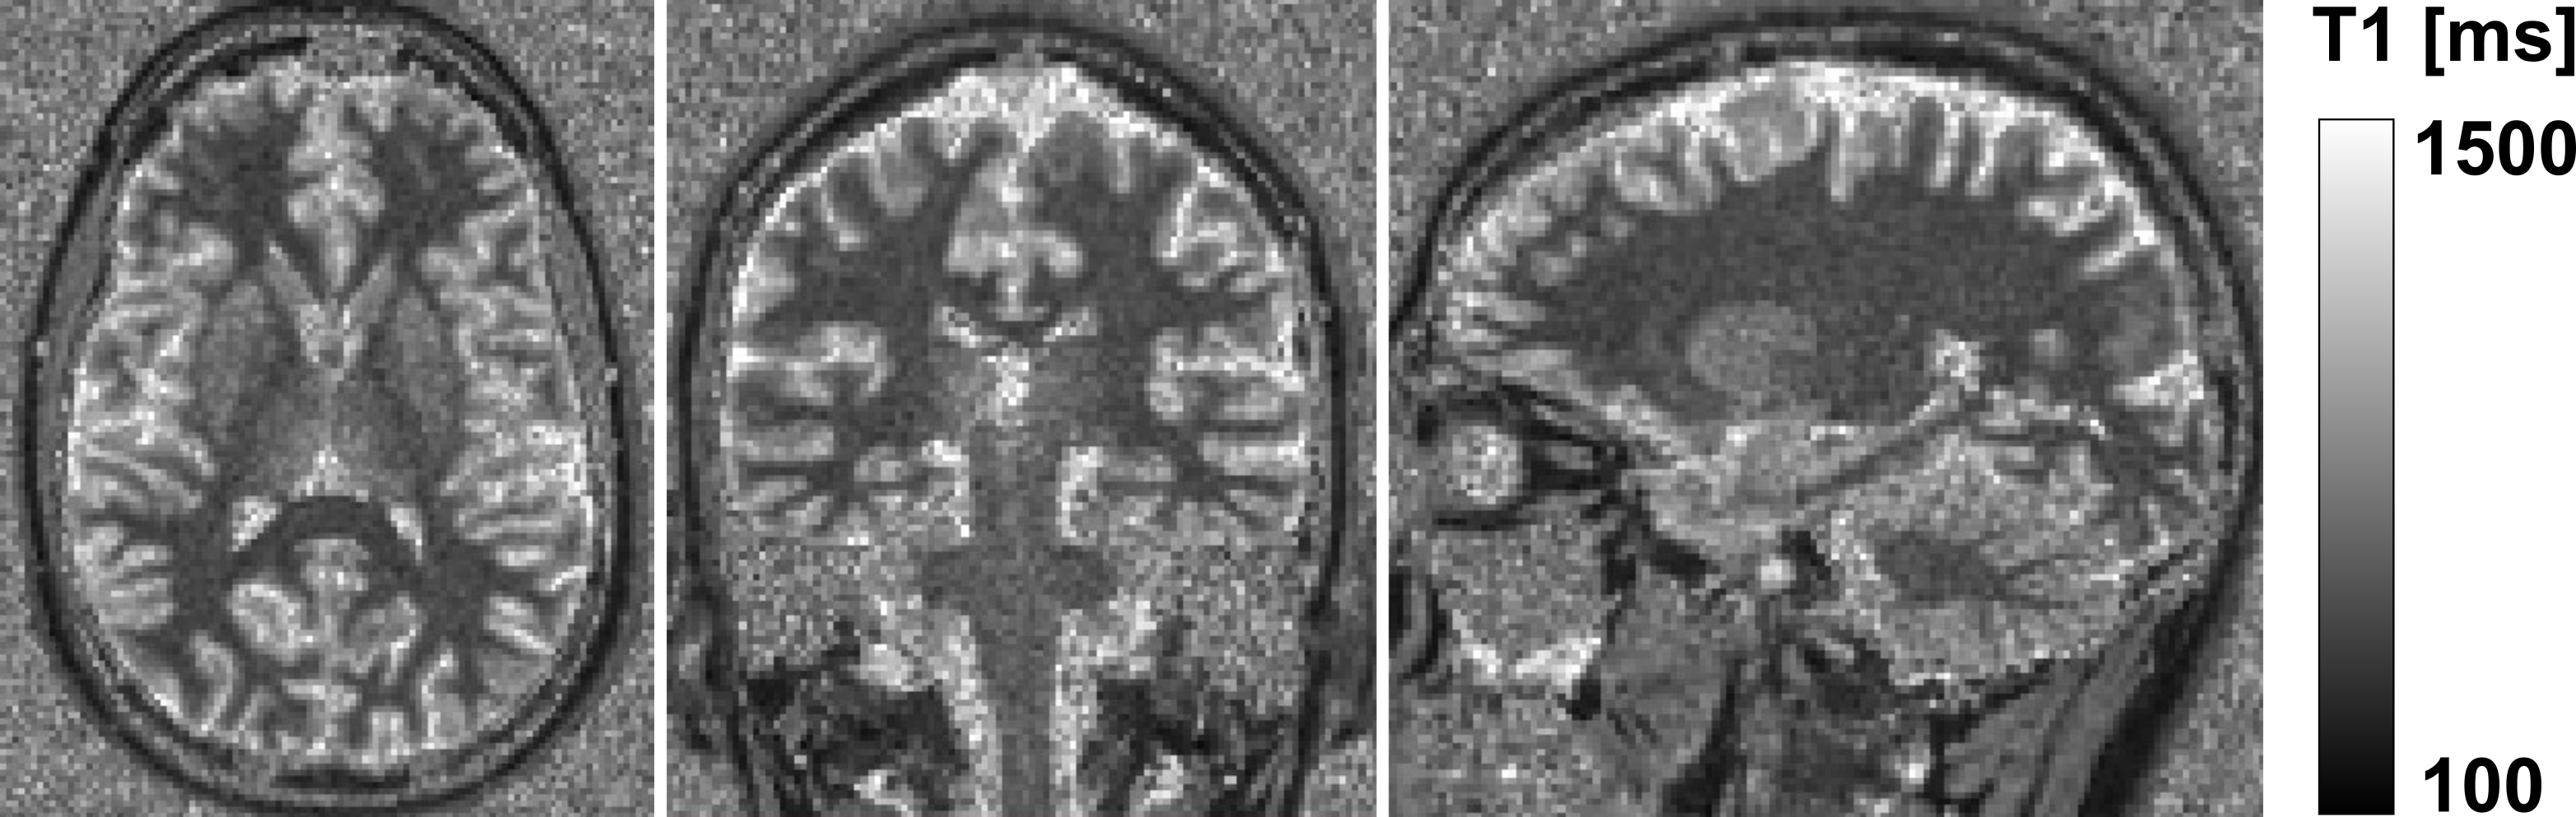
Fig. 1: T1 map obtained with the mp2rage sequence from left to right in transversal, coronary, and sagittal views.
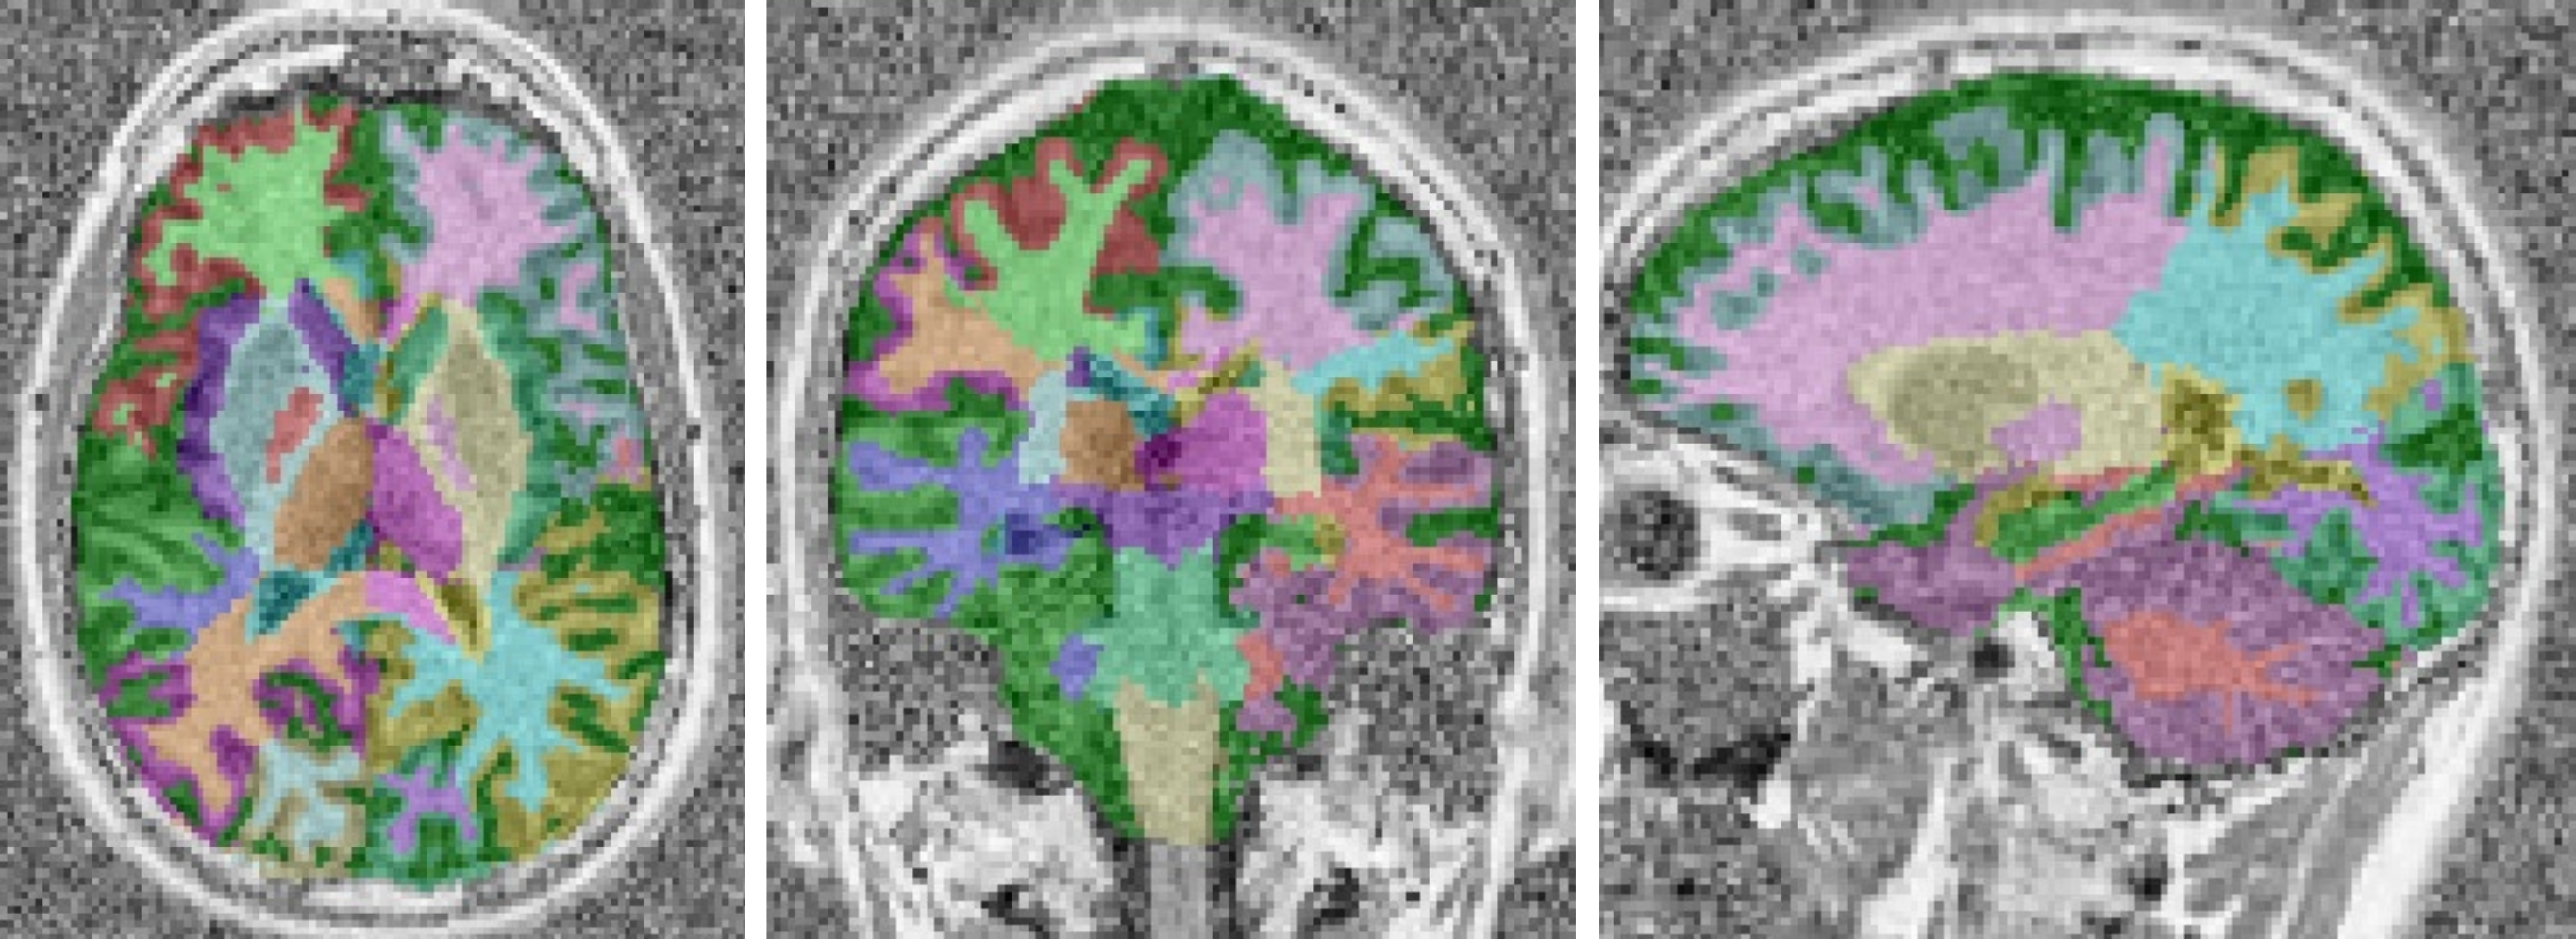
Fig. 2: Representative segmentation example overlaid onto the MP2RAGE image.
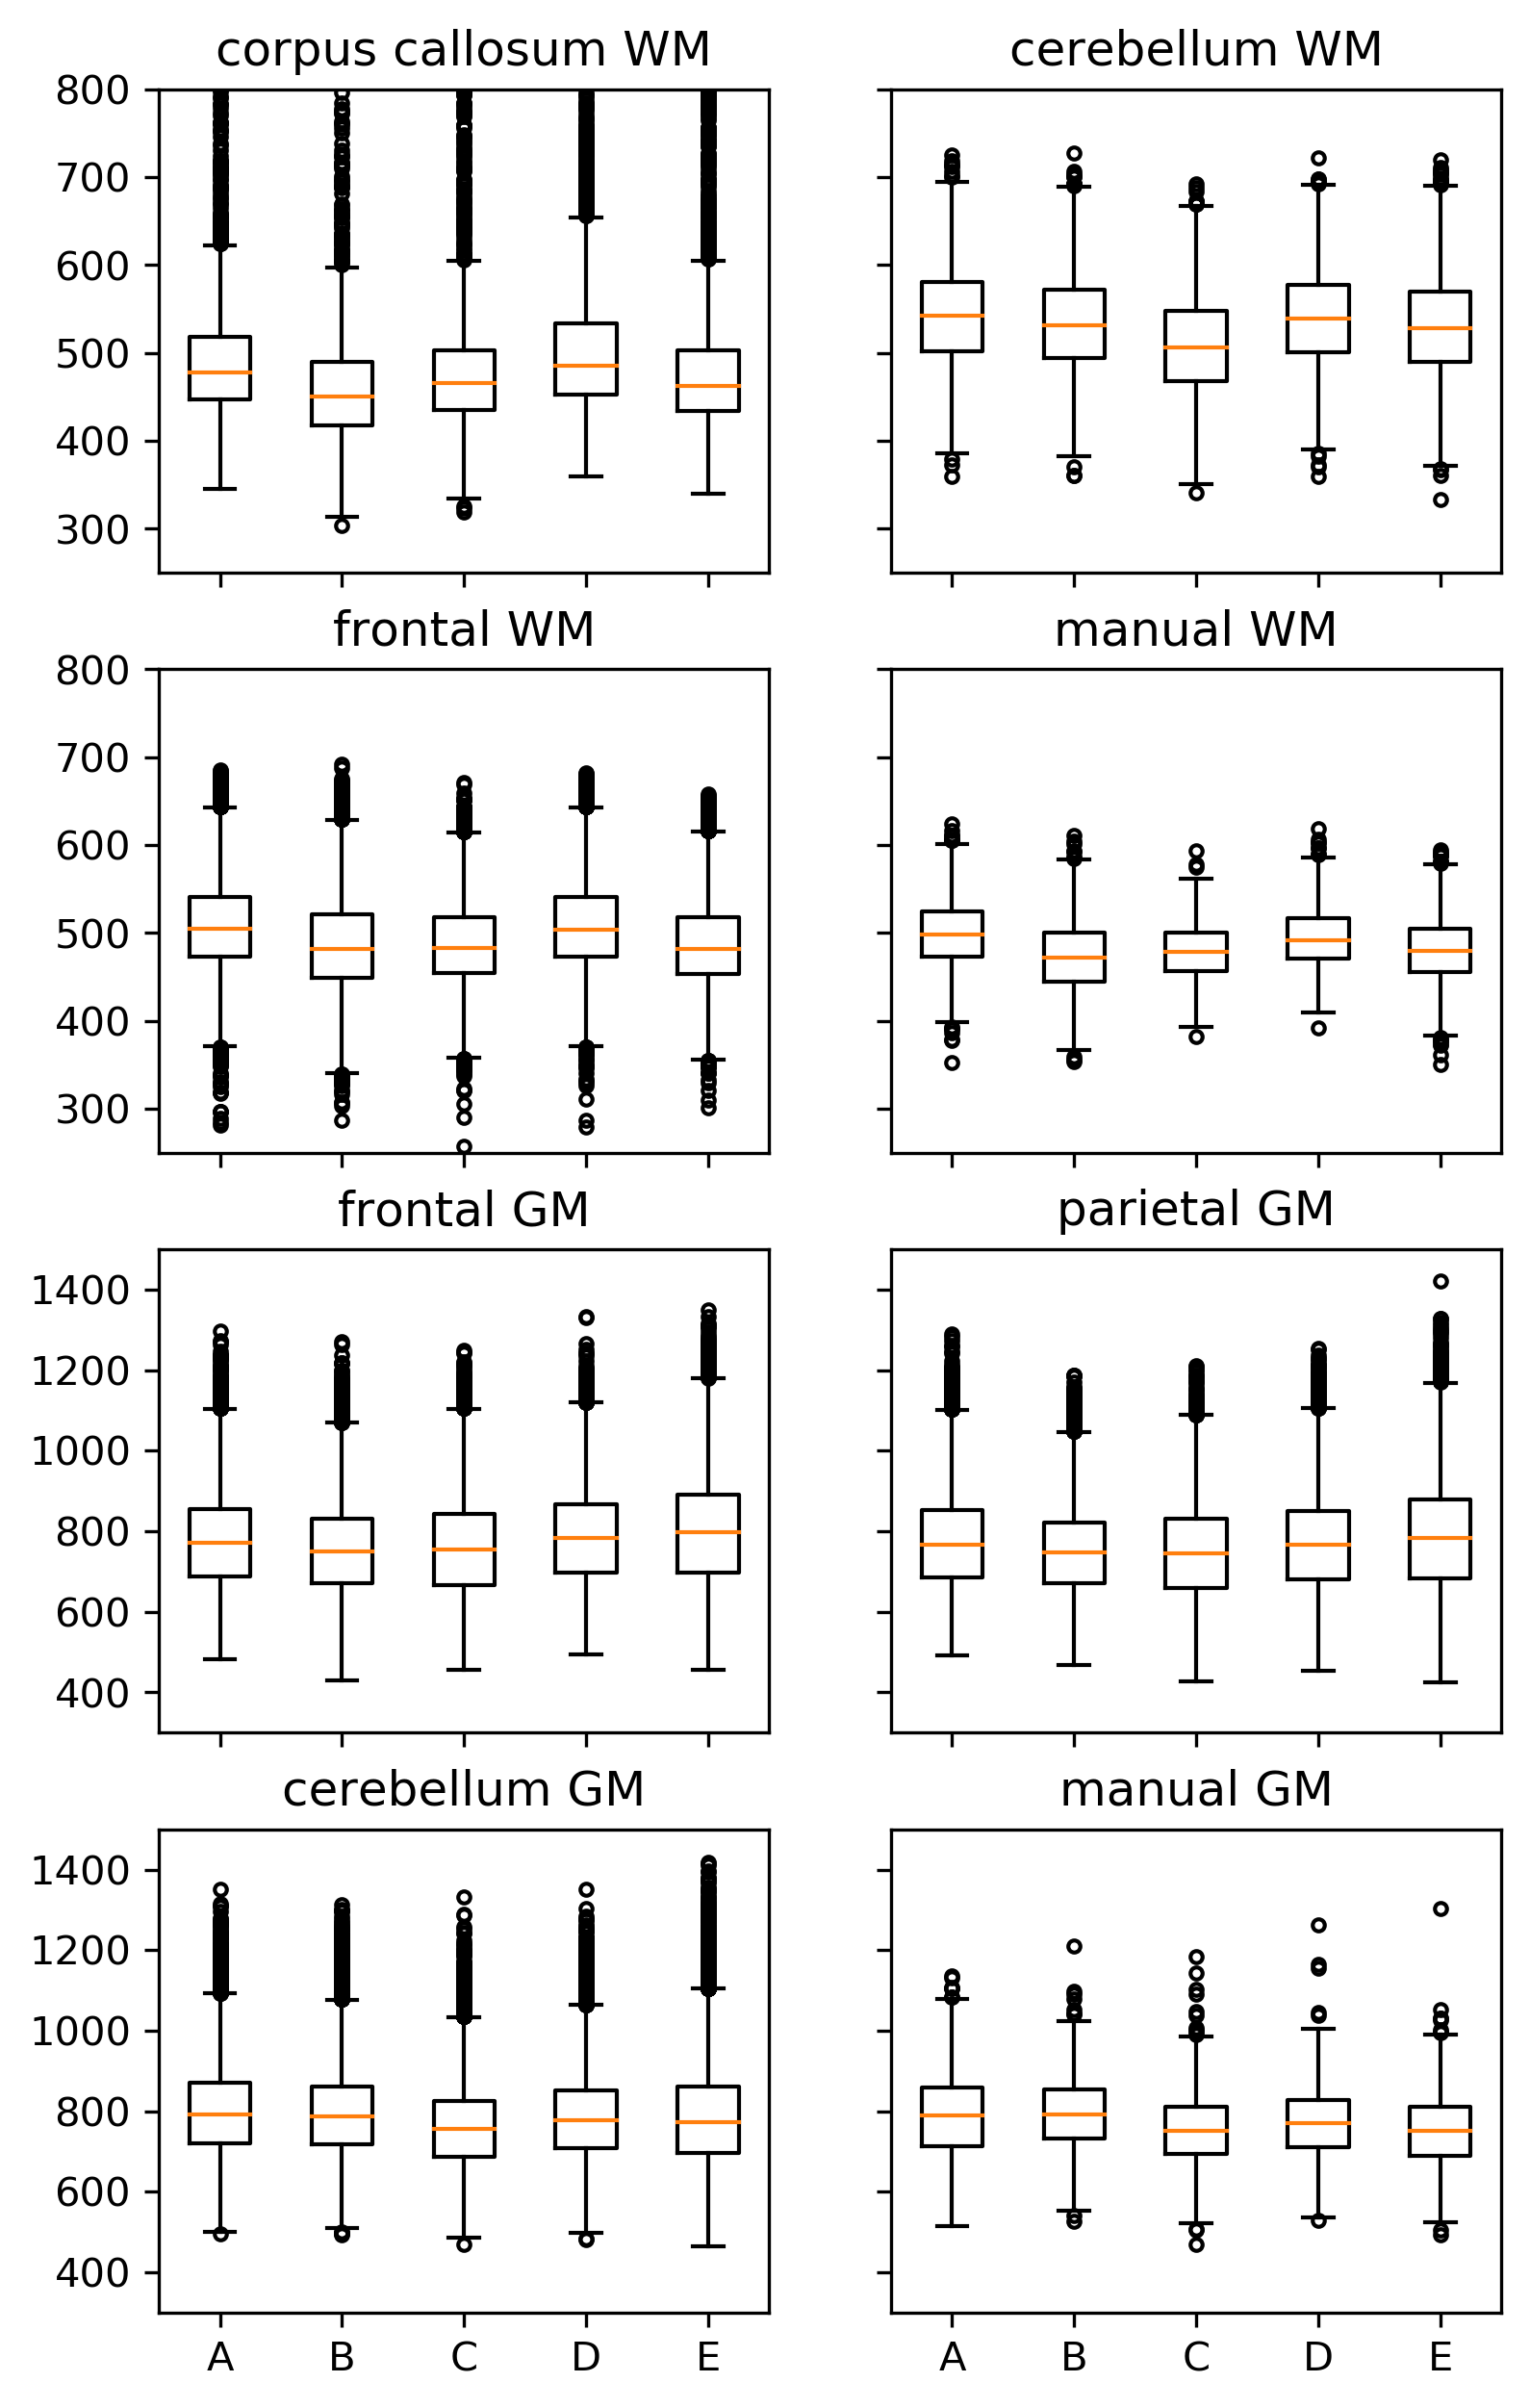
Fig. 3: Boxplots of T1 values obtained in all the brain regions for the different volunteers (A-E) showing outliers with high T1 values in some regions.
DOI: https://doi.org/10.58530/2022/4403