4397
MRI Based Automated Deep-Learning System in the Assessment of Prostate Cancer: Comparison of Advanced Zoomed DWI and Conventional Technique1Department of Diagnostic and Interventional Radiology, Shanghai Jiao Tong University Affiliated Sixth People’s Hospital, Shanghai, China, 2MR Application Development, Siemens Shenzhen Magnetic Resonance Ltd, Shenzhen, China, 3MR Application Predevelopment, Siemens Healthcare GmbH, Erlangen, Germany, 4Innovation Owner Artificial Intelligence for Oncology, Siemens Healthcare GmbH, Erlangen, Germany
Synopsis
Prostate cancer (PCa) detection by an automated deep-learning computer-aided diagnosis (DL-CAD) system using advanced zoomed diffusion-weighted imaging (z-DWI) and full-field-of-view DWI (f-DWI) were compared. The DL-CAD system using z-DWI performed significantly better for PCa detection accuracy per patient (AUC: 0.937 vs. 0.871; P=0.002) and had significantly higher PCa lesion detection accuracy per lesion compared to f-DWI (AUC: 0.912 vs. 0.833; P=0.003). Given this, use of z-DWI can improve the performance of the DL-CAD system for PCa detection.
Introduction
Diffusion-weighted imaging (DWI) is a useful magnetic resonance imaging (MRI) tool, providing both qualitative and quantitative functional information on the prostate and lesions. However, due to differences in scanners, sequences, choice of b- values, and patient conditions, image quality of DWI varies across medical centers. These variations lead to disparities in diagnostic accuracy and inter-observer disagreements and may also interfere with the judgment of deep-learning computer-aided diagnosis (DL-CAD) systems based on MRI images. Therefore, choosing a suitable DWI sequence may improve the accuracy and reliability of the DL-CAD. Previous studies report that using the advanced zoomed field-of-view(FOV) EPI DWI can significantly increase the diagnostic performances of both radiologists and radiomic models [1, 2]. However, it is still unclear whether using zoomed DWI (z-DWI) can improve the performance of DL-CAD systems. Therefore, this study aimed to compare prostate cancer (PCa) detection performance of the DL-CAD system using advanced z-DWI and full FOV DWI (f-DWI).Methods
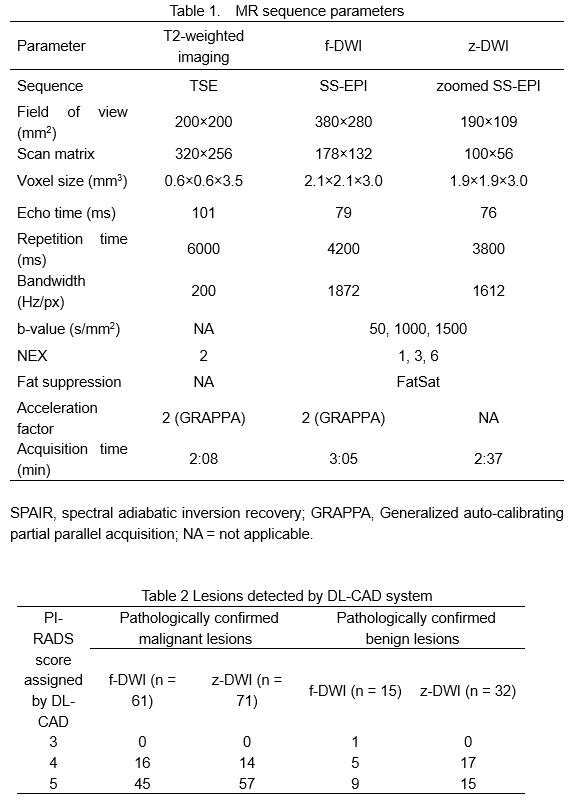
This retrospective study included 110 patients who underwent prostate MRI and subsequent MRI fusion ultrasound-guided biopsies because of suspected PCa. Baseline clinical characteristics, including tumor location, pathologic findings, and clinical PI-RADS assessment were obtained. All patients underwent both T2 weighted imaging (T2WI), full-FOV single-shot EPI DWI (f-DWI), and a prototype zoomed-FOV single-shot EPI DWI (z-DWI) with b-values of 50, 1000, and 1500 s/mm² on a 3T MRI scanner (MAGNETOM Skyra, Siemens Healthcare, Erlangen, Germany). Z-DWI was performed with a slight rotation of the field-of-excitation [3], motion registration [4], and complex averaging [5]. Other parameters are shown in Table 1. A well-trained prototype DL-CAD system [6] (MR Prostate AI v1.2.5; October 2020; Siemens Healthcare GmbH, Erlangen, Germany) was used to compare the performance of z-DWI and f-DWI in PCa detection. First, this system computed apparent diffusion coefficient (ADC) maps and calculated b-value images at b=2000 s/mm² using the input DWI. Then it segmented the whole-gland volumes using T2WI. After that, the system aligned DWI and ADC to the T2WI. Finally, the system automatically detected the clinically relevant lesions, and outputted each detected lesion’s localization, 3-dimensional contours, its estimate of the prostate imaging reporting and data system (PI-RADS) category, and case-based suspicion (LoS) which represents the level of suspiciousness that the patient has PCa. A total of 10,000 bootstrap samples were obtained by the Hamiltonian Monte Carlo method to determine inferences on the mean difference in sensitivity adjusting for the number of false positives per patient and the number of false positives per lesion. The detection accuracies of z-DWI and f-DWI were evaluated using the free-response receiver operating characteristics (FROC) analysis due to PCa’s multi-focality. Considering the FROC curve has an infinite area under the curve (AUC), we also used alternative free-response receiver operating characteristics (AFROC) analysis with finite AUC ranging from 0 to 1 to evaluate the PCa detection ability of the DL-CAD system with different DWI sets. The diagnostic performances of DL-CAD were also evaluated by fitting ROC curves for case-based LoS and compared with clinical PI-RADS assessment. Statistical evaluations were performed using R v4.0 (R Foundation for Statistical Computing, Vienna, Austria) and the “BayesianFROC” package (v0.4.0). P values less than 0.05 were considered statistically significant.Results
Among the 110 patients, 61 patients with 76 cancer lesions and 49 patients without histological evidence of cancer were identified. The lesions detected and their PI-RADS scores assigned by the DL-CAD system are shown in Table 2 and Figure 1. According to the FROC curves shown in Figure 2, with a detection sensitivity > 0.75, z-DWI shows lower False Positive detections (FPDs) per patient as well as lower FPDs per lesion. The DL-CAD system using z-DWI was superior to that using f-DWI for PCa detection accuracy per patient (AUC: 0.937 vs. 0.871; P=0.002) and per lesion (AUC: 0.912 vs. 0.833; P=0.003). An exemplar case with a lesion detected by z-DWI but not by f-DWI is shown in Figure 3. Figure 4 depicts the ROC curves for LoS scores given by DL-CAD in comparison to the clinical PI-RADS assessment. As shown in Figure 4a, the ROC curves of DL-CAD lie above the radiologist assigned PI-RADS score (both cutoff=3 and 4), with z-DWI showing a larger AUC (AUC: 0.89 vs. 0.84, P=0.17). It indicates that DL-CAD has a better performance in differentiating PCa and benign lesions than the radiologists in our institue. For distinguishing Gleason grade grouping (GGG)-1 from GGG-2 and more (Figure 4b), z-DWI also proved slightly better performance than f-DWI (AUC: 0.87 vs. 0.83, P=0.38) and the radiologists. F-DWI only has better performance for grade group-2 detection than the radiologists when the PI-RADS cutoff is defined as 4. The ROC curve of f-DWI based DL-CAD is nearly superimposed with the clinical assessment when the cutoff is PI-RADS 3, and z-DWI based DL-CAD shows the best performance.Discussion and Conclusion
This study compared the diagnostic performance of the DL-CAD system on prostate cancer with full-FOV DWI and the advanced zoomed DWI. The results demonstrate that with the input of z-DWI, the DL-CAD system had significantly higher detection accuracy of PCa compared to f-DWI. In conclusion, using advanced z-DWI can improve the performance of the DL-CAD system for PCa detection.Acknowledgements
Dr. Henkjan Huisman (Radboud University Medical Center, Nijmegen, NL)
Dr. Evan Johnson (New York University, New York City, NY, USA)
Dr. Tobias Penzkofer (Charité, Universitätsmedizin Berlin, Berlin, Germany)
Dr. Moon Hyung Choi (Eunpyeong St. Mary’s Hospital, Catholic University of Korea, Seoul, Republic of Korea)
Dr. Ivan Shabunin (Patero Clinic, Moscow, Russia)
Dr. David Winkel (Universitätsspital Basel, Basel, Switzerland)
Dr. Pengyi Xing (Changhai Hospital, Shanghai, China)
Dr. Dieter Szolar (Diagnostikum Graz Süd-West, Graz, Austria)
Dr. Fergus Coakley (Oregon Health and Science University, Portland, OR, USA)
Dr. Steven Shea (Loyola University Medical Center, Maywood, IL, USA)
Dr. Edyta Szurowska (Medical University of Gdansk, Gdansk, Poland)
References
[1] Hu, L., Wei, L., Wang, S. et al. Better lesion conspicuity translates into improved prostate cancer detection: comparison of non-parallel-transmission-zoomed-DWI with conventional-DWI. Abdom Radiol (2021). https://doi.org/10.1007/s00261-021-03268-5
[2] Hu, L., Zhou, D.w., Fu, C.x. et al. Advanced zoomed diffusion-weighted imaging vs. full-field-of-view diffusion-weighted imaging in prostate cancer detection: a radiomic features study. Eur Radiol 31, 1760–1769 (2021). https://doi.org/10.1007/s00330-020-07227-4
[3] Finsterbusch J (2012) Improving the performance of diffusion-weighted inner field-of-view echo-planar imaging based on 2D-selective radiofrequency excitations by tilting the excitation plane, J Magn Reson Imaging 35(4) 984–992
[4]Jolly, M.-P., Guetter, C., Guehring, J., Cardiac segmentation in MR cine data using inverse consistent deformable registration, Proceedings/IEEE International Symposium on Biomedical Imaging: from nano to macro. IEEE International Symposium on Biomedical Imaging. January 2010. DOI: 10.1109/ISBI.2010.5490305
[5] Kordbacheh H, Seethamraju RT, Weiland E, Kiefer B, Nickel MD, Chulroek T, Cecconi M, Baliyan V, Harisinghani MG (2019) image quality and diagnostic accuracy of complex-averaged high b-value images in diffusion-weighted MRI of prostate cancer, Abdom Radiol (NY) 44(6):2244–2253
[6] Winkel DJ, Tong A, Lou B, Kamen A, Comaniciu D, Disselhorst JA, Rodríguez-Ruiz A, Huisman H, Szolar D, Shabunin I, Choi MH, Xing P, Penzkofer T, Grimm R, von Busch H, Boll DT. A Novel Deep Learning Based Computer-Aided Diagnosis System Improves the Accuracy and Efficiency of Radiologists in Reading Biparametric Magnetic Resonance Images of the Prostate: Results of a Multireader, Multicase Study. Invest Radiol. 2021 Oct 1;56(10):605-613. doi: 10.1097/RLI.0000000000000780. PMID: 33787537.
Figures
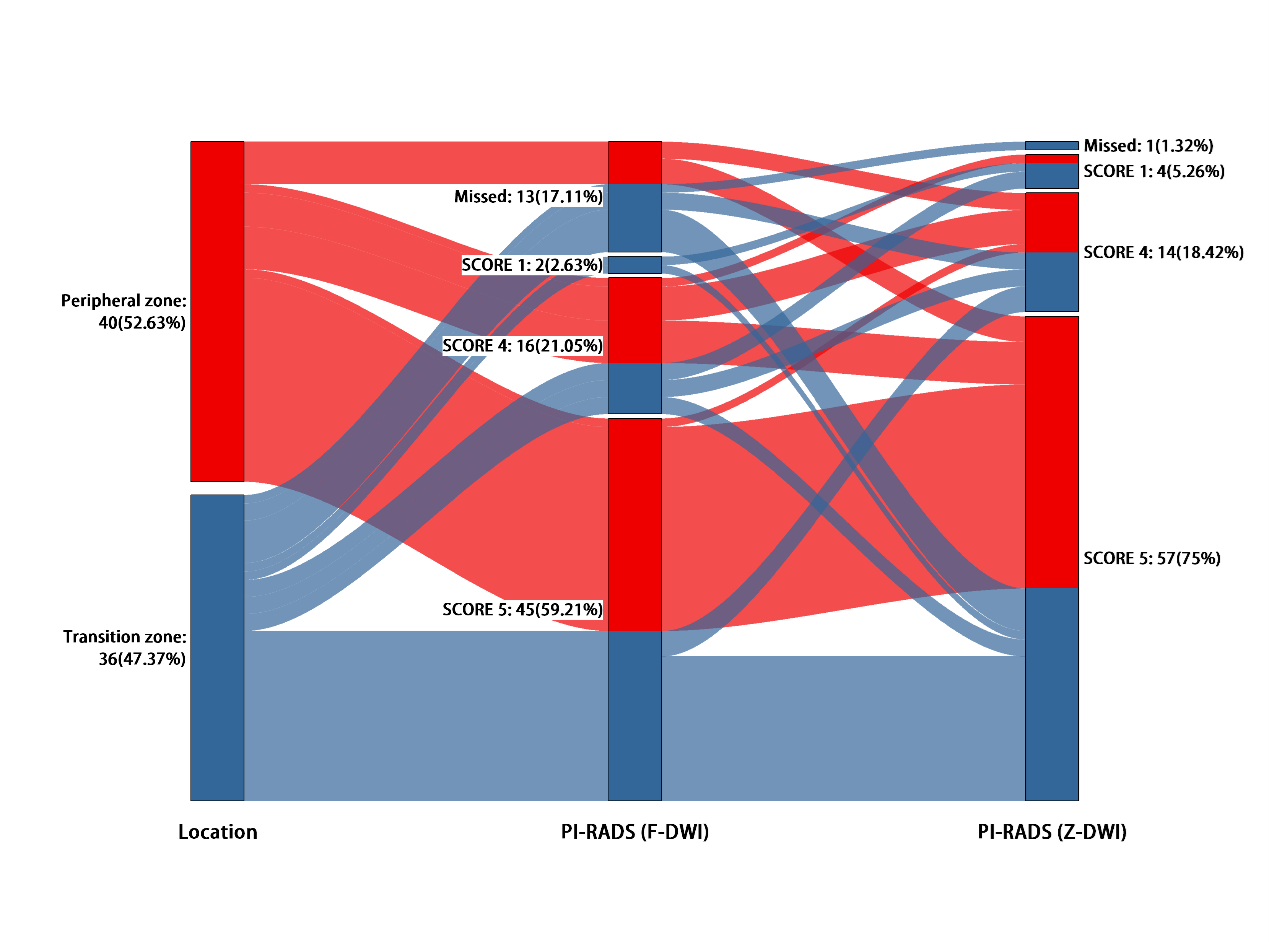
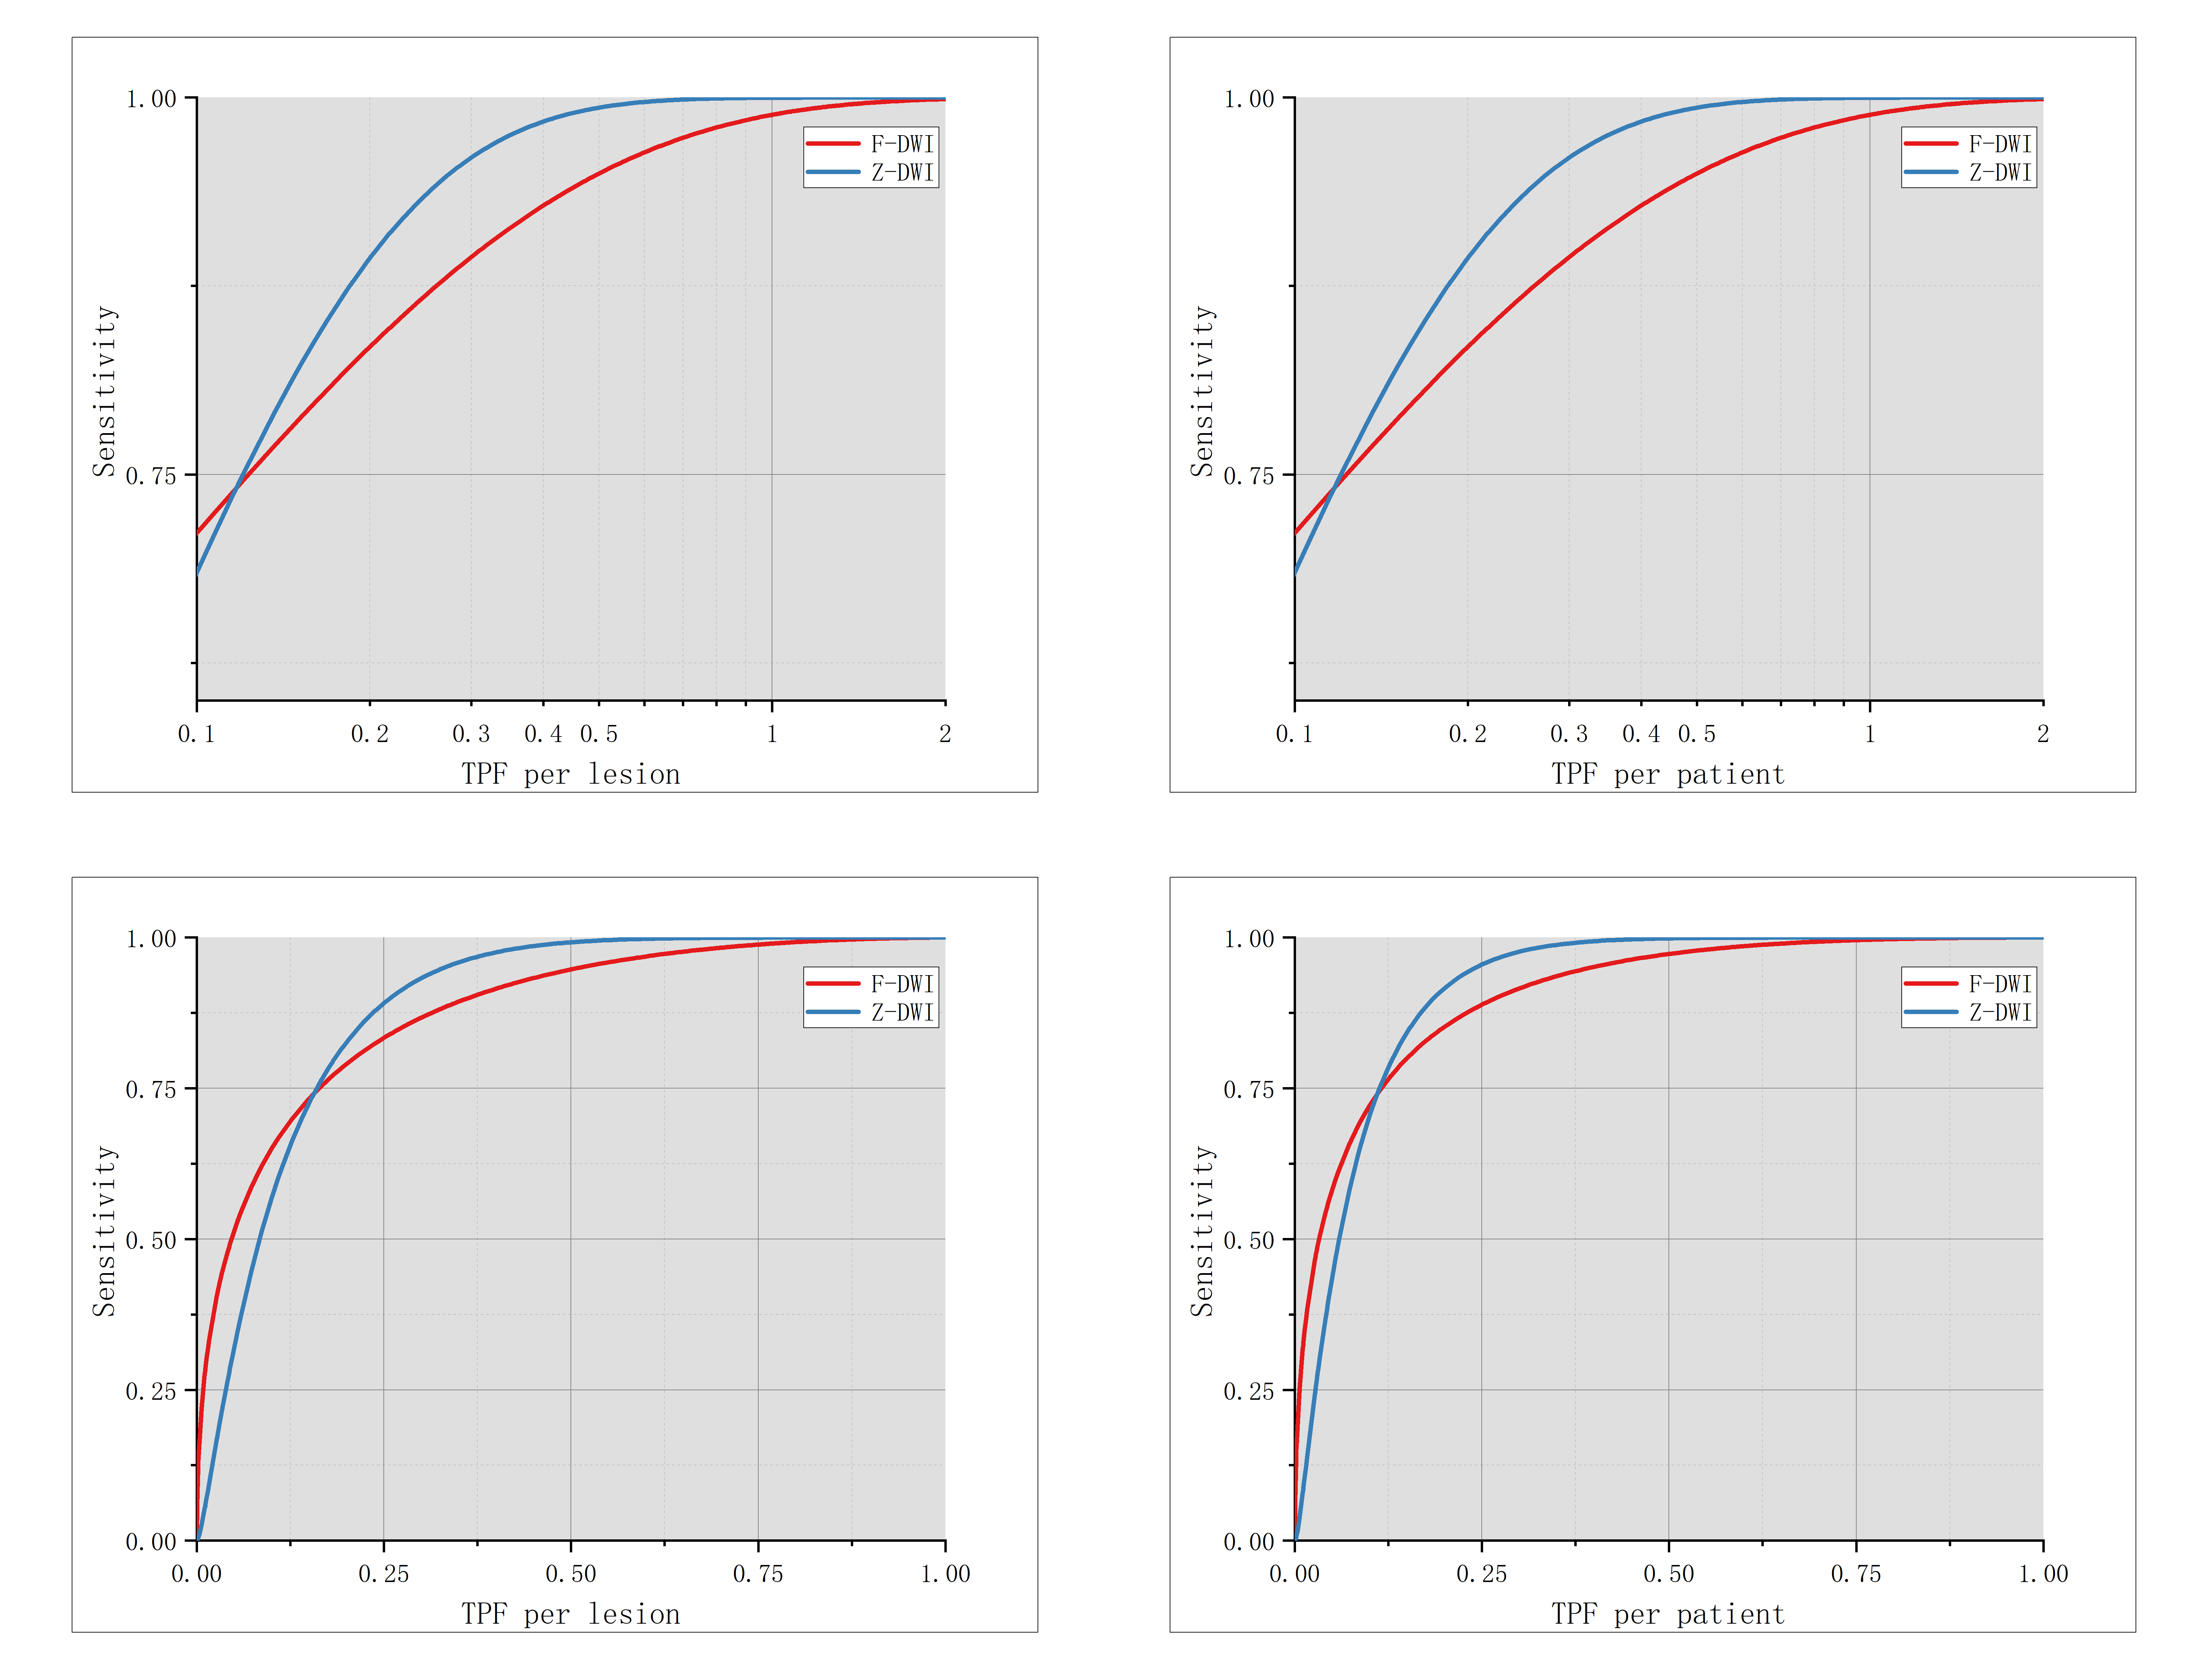
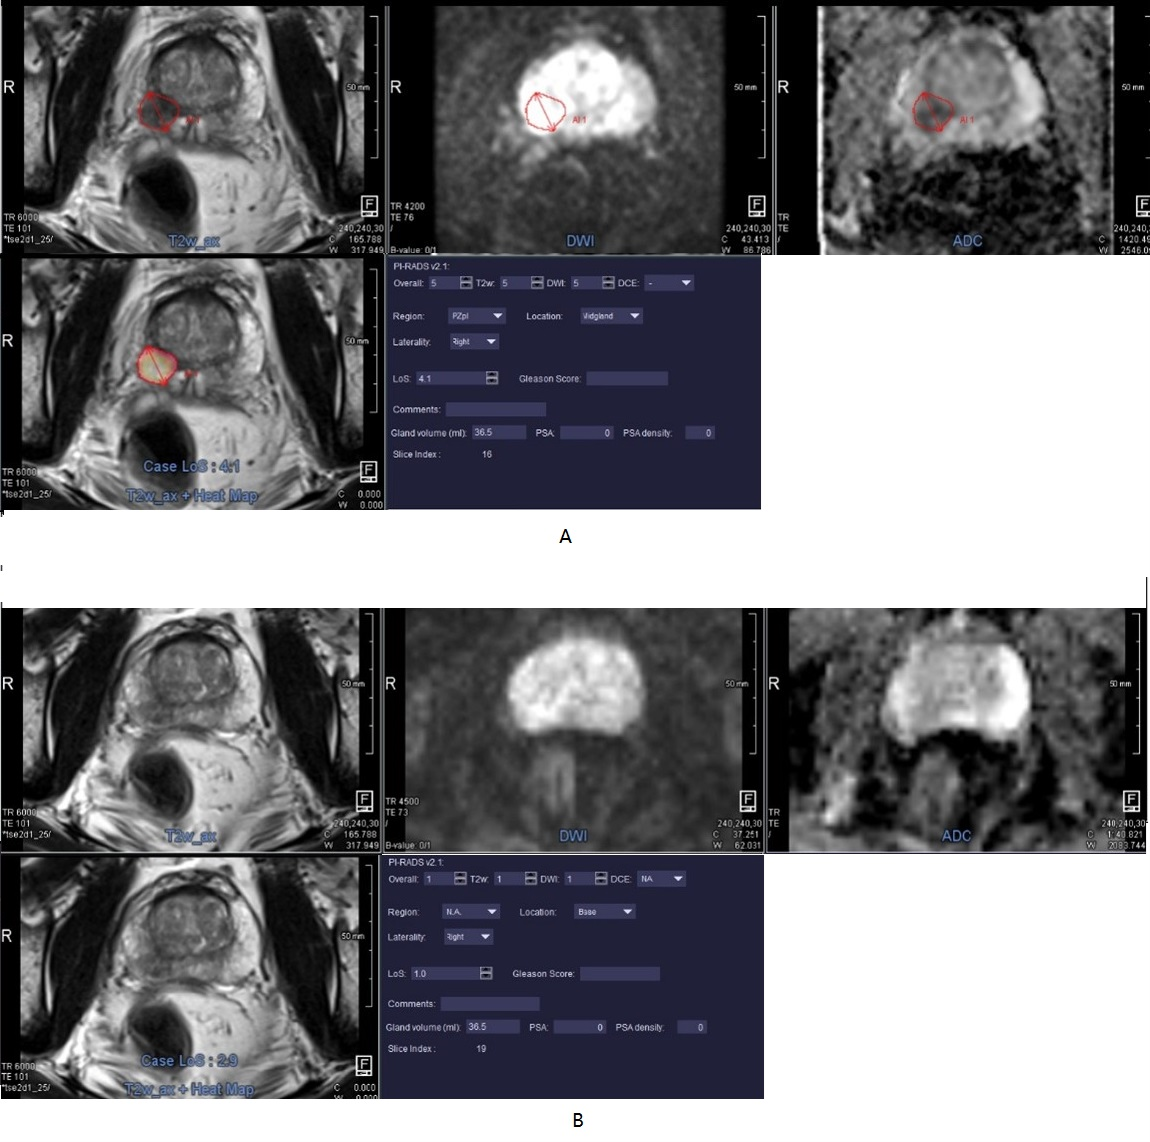
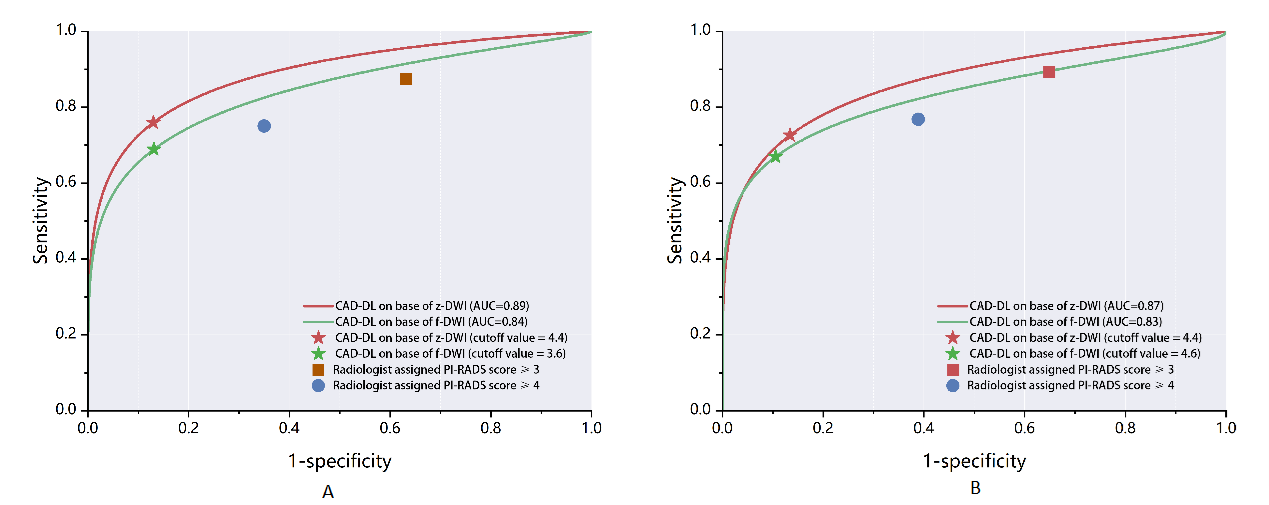
Fig 4 Comparison of bootstrapped ROC analysis for case-based suspicion (LoS) and radiologist performance at Prostate Imaging Reporting and Data System (PI-RADS) on two clinically relevant cutoffs: tumor versus benign (A), benign and gleason grade group 1 versus gleason grade group 2 or more (B).