4394
Deep Learning based automatic ROI sampling approach for the measurement of liver PDFF
1Department of Radiology, Ruijin Hospital, Shanghai Jiao Tong University School of Medicine, Shanghai, China, 2Ruijin Hospital, Shanghai Jiao Tong University School of Medicine, Shanghai, China, 3United Imaging Healthcare, Shanghai, China, 4Central Research Institute, United Imaging Healthcare, Shanghai, China
Synopsis
Hepatic proton density fat fraction (PDFF) measurement plays an important role in the assessment of chronic diffuse liver diseases, while it is always time consuming and lack of good reproducibility and repeatability. To address this problem, we introduced a five-ROI sampling approach based on a convolutional neural network that provided high dice coefficient (DC) of whole liver segmentation, good correlation and quicker compared with manual operation.
Introduction
An automated and objectively defined region of interest (ROI) sampling approach for the analysis of hepatic PDFF is urgently needed, as the measurements reproducibility and repeatability are affected by the sizes, locations, numbers of ROI and the readers [1-3]. The purpose of this study was to assess the feasibility of a DL-based approach across a 3D fat analysis and calculation technique (FACT) images to automate ROI placement and to evaluate the accuracy compared to manual measurements and nine Couinaud segmental ROI reference.Methods
Dataset:In this study, we used a PDFF dataset from 259 patients (median age 47, range: 14~84 years, male 163, female 96) examined at Ruijin Hospital between September 2019 and August 2021. MRI was performed on a 3T scanner (uMR780, United Imaging Healthcare, Shanghai, China) with a standard FACT sequence (FOV: 400×300, matrix: 208×146, flip angle 3 degree, 6 TEs, TR: 10.72ms) which could generate six group of images (Fat fraction, R2*, in phase, out of phase, water and fat images).
The dataset was split into a training set for the DL-based neural network (N=219), a validation set (N=40) to validate the liver segmentation and falciform ligament (FL) detection results, and the fat fraction statistic between automatic algorithm and manual operation. Dice coefficient (DC) and mean square error (MSE) were calculated.
Algorithm workflow
The work flow of this automatic measurement method consists of three steps [Fig 1]:
1. Liver segmentation and FL detection
Manual segmentation of liver and FL of the collected dataset was performed on FACT images using ITK-SNAP by a radiologist with more than seven years’ experience in MR imaging. DL technique was applied in this step using a 3D V-Net with multi-input channels (six groups of the images).
2. Vessel detection
The boundary of the liver was corroded by five pixels. In addition, a classic multiscale vessel enhancement filtering technique [4] on the R2* images was used to exclude liver vessel.
3. ROI arrangement
Five ROIs were arranged in the largest slice of liver segmentation to measure FF. In order to distribute five ROIs, the largest slice of liver segmentation was necessary to be divided into five parts: the liver was initially divided into left and right parts by FL, then the right part of liver was divided into four parts with relative same area. Each liver part was assigned with an ROI (Diameter: 1.5cm), avoiding the vessels. Validation was performed on a workstation (CPU: Intel Core i5-7500 3.4GHz, Memory: 16 GB, GPU: NVIDIA GTX 1660, VRAM: 6 GB).
Hepatic PDFF Estimation
To exam the accuracy of this method, the average of PDFF calculated based on manual placement of nine Couinaud segmental ROIs was considered a reference standard. Two readers (Reader 1 and Reader 2, both with more than 3 years of experience in liver MRI) manually examined on 40 images with both manual five ROIs and manual nine ROIs strategy. The time for measurement was recorded. Bland-Altman analysis was used to compare the agreement of the two strategies and inter-reader repeatability. The measurement duration of the two methods was compared using the Student’s t test.
Results
The dice similarity coefficient (DSC) for the liver segmentation is 0.93±0.06, and the MSE for the FL detection is 0.021. Agreement of hepatic PDFF assessments between two readers and manual five ROIs and manual nine ROIs strategy were demonstrated in Fig 2. Correlation and time during of the two methods were shown in Fig 3&4.Discussion and Conclusion
DL has become a remarkably powerful tool for image processing. PDFF is a validated non-invasive quantitative imaging biomarker for hepatic fat content, difference in ROI placement of PDFF can cause differences in the result. We proposed an automatic DL method, which can measure the PDFF automatically and objectively.In the previous research on automatic ROI detection or liver segmentation [5, 6], there was no similar methods as the current study. In this work, a five-ROI sampling strategy was proposed which took the changes of blood supply caused by the FL into consideration, and eliminated the effect of vascular on PDFF measurement. And this strategy sampled the right part of liver FL evenly since hepatic fat content is spatially heterogeneous. We compared it with that of nine segmental ROI manually, a strategy widely used in prior publications and clinical trials, and results of PDFF show high consistency and repeatability. This study demonstrated that the proposed DL based method is feasible with good liver segmentation performance, and good correlation with the results of manual operation and cost much less time, which would offer an objectively analysis of hepatic PDFF. These results could be further compared with other ROI methods.
Acknowledgements
No acknowledgement found.
References
[1] Campo CA, Hernando D, Schubert T, et al. Standardized Approach for ROI-Based Measurements of Proton Density Fat Fraction and R2* in the Liver. AJR Am J Roentgenol. 2017. 209(3): 592-603.[2] Vu KN, Gilbert G, Chalut M, et al. MRI-determined liver proton density fat fraction, with MRS validation: Comparison of regions of interest sampling methods in patients with type 2 diabetes. J Magn Reson Imaging. 2016. 43(5): 1090-9.
[3] Hong CW, Wolfson T, Sy EZ, et al. Optimization of region-of-interest sampling strategies for hepatic MRI proton density fat fraction quantification. J Magn Reson Imaging. 2018. 47(4): 988-994.
[4] Frangi A F,Niessen W J,Vincken K L,et al.Multiscale vessel enhancement filtering[J].Lecture Notes in Computer Science,2000,1496:130-137.
[5] Mousavi SM, Naghsh A, Abu-Bakar SA. A Heuristic Automatic and Robust ROI Detection Method for Medical Image Warermarking. J Digit Imaging. 2015. 28(4): 417-27.
[6] Wang K, Mamidipalli A, Retson T, et al. Automated CT and MRI Liver Segmentation and Biometry Using a Generalized Convolutional Neural Network. Radiol Artif Intell. 2019. 1(2).
Figures
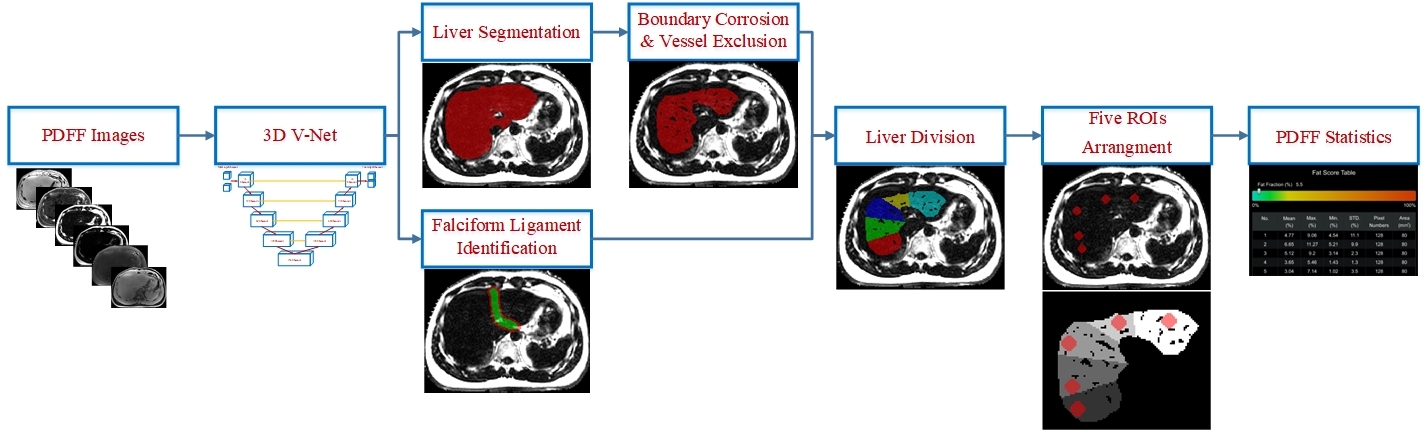
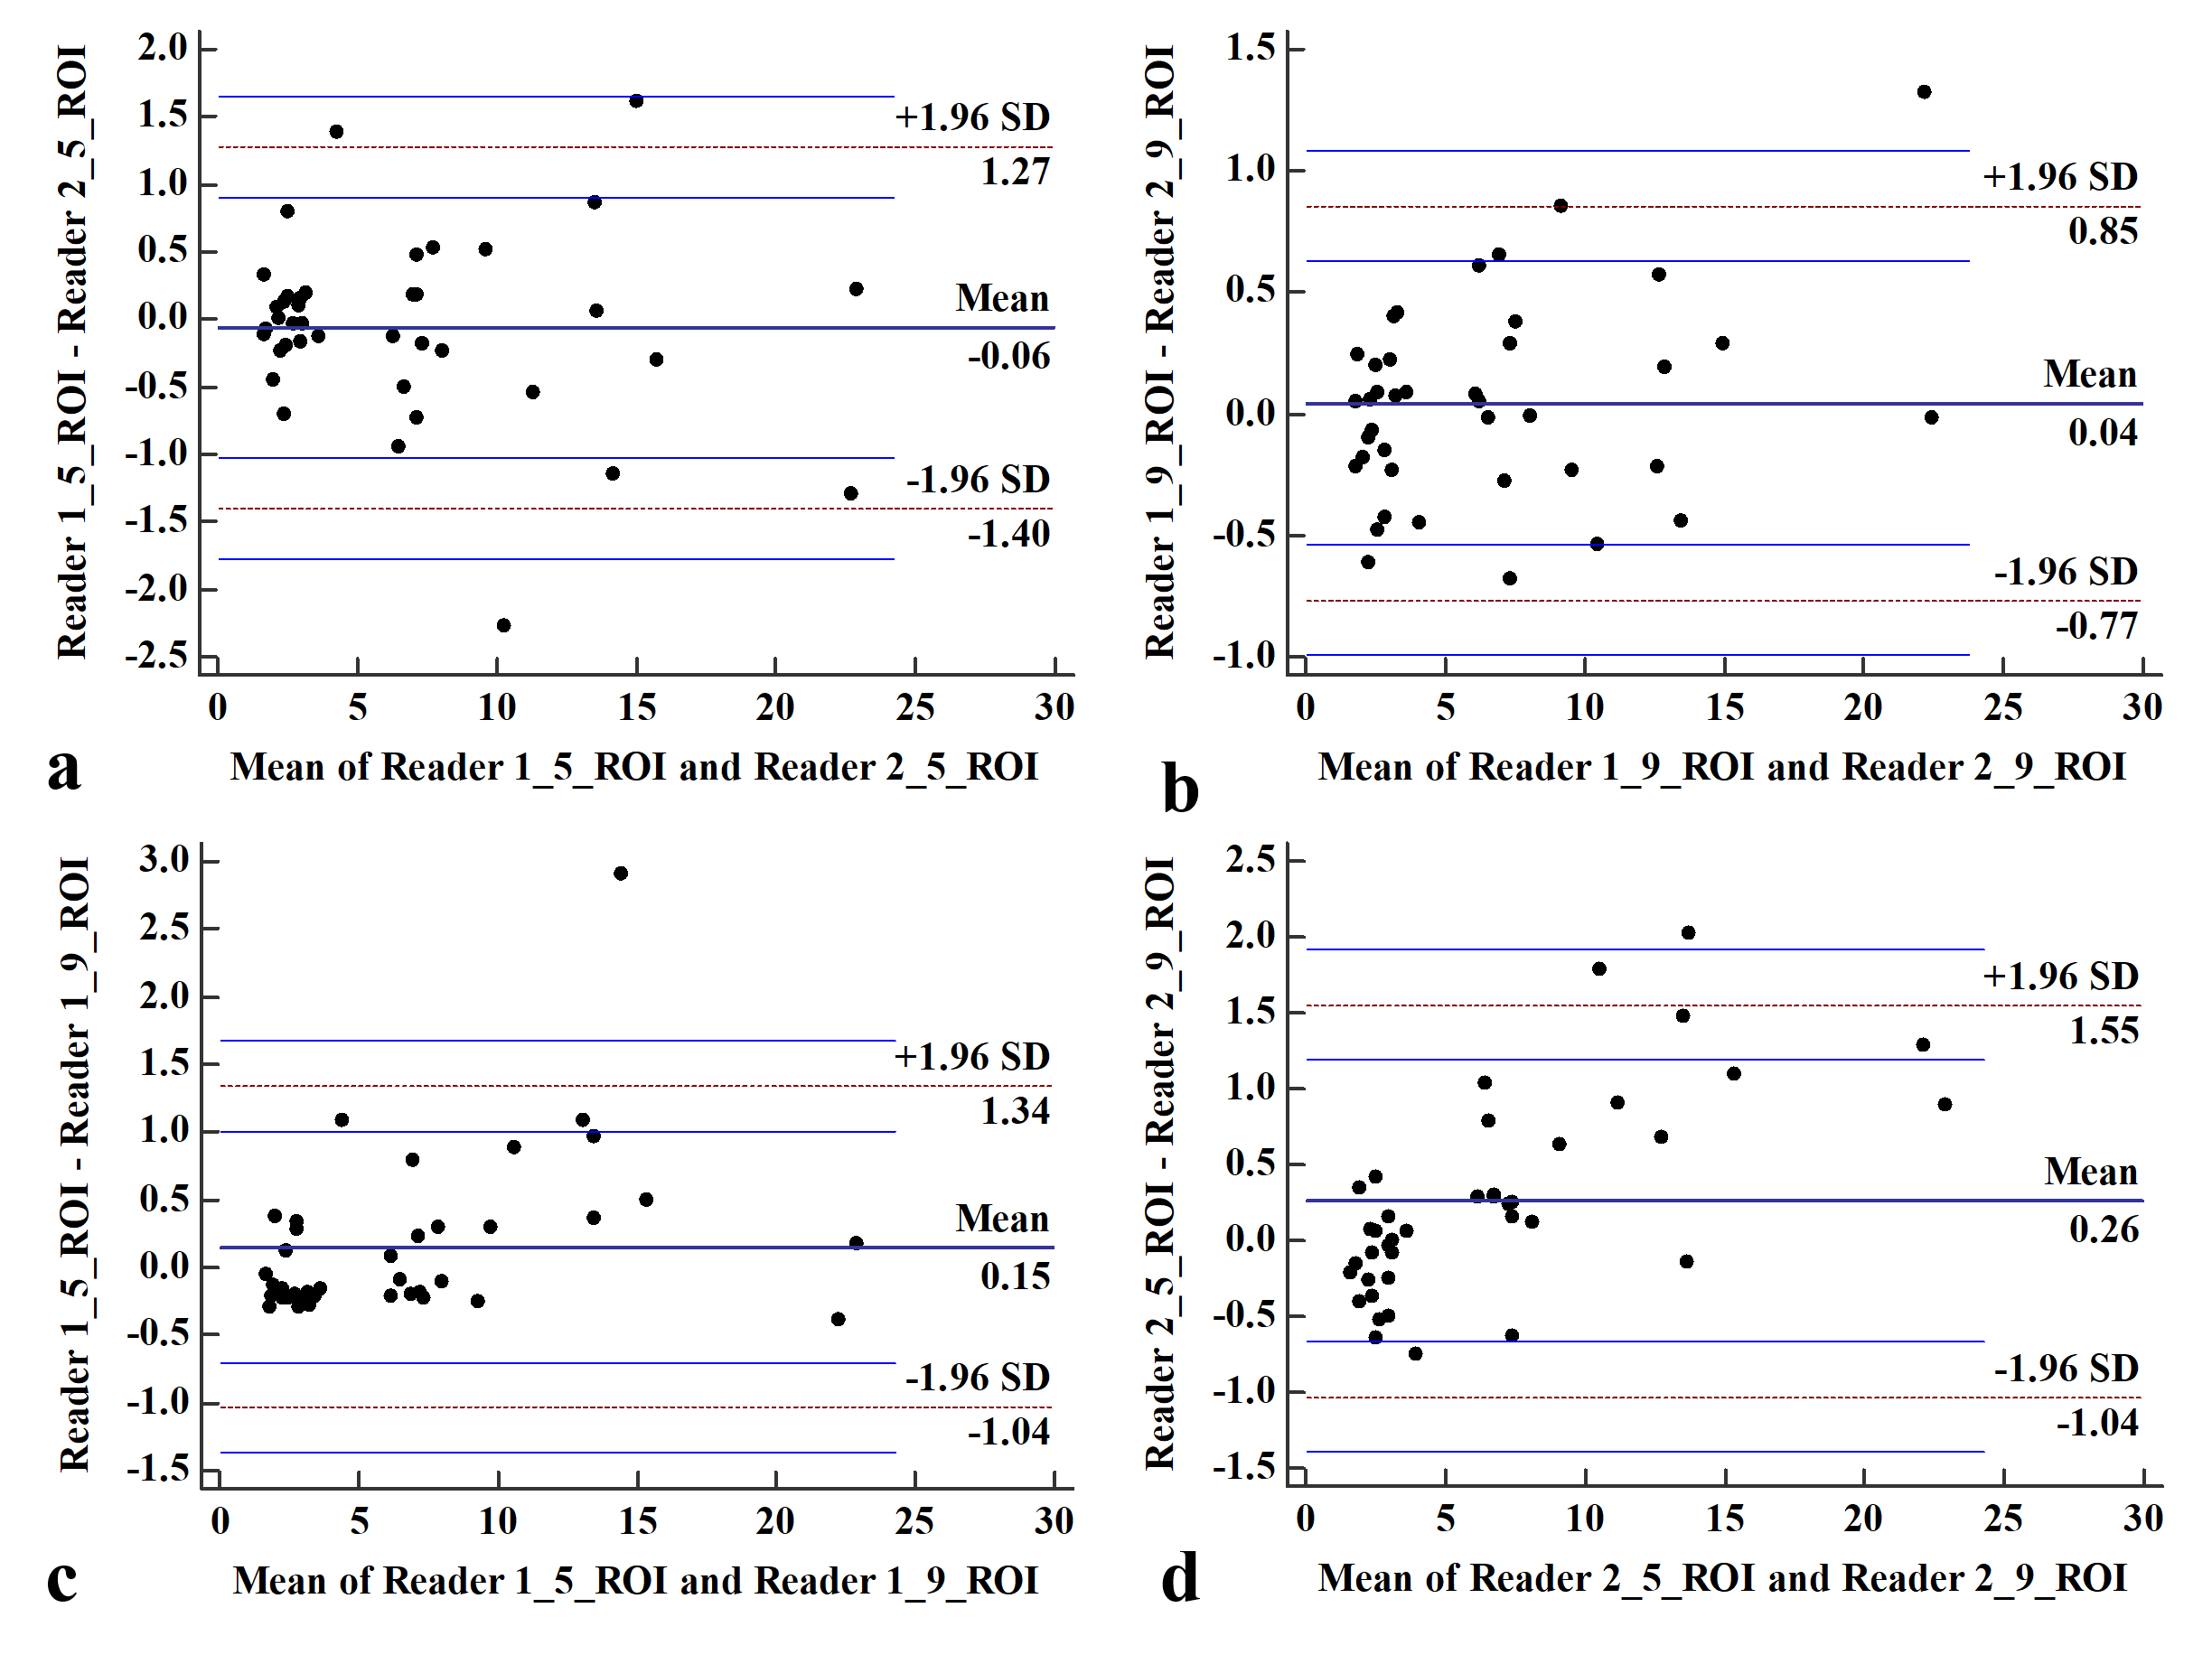
Figure 2. Bland-Altman analysis of hepatic PDFF assessments between two readers (a, b). Agreement of manual five ROIs and manual nine ROIs strategy (c, d). There was no significant bias in both readers and 95% limits of agreement were -1.04% to 1.34% for reader 1 and −1.04% to 1.55% for reader 2.
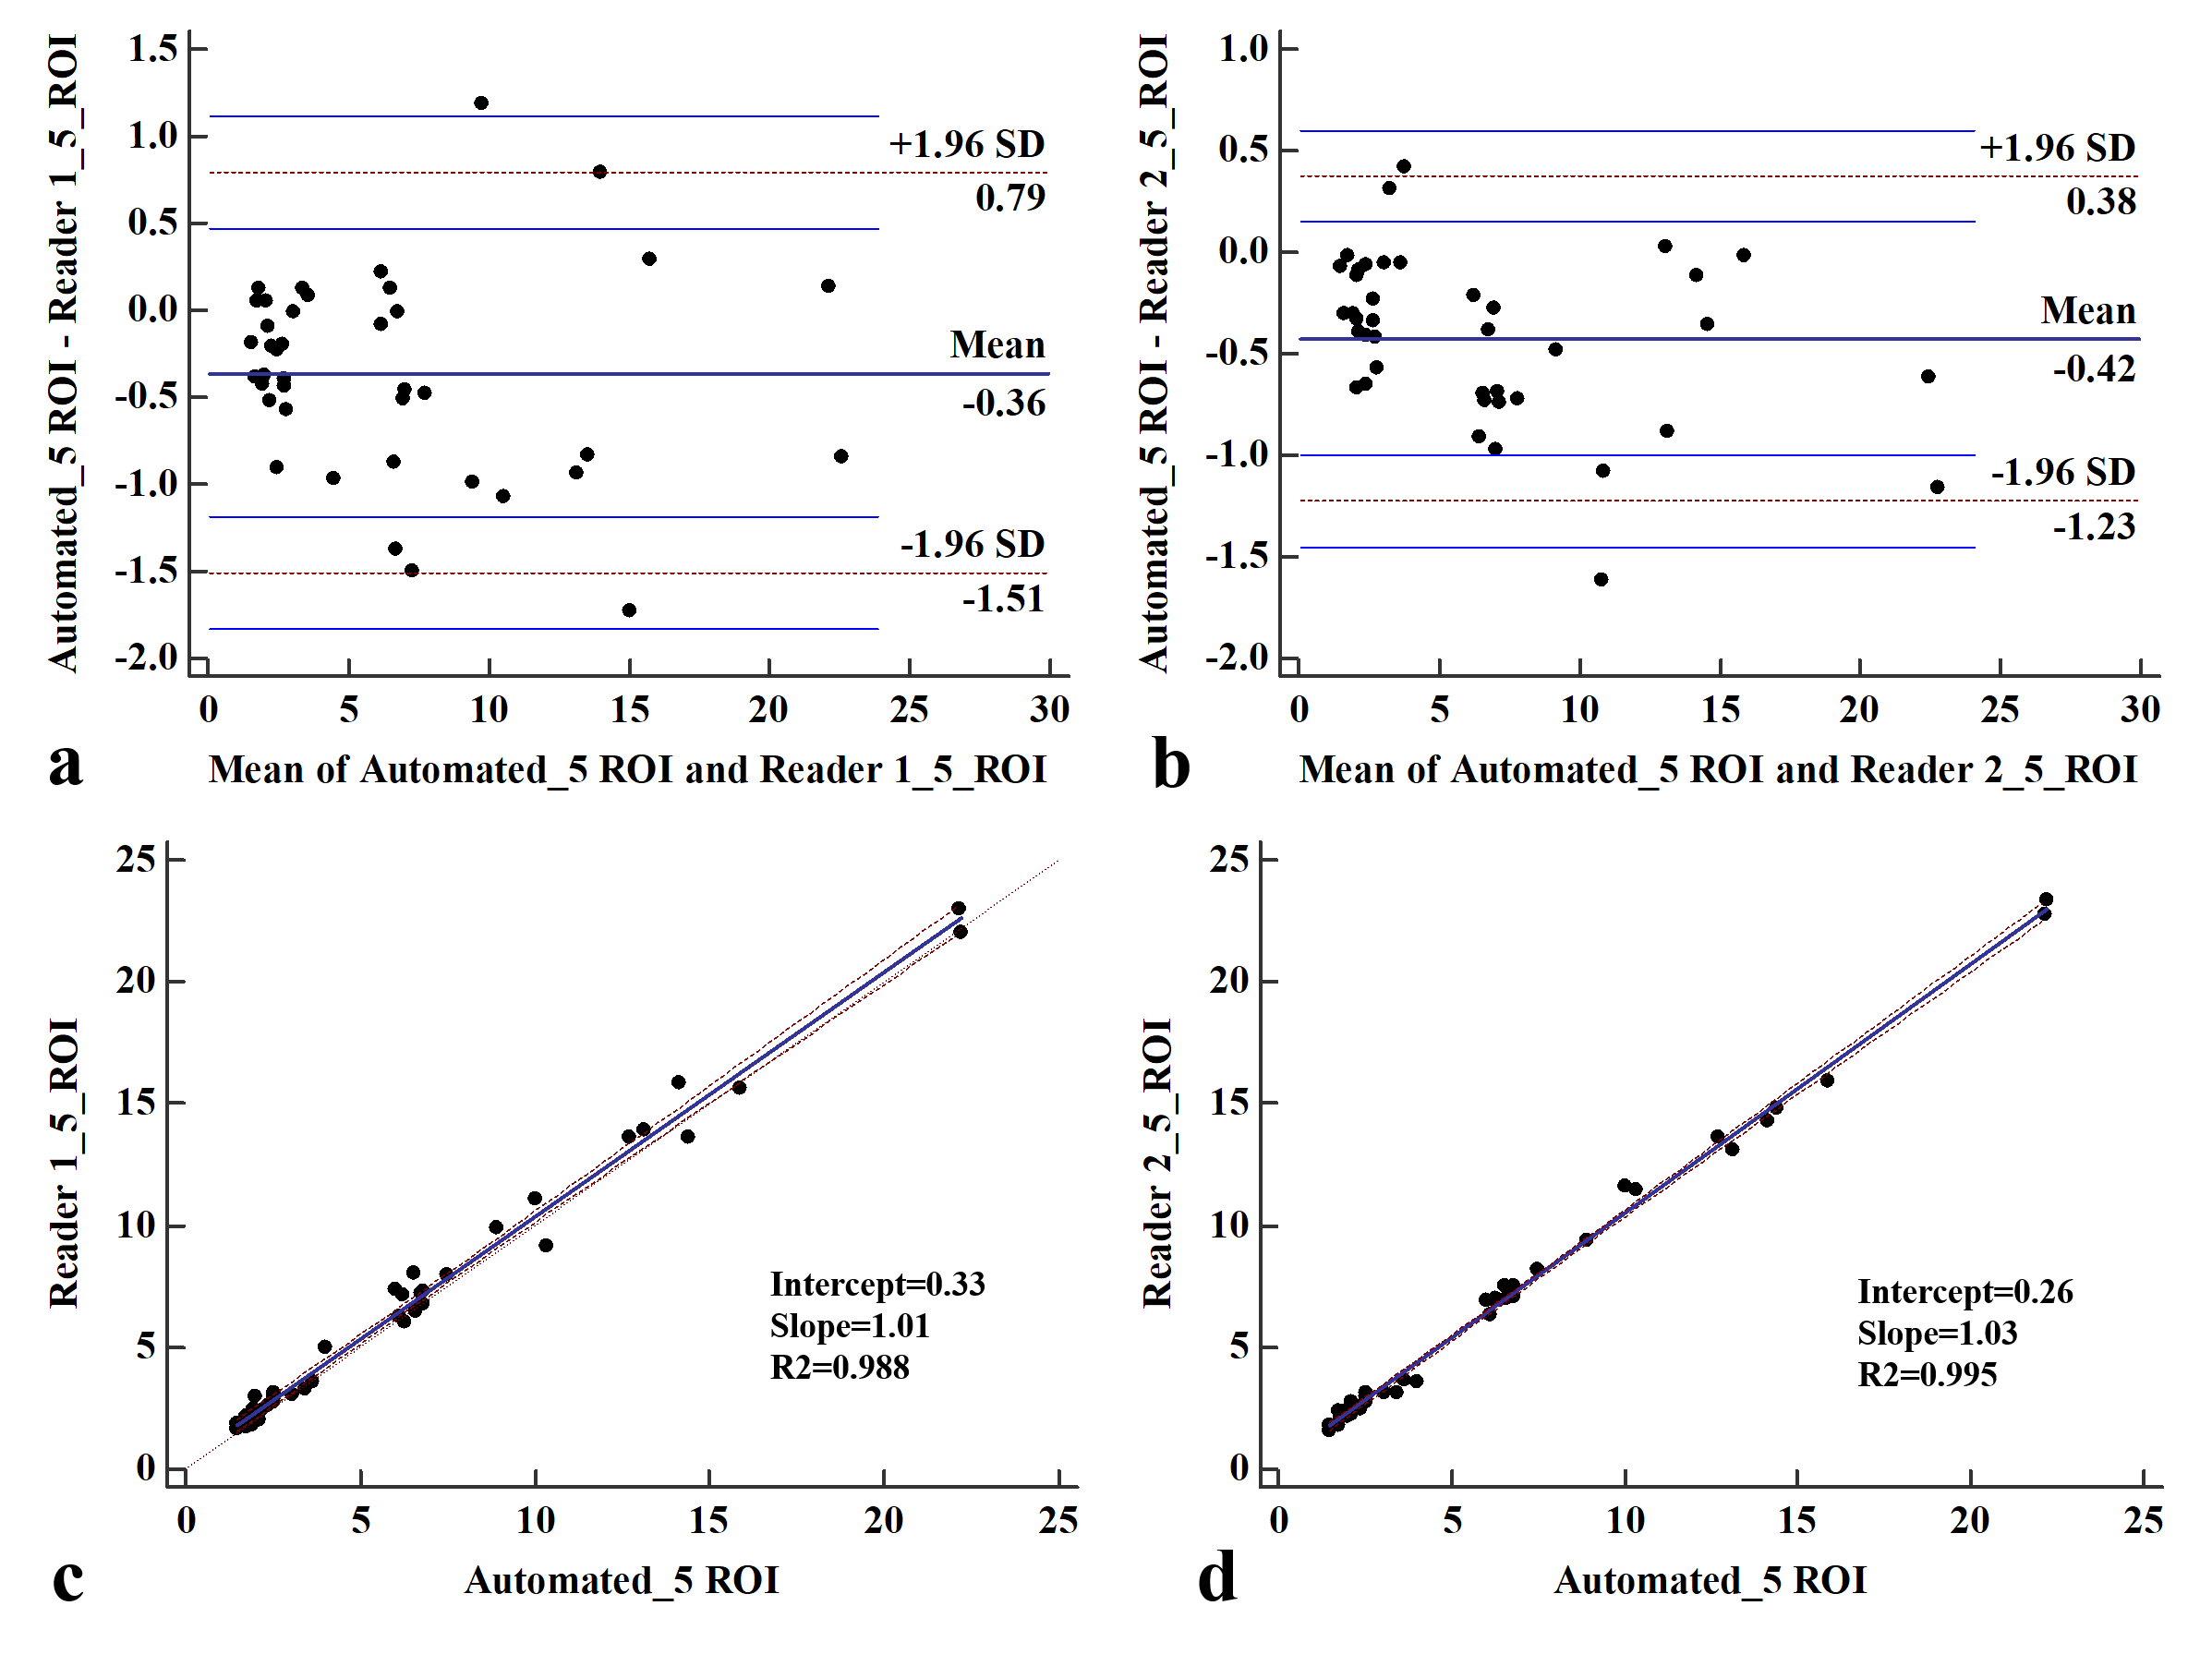
Figure 3. Agreement of the automatic and manual measurement method. Bland-Altman analysis (a, b) showed a low bias and narrow 95% limits of agreement. Linear regression (c, d) showed excellent correlation (Slop=1.01, 1.03) between hepatic PDFF measurements from manual and automated ROI placement.
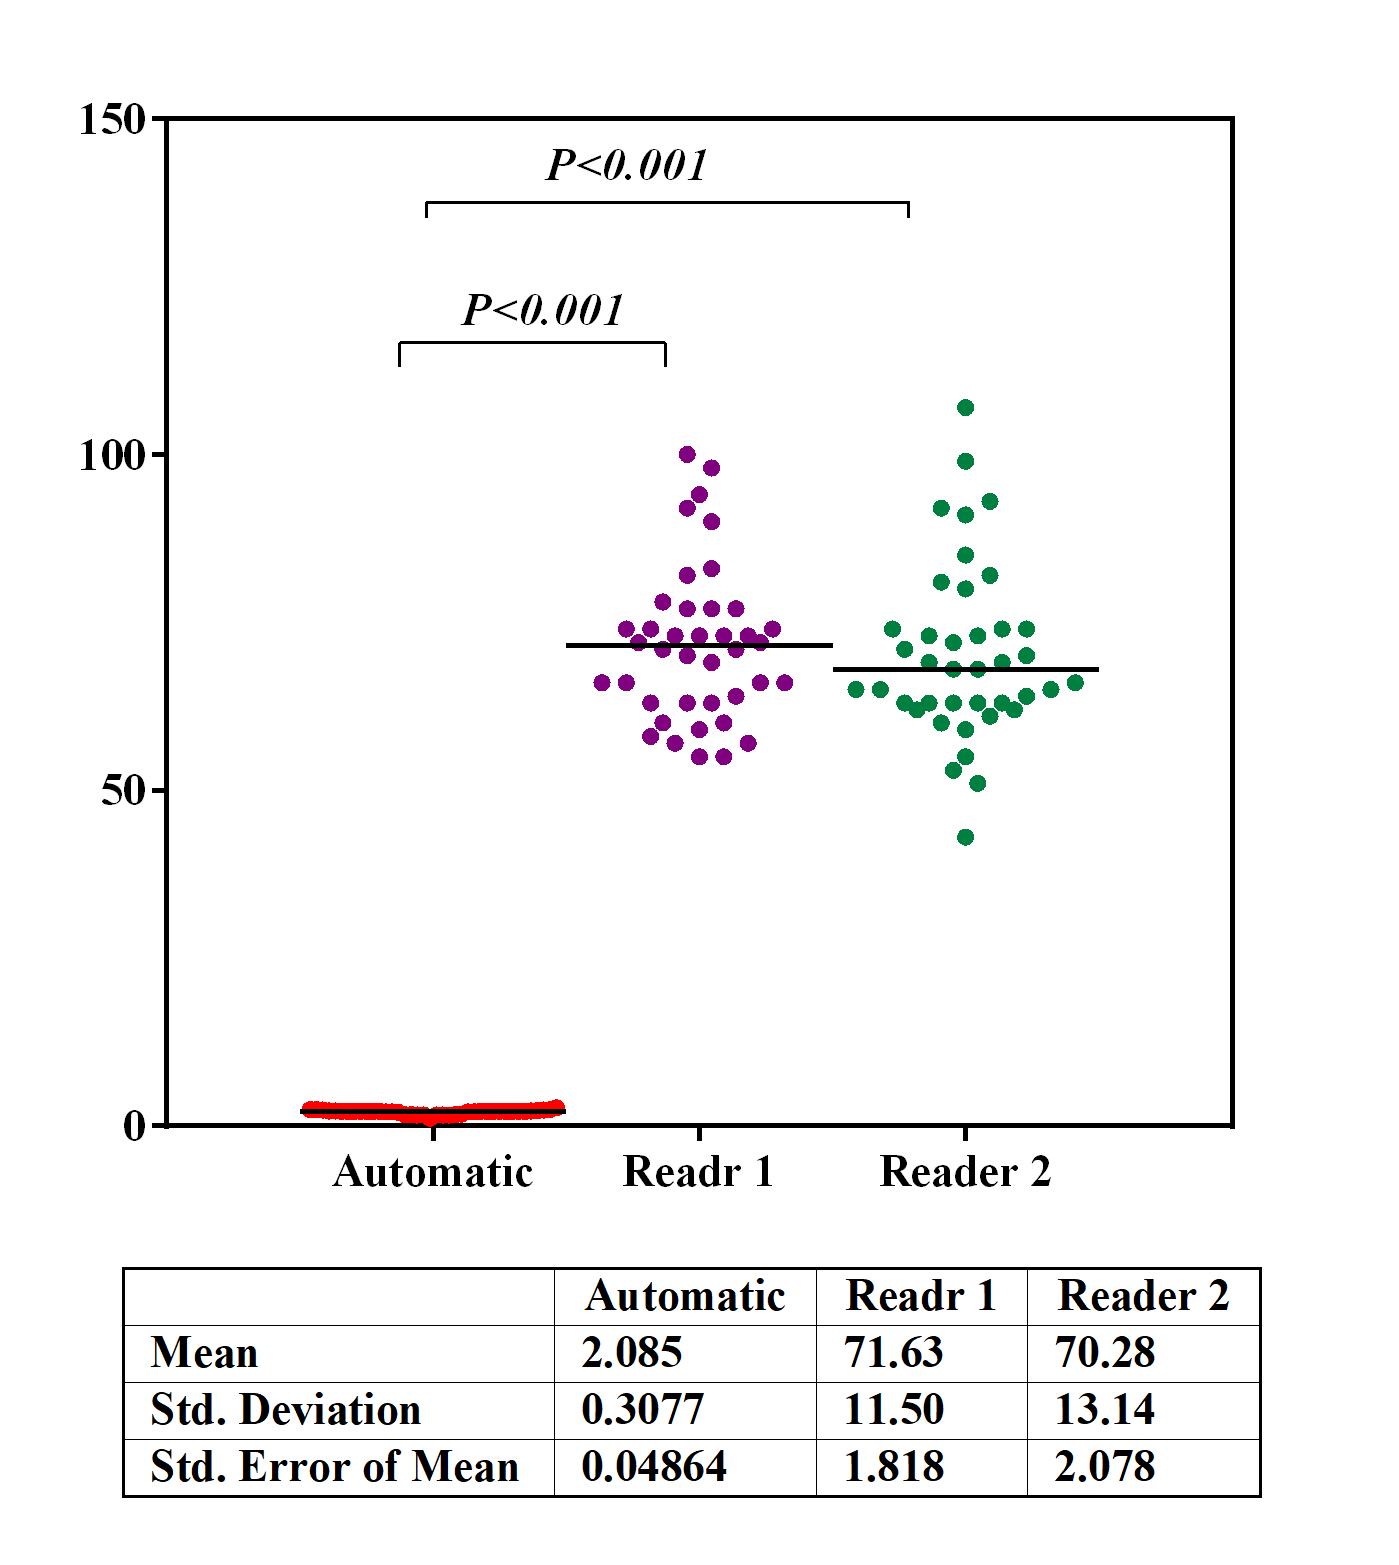
Figure 4. Time consumption(sec) for hepatic PDFF measurement compared between each reader and automatic method.