4392
Single-shot simultaneous T2* mapping and QSM using overlapping-echo acquisition for quantitative structural and functional MRI1Department of Electronic Science, Xiamen University, Xiamen, China, 2Center for Brain Imaging Science and Technology, College of Biomedical Engineering and Instrumental Science, Zhejiang University, Zhejiang, China, 3Department of Imaging Sciences, University of Rochester, Rochester, NY, United States
Synopsis
A quantitative magnetic resonance imaging (MRI) sequence GRE-MOLED based on overlapping-echo detachment is implemented to simultaneously achieve distortion-free T2* mapping and quantitative susceptibility mapping (QSM) in a single shot. The accuracy of quantitative structural MRI results is verified by comparison with the results from multi-shot method in in-vivo experiments. We also evaluate the technique through a statistical analysis of fMRI experiments with vision and motion tasks and demonstrate that it achieves higher BOLD sensitivity than conventional method.
Introduction
Fast, quantitative and high-quality imaging is the common pursuit of structural and functional MRI. Recent studies suggest that T2* mapping can significantly increase BOLD sensitivity in fMRI. This observation has led to a renewed interest in continued exploration of quantitative BOLD (qBOLD) fMRI signals.1,2 However, multi-echo EPI commonly used in qBOLD fMRI pipeline delivers echo image through additional echo train, which reduces achievable temporal resolution and increases sensitivity to subject motion. Besides, conventional EPI can only acquire a small number of echoes and suffers from geometric distortion and image blurring, which limits its application in clinics. In this work, we propose a method that utilizes overlapping-echo detachment (OLED) technique3-6 to improve acquisition efficiency, termed gradient-echo multiple overlapping-echo detachment (GRE-MOLED) method, and apply it in quantitative structural MRI (sMRI, including T2* mapping and quantitative susceptibility mapping (QSM)) and functional MRI (qBOLD). We demonstrate that the GRE-MOLED enables high-quality quantitative sMRI and high BOLD sensitivity in fMRI.Methods
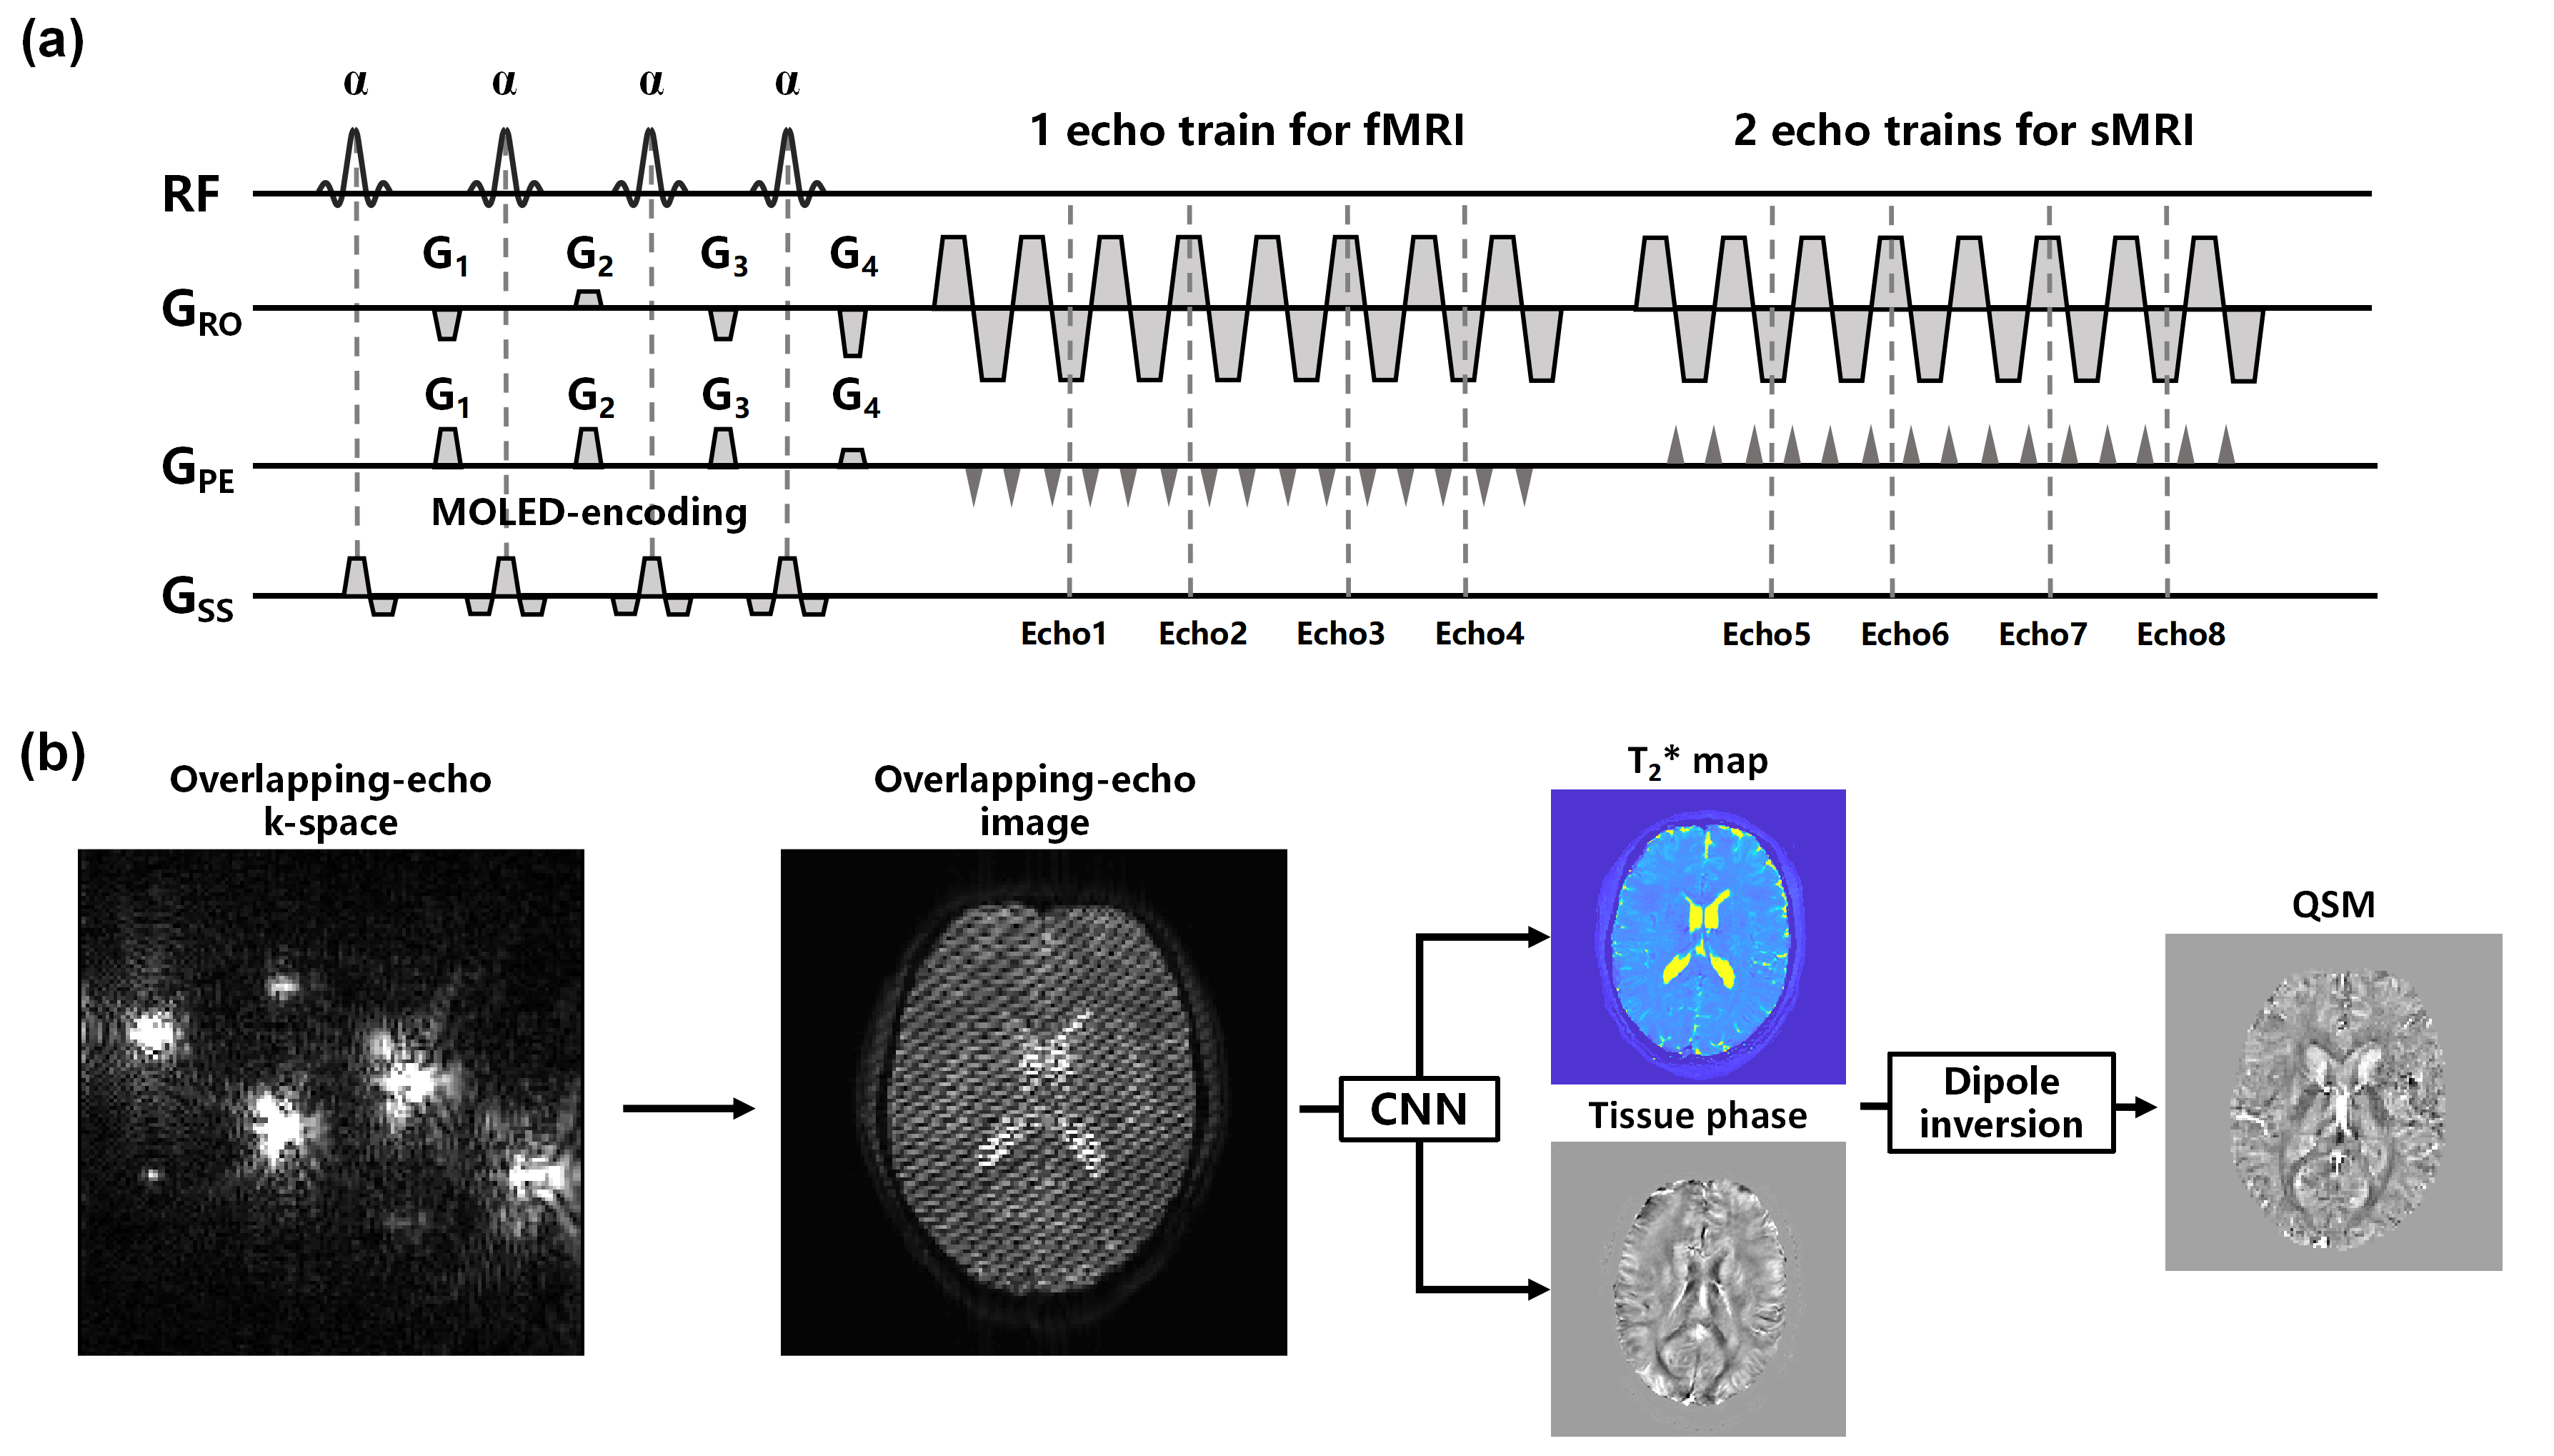
Pulse sequence: Figure 1(a) shows the diagram of GRE-MOLED sequence with multiple echo trains. The four excitation pulses with a same flip angle α = 30° are used to prepare gradient echoes with different evolution time. The echo-shifting gradients G1, G2, G3 and G4 are used to shift the four echoes from the k-space center at the same k-space data collection.In vivo experiments: In vivo data were acquired from 5 healthy volunteers, on a 3T whole-body MRI system with a 20-channel head coil (MAGNETOM Prisma, Siemens Healthineer, Erlangen, Germany). A conventional 3D GRE sequence and the proposed 2D GRE-MOLED were acquired for comparison and quantitative analysis in structural MRI scans. All functional MRI scans were acquired using the GRE-EPI sequence followed by the GRE-MOLED sequence. The acquisition parameters were as follows: FOV = 22×22 cm2, voxel size = 1.7×1.7 mm2, slice thickness = 3.5 mm (fMRI) and 1.7 mm (sMRI), TR = 3.2 s (fMRI) and 12 s (sMRI), slice number = 32 (fMRI) and 64 (sMRI), GRAPPA acceleration factor = 2, echo spacing (ESP) = 0.93 ms, and fMRI measurements = 120. The TE was 30 ms for GRE-EPI and 11.8, 32.7, 53.1, 76.5 ms (four overlapping echoes) for GRE-MOLED. After a resting state scan, a conventional block-design visual stimulation task with a 30 s “checkerboard” followed by a 30 s black field on-off blocks and motion task with fist exercise were performed for the fMRI acquisitions. A T1-weighted anatomical image was also acquired using T1-MPRAGE sequence with resolution of 1×1×1 mm3.
Parameters reconstruction and data analysis: As shown in Figure 1(b), a convolutional neural network (CNN) consisting of encoder sub-network and decoder sub-network was applied to perform end-to-end T2* and tissue phase mapping from overlapping-echo images. QSM reconstruction of the tissue phase was performed in open-source STI Suite with iLSQR algorithm7. Totally 7000 pairs of synthetic images were generated for network training through Bloch simulation. As for fMRI data, preprocessing and statistical analysis were performed on conventional GRE-EPI data and MOLED T2* maps using the statistical parametric mapping (SPM) software. A first level general linear model was used for regression analysis and the p value = 0.001 was used in the statistical maps.
Results
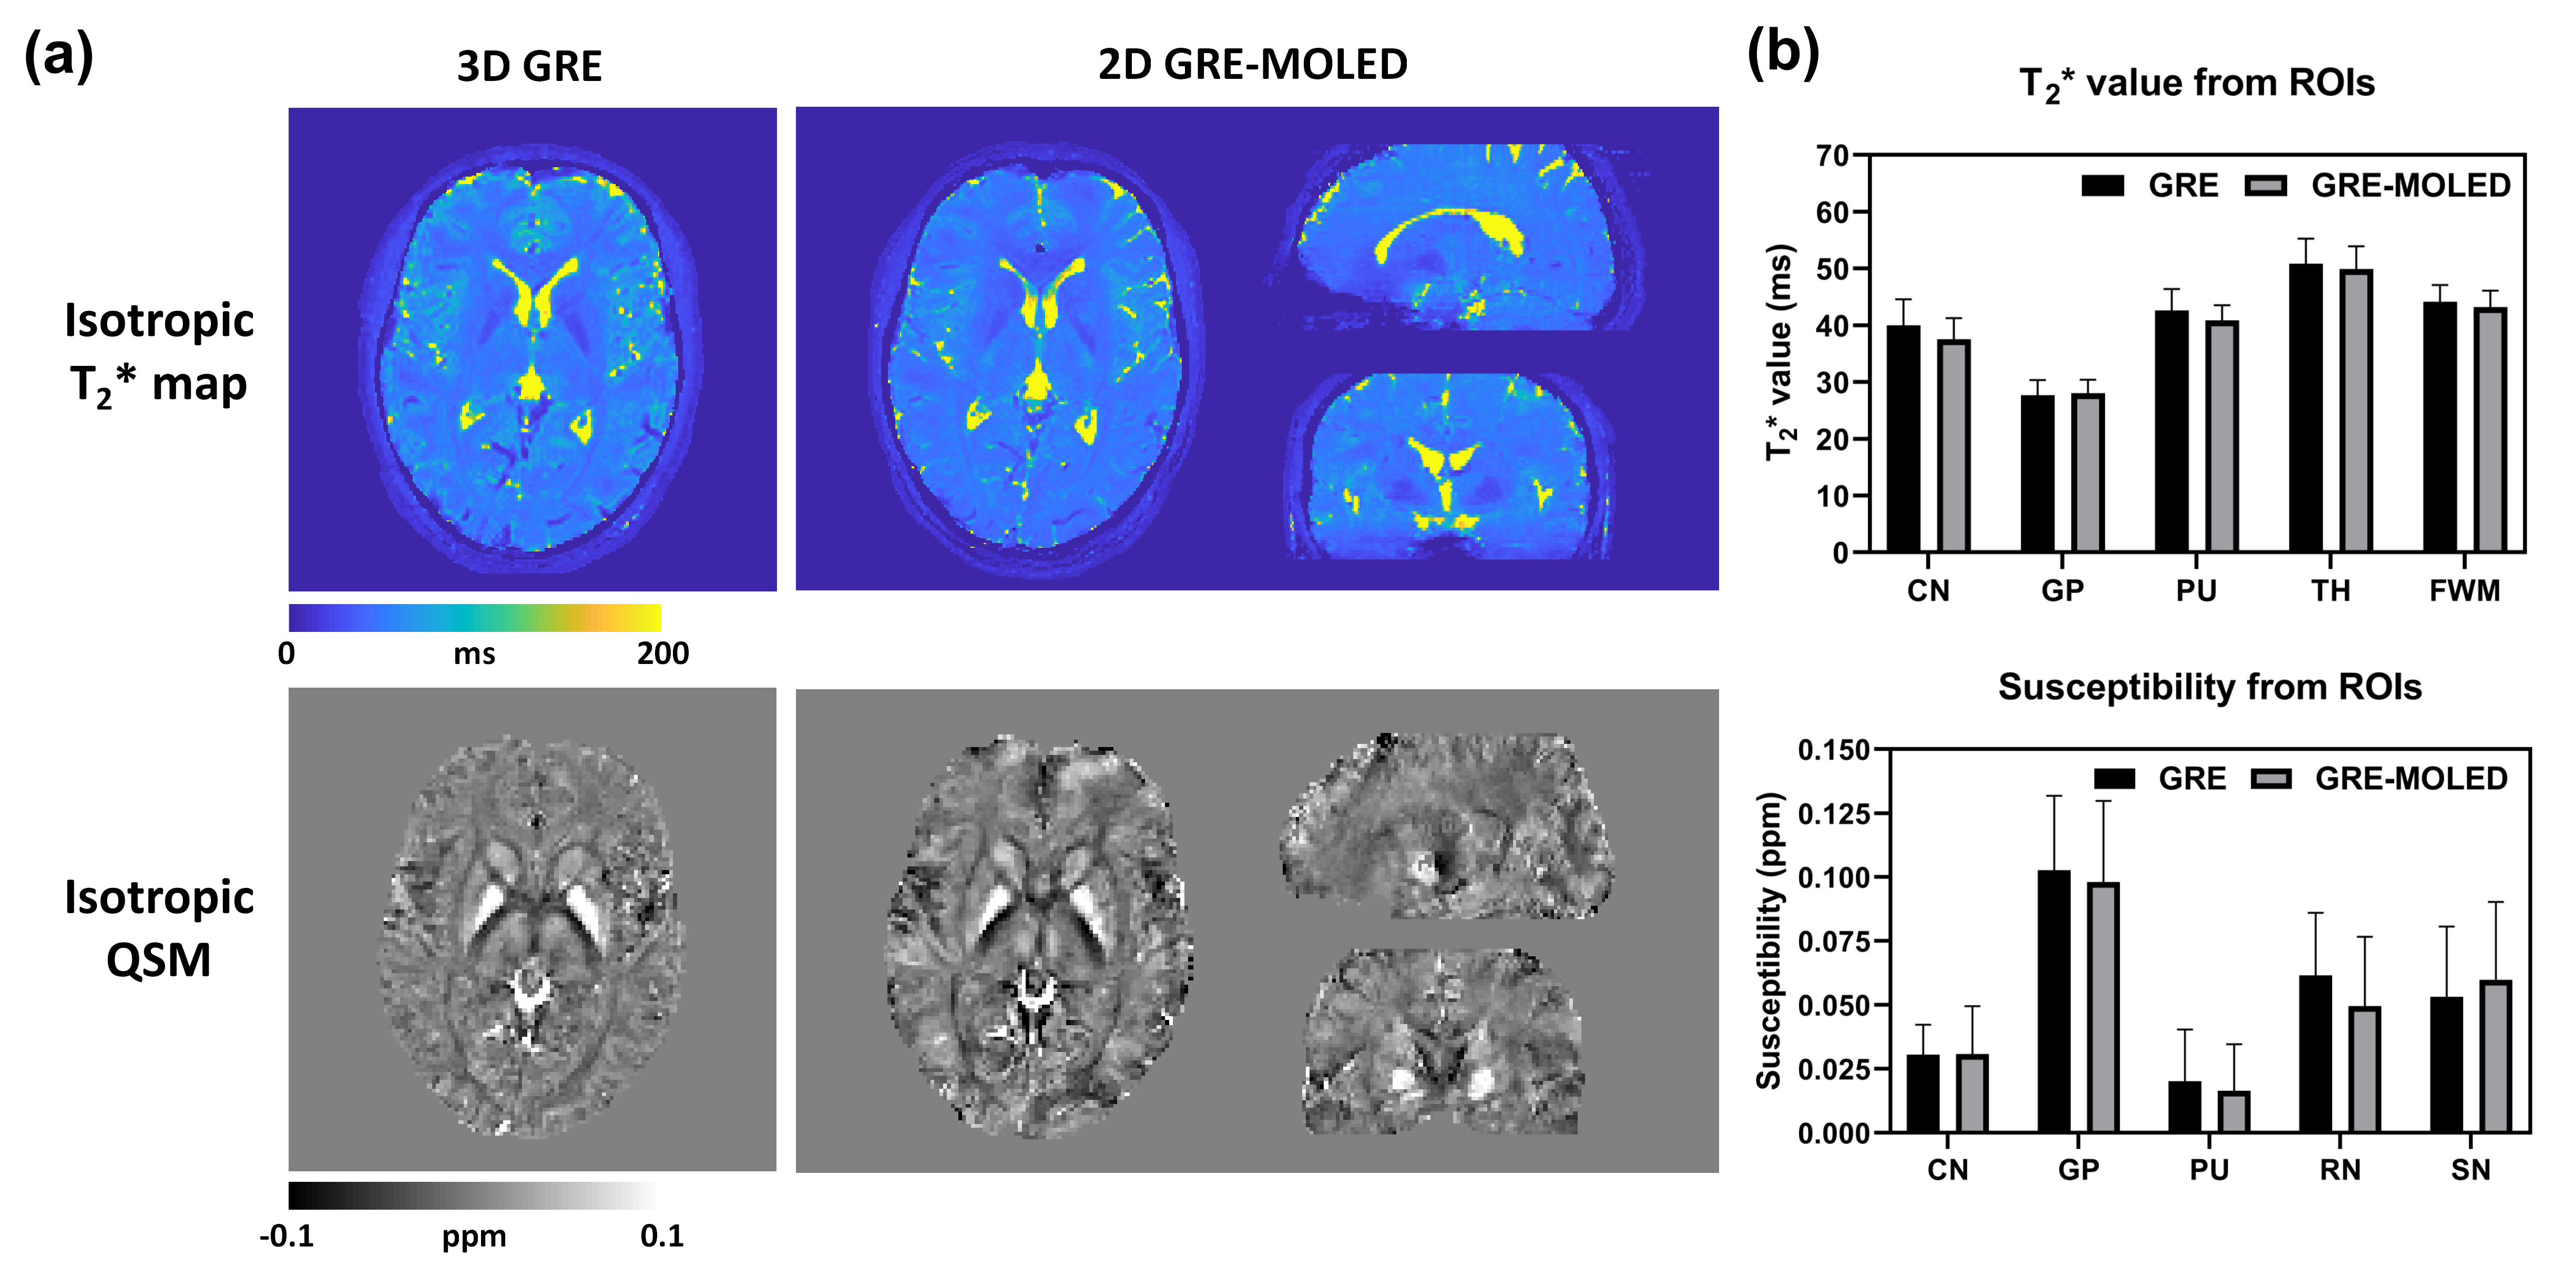
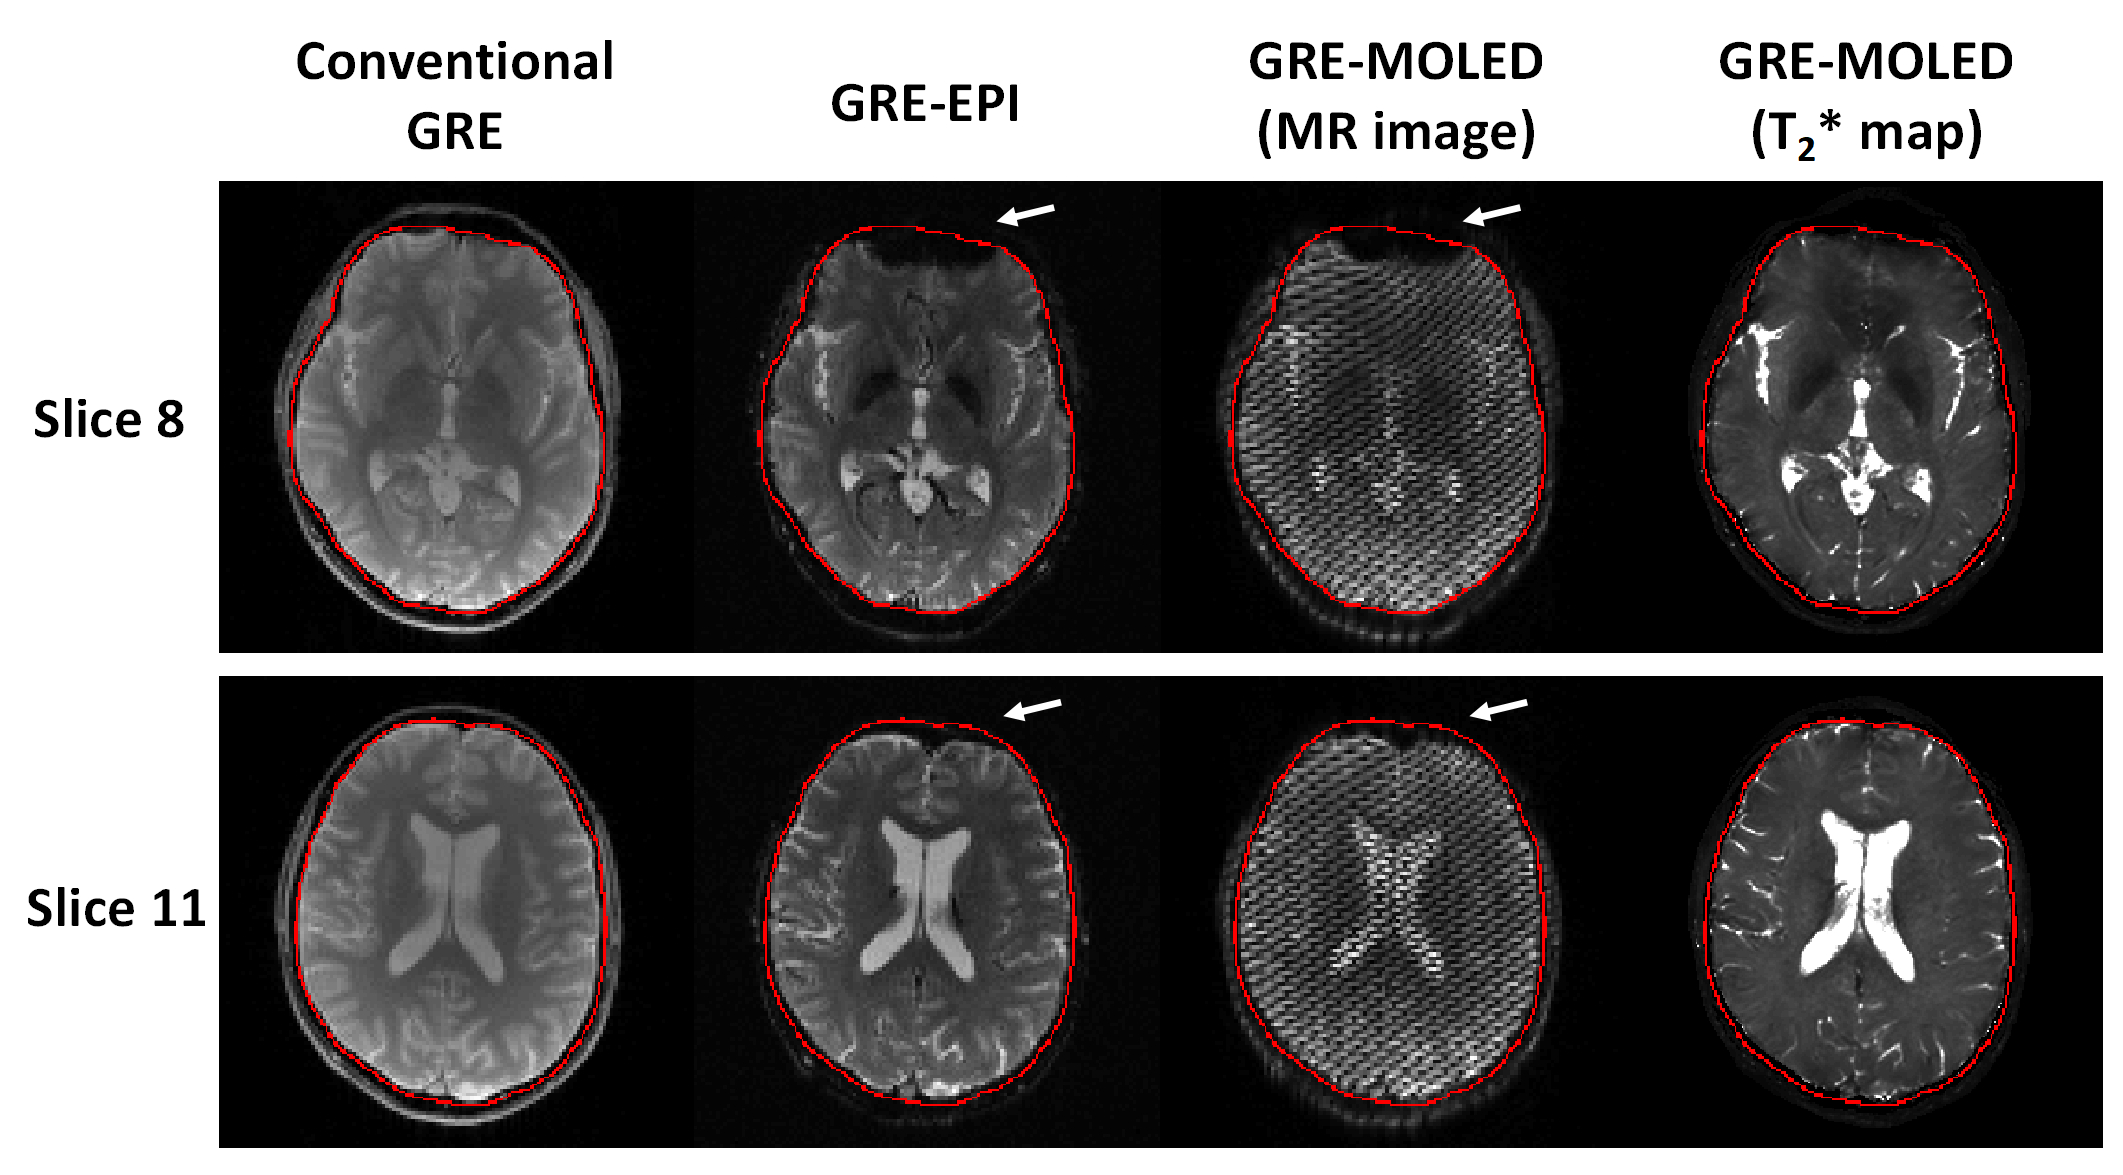
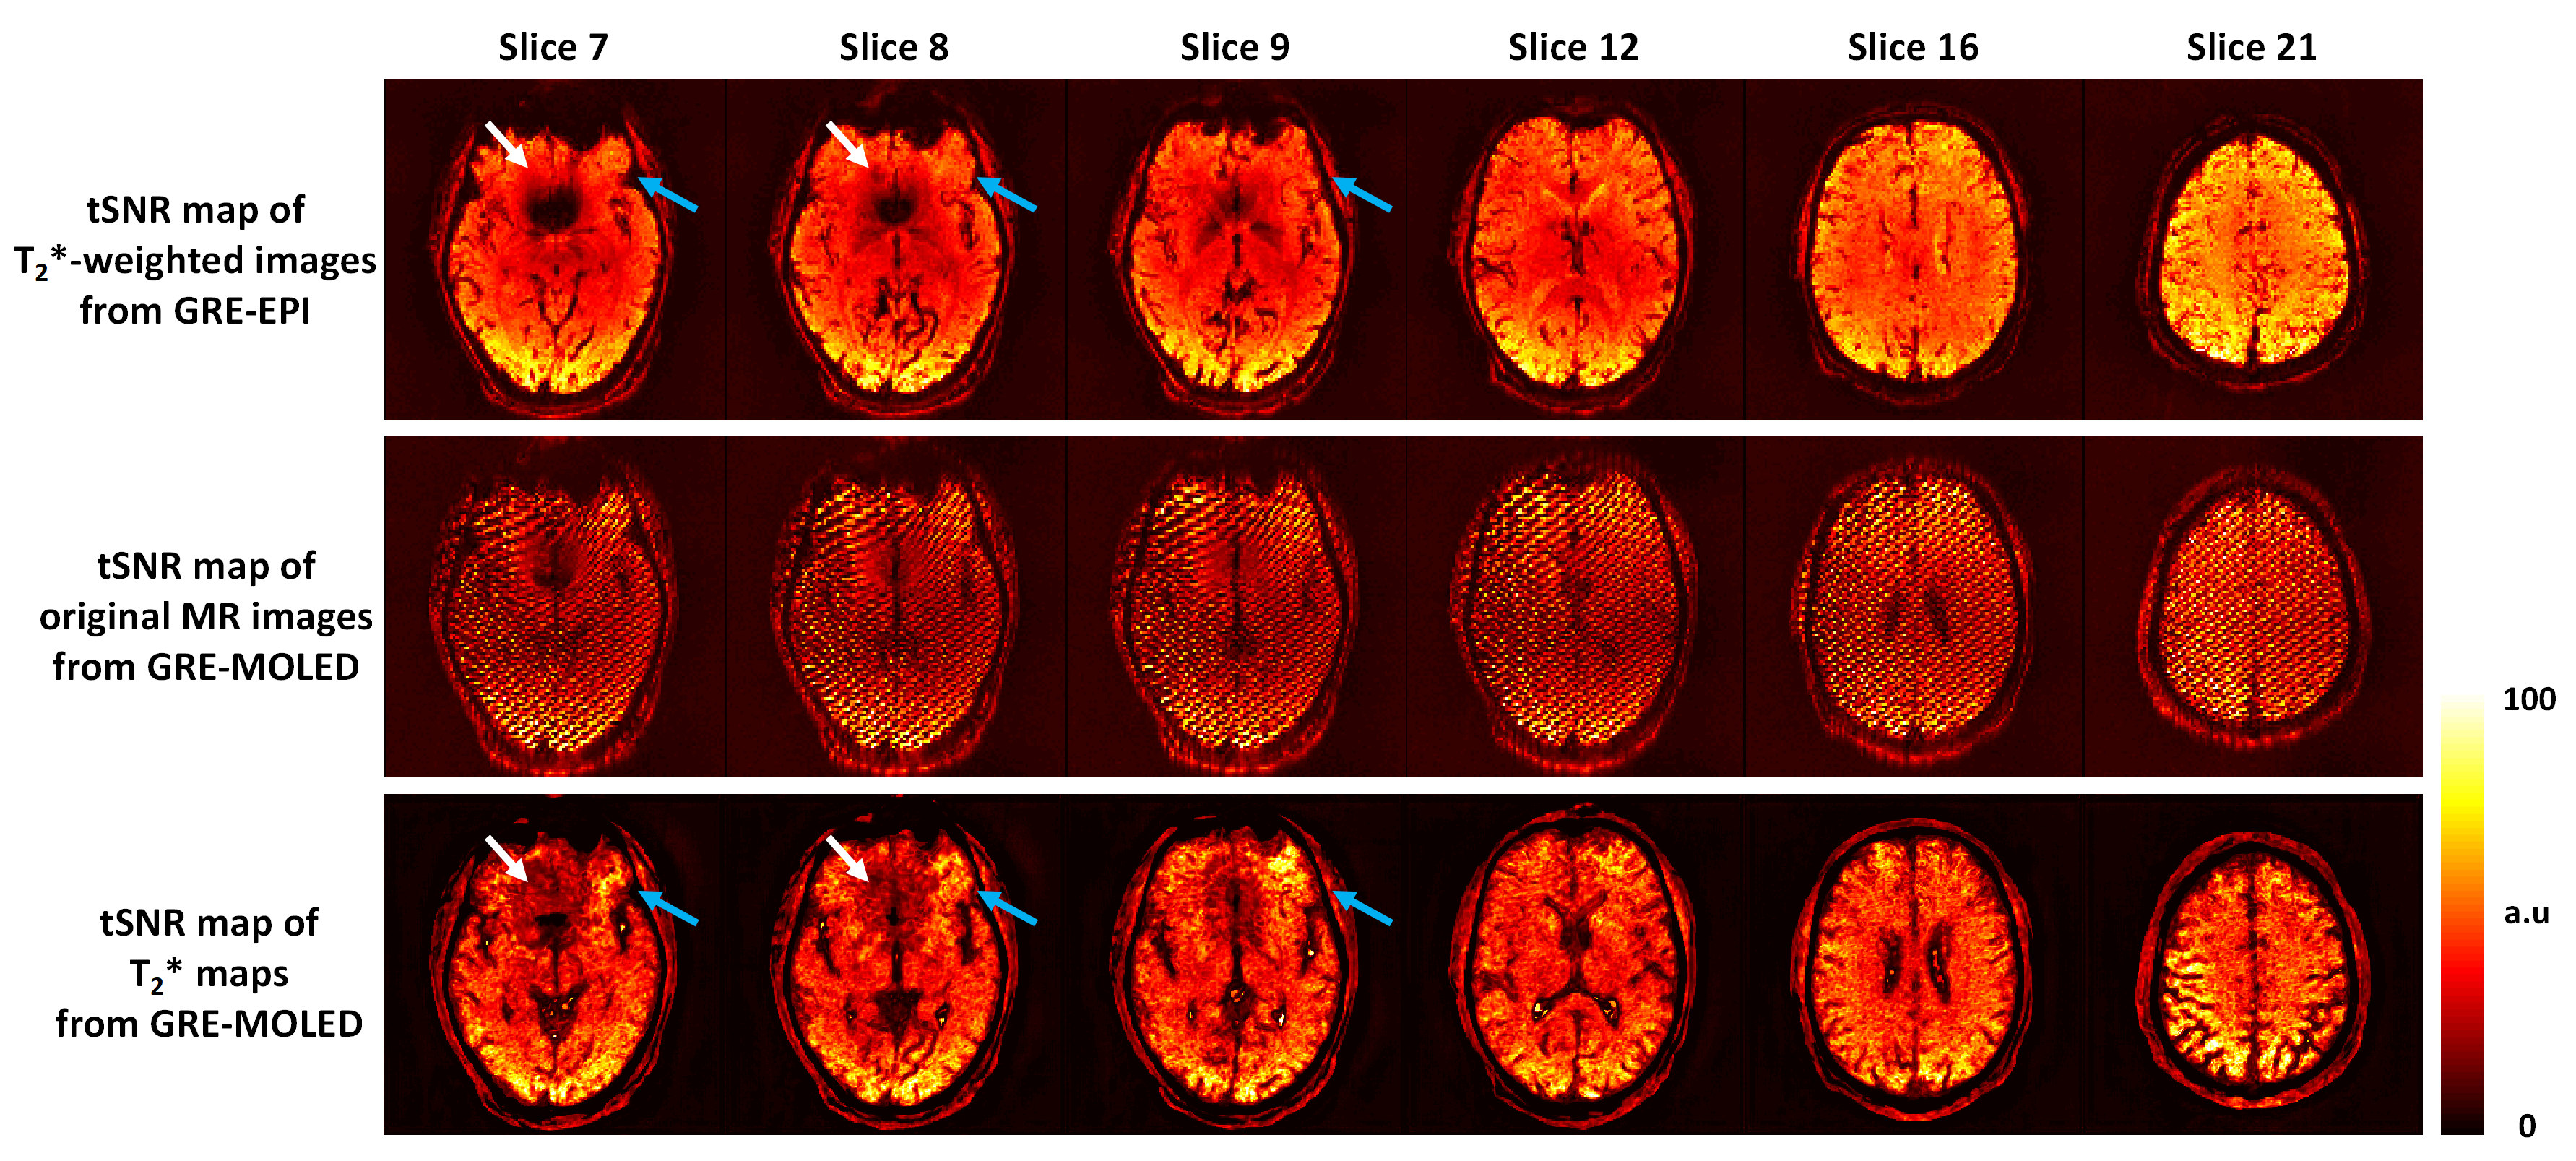
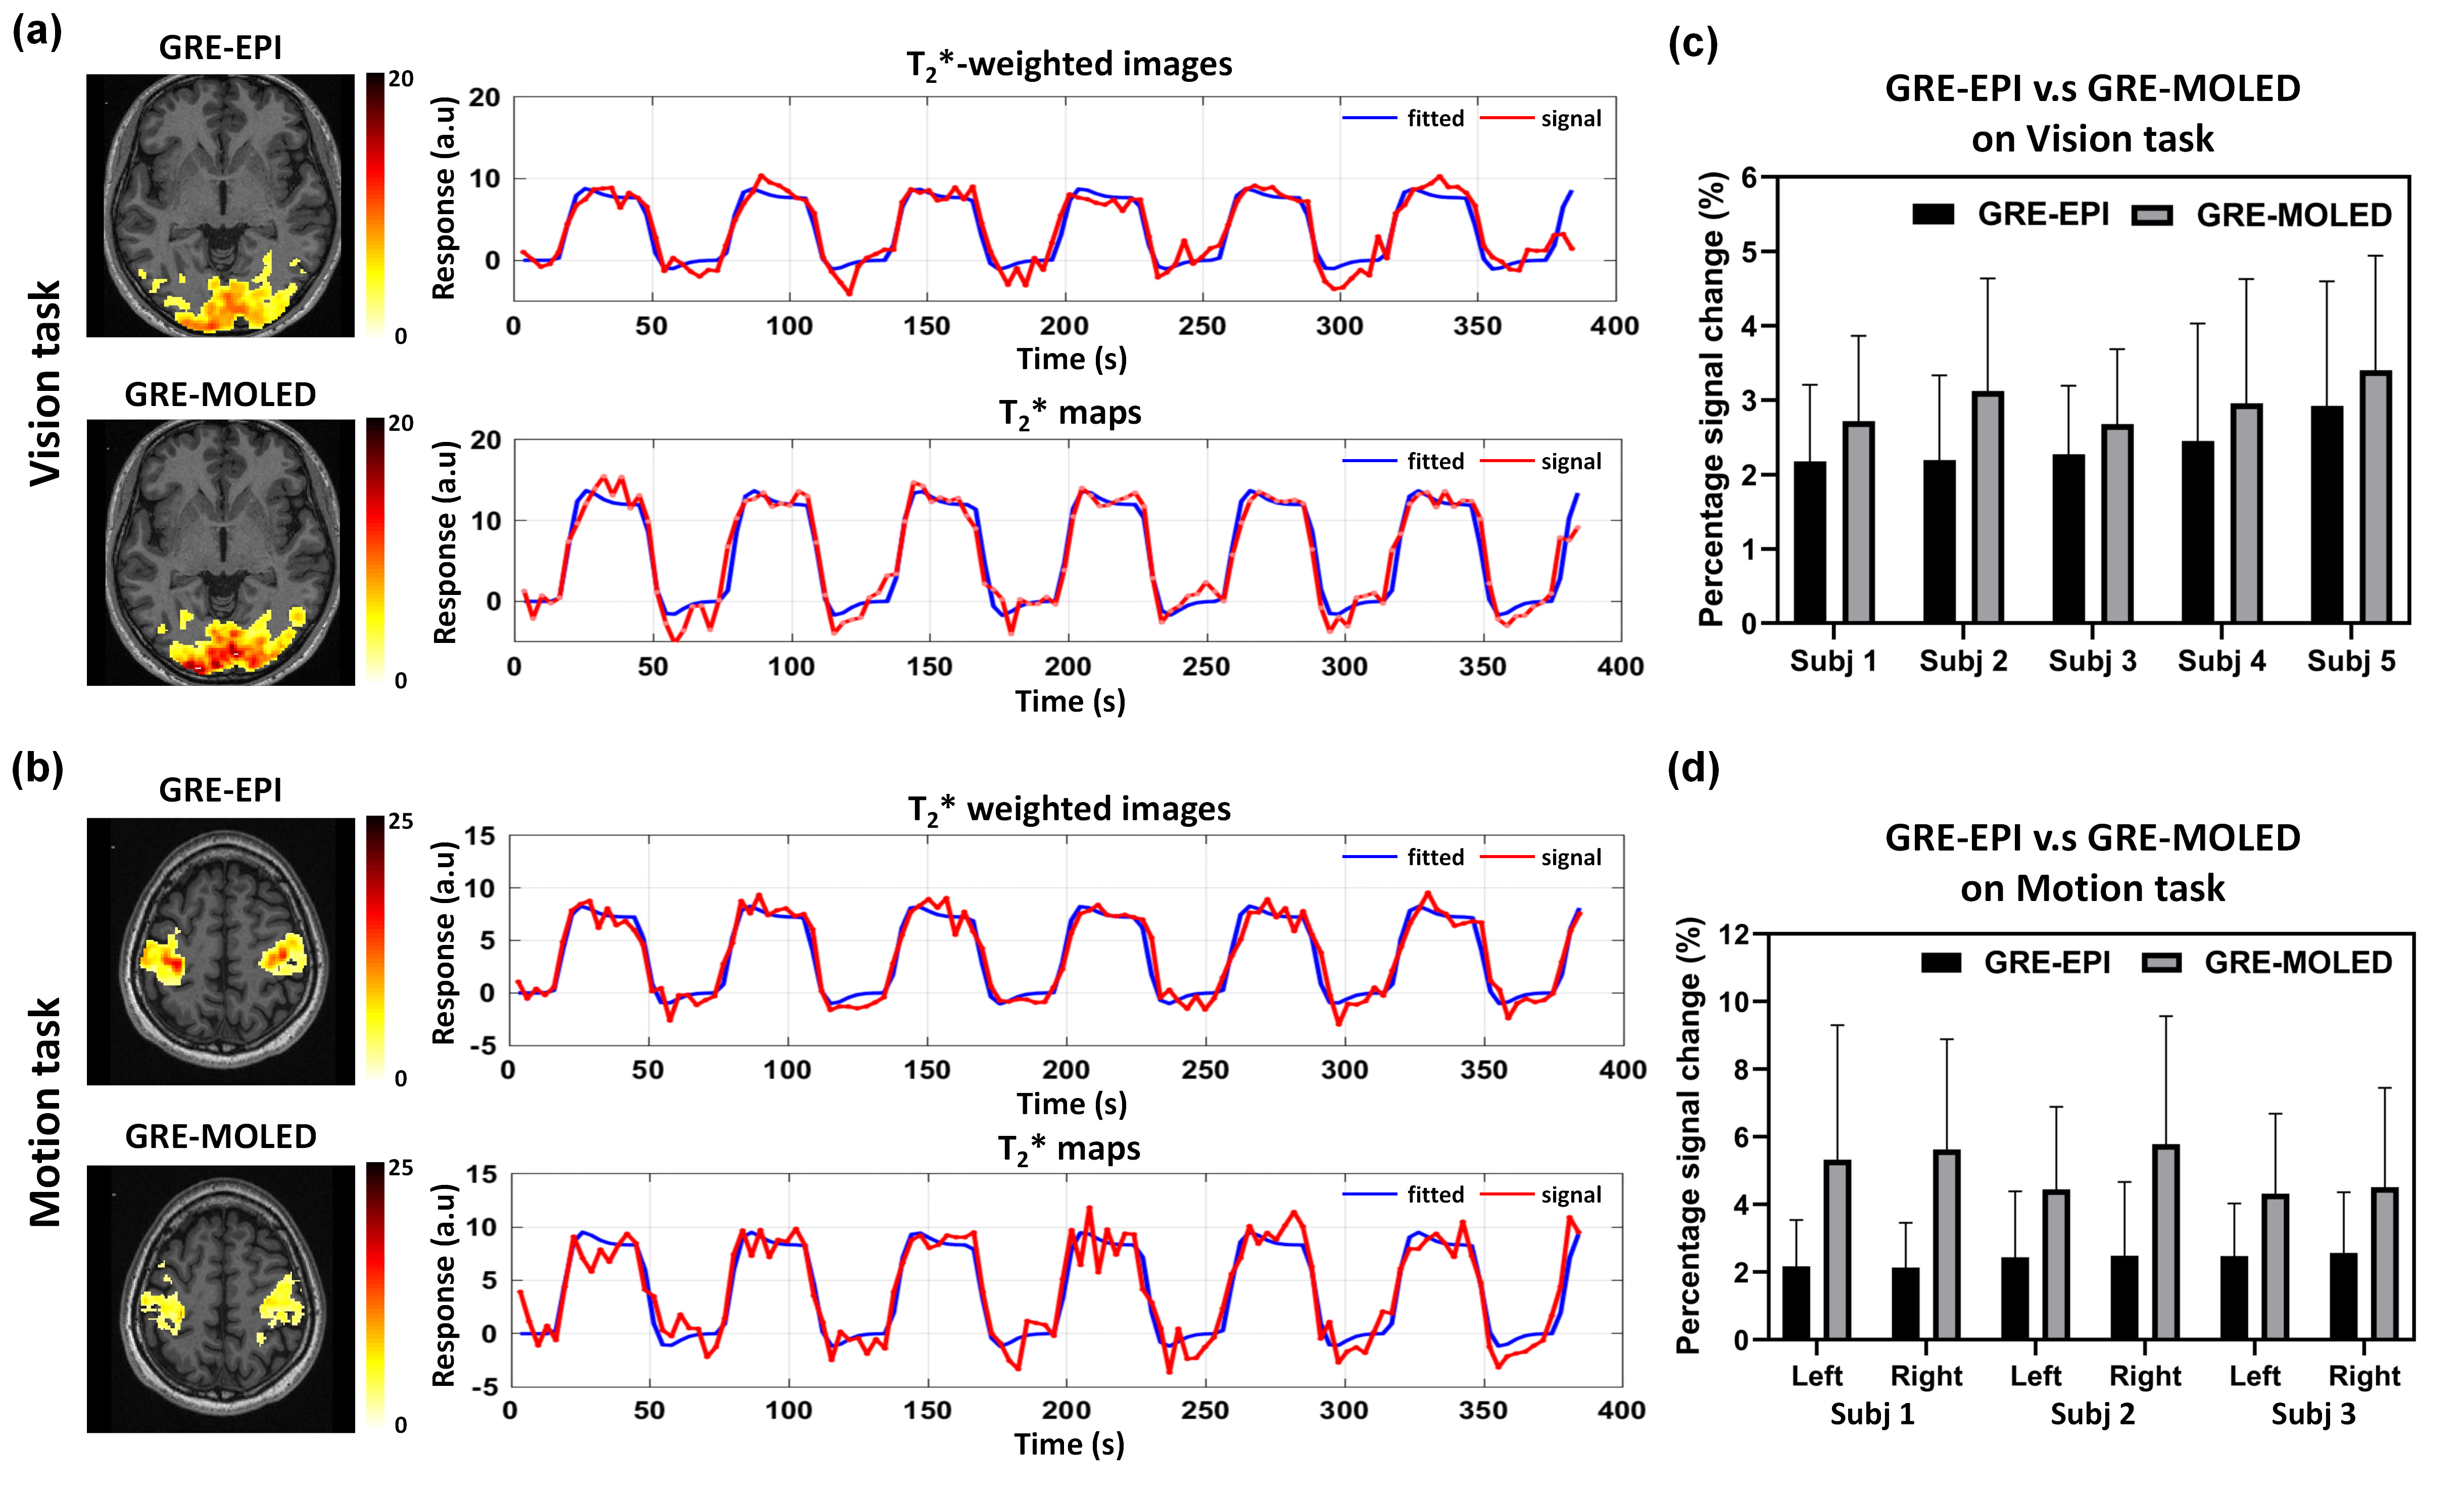
Figure 2 shows the visual and quantitative results of reconstructed T2* maps and QSM of 1.7 mm isotropic GRE-MOLED and GRE acquisition. Single-shot GRE-MOLED provides high-quality images in 12 s, close to the results of multi-shot GRE in 6 min, and achieves high accuracy in ROI analysis. Figure 3 shows the distortion correction capability of GRE-MOLED with CNN reconstruction. Compared with GRE-EPI and original MR image from GRE-MOLED, the reconstructed T2* maps are free from geometric distortion as the brain boundaries are identical to those from distortion-free GRE. The temporal signal-to-noise ratio (tSNR) maps calculated from resting-state scans are provided in Figure 4. It is evident that the T2* maps of GRE-MOLED recover some signal lost and show increases in tSNR in the prefrontal regions. However, in other regions (especially in gray matter), the tSNR of GRE-EPI is much higher compared with both original overlapping-echo images and T2* maps. Figure 5 illustrates the results of fMRI to vision task and motion task from T2*-weighted images and T2* maps using conventional method and GRE-MOLED. The percentage signal change (PSC) for BOLD sensitivity representation were calculated by parameters estimates and contrast maps, as described in previous work8. The results show a substantial increase in the T2* map time series (from GRE-MOLED) in all tasks and subjects.Discussion and conclusion
We have demonstrated that GRE-MOLED can provide simultaneous T2* mapping and QSM comparable to traditional multi-shot GRE within a single shot. As quantitative T2* is introduced with high temporal resolution, we see a significantly increased BOLD sensitivity compared with conventional method. T2* map time series achieves higher BOLD sensitivity with lower tSNR, therefore, we believe that the separation of T2* and M0 can obviously reduce system-level effects (e.g. subject-motion and inflow) from the original T2* signals, which has been reported previously1. These results show the potential of GRE-MOLED for quantitative structural and functional MRI, which provides a means of detecting BOLD signals with higher sensitivity under standard fMRI pipeline.Acknowledgements
This work was supported by the National Natural Science Foundation of China under grant numbers 82071913 and 11775184, and Science and Technology Project of Fujian Province 2019Y0001.References
1. Heunis S, Breeuwer M, Caballero-Gaudes C, et al. The effects of multi-echo fMRI combination and rapid T2*-mapping on offline and real-time BOLD sensitivity. Neuroimage 2021; 238: 118244.
2. Weiskopf N, Klose U, Birbaumer N, et al. Single-shot compensation of image distortions and BOLD contrast optimization using multi-echo EPI for real-time fMRI. Neuroimage 2005; 24: 1068-1079.
3. Cai CB, Zeng YQ, Zhuang YC, et al. Single-shot T2 mapping through overlapping-echo detachment (OLED) planar imaging. IEEE Trans. Biomed. Engineering 2017; 64: 2450-2461.
4. Ma LC, Cai CB, Yang HY, et al. Motion-tolerant diffusion mapping based on single-shot overlapping-echo detachment (OLED) planar imaging. Magn. Reson. Med. 2018; 80: 200-210.
5. Cai CB, Wang C, Zeng Y et al. Single-shot T2 mapping using overlapping-echo detachment planar imaging and a deep convolutional neural network. Magn. Reson. Med. 2018; 80: 2202-2214.
6. Zhang J, Wu J, Chen SJ, et al. Robust single-shot T2 mapping via multiple overlapping-echo acquisition and deep neural network. IEEE Trans. Med. Imaging 2019; 38: 1801-1811.
7. Li W, Wang N, Yu F, et al. A method for estimating and removing streaking artifacts in quantitative susceptibility mapping. Neuroimage 2015; 108: 111-122.
8. Pernet C. Misconceptions in the use of the General Linear Model applied to functional MRI: A tutorial for junior neuro-imagers. Front. Neurosci. 2014; 8.
Figures