4388
Time-efficient, high resolution 3T whole brain relaxometry using 3D-QALAS with wave-CAIPI readouts1Fetal-Neonatal Neuroimaging & Developmental Science Center, Boston Children's Hospital, Boston, MA, United States, 2Department of Radiology, Harvard Medical School, Boston, MA, United States, 3Athinoula A. Martinos Center for Biomedical Imaging, Massachusetts General Hospital, Charlestown, MA, United States, 4State Key Laboratory of Modern Optical Instrumentation, College of Optical Science and Engineering, Zhejiang University, Hangzhou, Zhejiang, China, 5Siemens Medical Solutions USA, Inc., Charlestown, MA, United States, 6Siemens Healthcare GmbH, Erlangen, Germany, 7SyntheticMR AB, Linköping, Sweden, 8Department of Electrical Engineering, Stanford University, Stanford, CA, United States, 9Department of Radiology, Stanford University, Stanford, CA, United States
Synopsis
Volumetric, high resolution, quantitative mapping of brain tissues’ relaxation properties is hindered by long acquisition times and signal-to-noise (SNR) challenges. This study, for the first time, combines the time-efficient wave-CAIPI readouts with the 3D-Quantification using an interleaved Look-Locker acquisition sequence with T2 preparation pulse (3D-QALAS) scheme, enabling full brain quantitative T1, T2 and proton density (PD) maps at 1.15 mm isotropic voxels in only 3 minutes at R=3x2 acceleration. When tested in both the ISMRM/NIST phantom and 7 healthy volunteers, the quantitative maps using the accelerated protocol showed excellent agreement against those obtained from conventional 3D-QALAS at RGRAPPA=2.
Introduction
Recently, there has been significant push towards the development of quantitative MRI (qMRI) techniques1–6 that aim to provide quantitative estimates of tissues’ parameters, such as T1, T2, T2* or proton density (PD). qMRI can help characterize pathologies,7,8 and contribute towards better understanding of, e.g. epilepsy9–11 and multiple sclerosis.12–14 Despite these benefits, routine deployment of qMRI in clinical and research studies is still quite limited, mainly because the current qMRI methods are encoding intensive, suffering from long scan time and/or low spatial resolution. Even some of the most time efficient qMRI methods, such as the 3D-quantification using an interleaved Look-Locker acquisition sequence with T2-preparation pulse (QALAS)6 takes more than 10 minutes to acquire full brain relaxometry at ~1mm3 voxels.This work aims to alleviate the long acquisition times of the 3D-QALAS method. Previous attempts to mitigate this included incorporating compressed sensing acceleration, enabling multi-parametric quantitative whole brain imaging at 1mm3 isotropic voxels in 6 minutes.15 In this work, we combine 3D-QALAS with the time-efficient wave-CAIPI readouts, which have been shown to provide high accelerations (e.g. R≥3x3) in T1-, T2- and T2*-weighted acquisitions16–21 with minimum SNR and g-factor penalties. Our wave-CAIPI 3D-QALAS sequence enables whole brain qMRI in 3 minutes at 1.15mm3 isotropic voxels, generating T1, T2 and PD maps that are in excellent agreement with those estimated from the standard QALAS acquisition (R=2, TA=8.5 minutes) in both phantom and in vivo measurements.
Methods
Acquisition: The 3D-QALAS acquisition includes five turbo-flash readouts separated 900ms apart, with a 100ms long T2-preparation module preceding the first readout, and the remaining four readouts following an inversion pulse that captures T1 dynamics. On the other hand, wave-CAIPI readouts play sinusoidal gradients along two spatial axes, thereby effectively spreading the aliasing evenly in all spatial directions, and thus taking full advantage of 3D coil sensitivity distribution.19,20 Our combined wave-CAIPI 3D-QALAS sequence (see Figure 1) has the following imaging parameters: FOV=240x240x176mm3, matrix size=208x208x160, BW=330 Hz/pixel, echo-spacing=5.9ms, turbo factor=125, TR=4.5s, TE=2.36ms, 10 wave cycles and RYZ=3x2 acceleration, yielding a scan time of 3:03 minutes. This accelerated protocol was compared against a standard (Cartesian) 3D-QALAS acquisition with equivalent imaging parameters, but with conventional acceleration of RGRAPPA=2, resulting in an 8.5 minutes scan.Reconstruction and post-processing: The wave-CAIPI reconstruction used no regularization and was performed online with DICOM images being available on the scanner after the scan was done. These DICOM images were then fed to the SyntheticMR software (Linkoping, Sweden), which calculated the quantitative T1, T2 and PD maps.
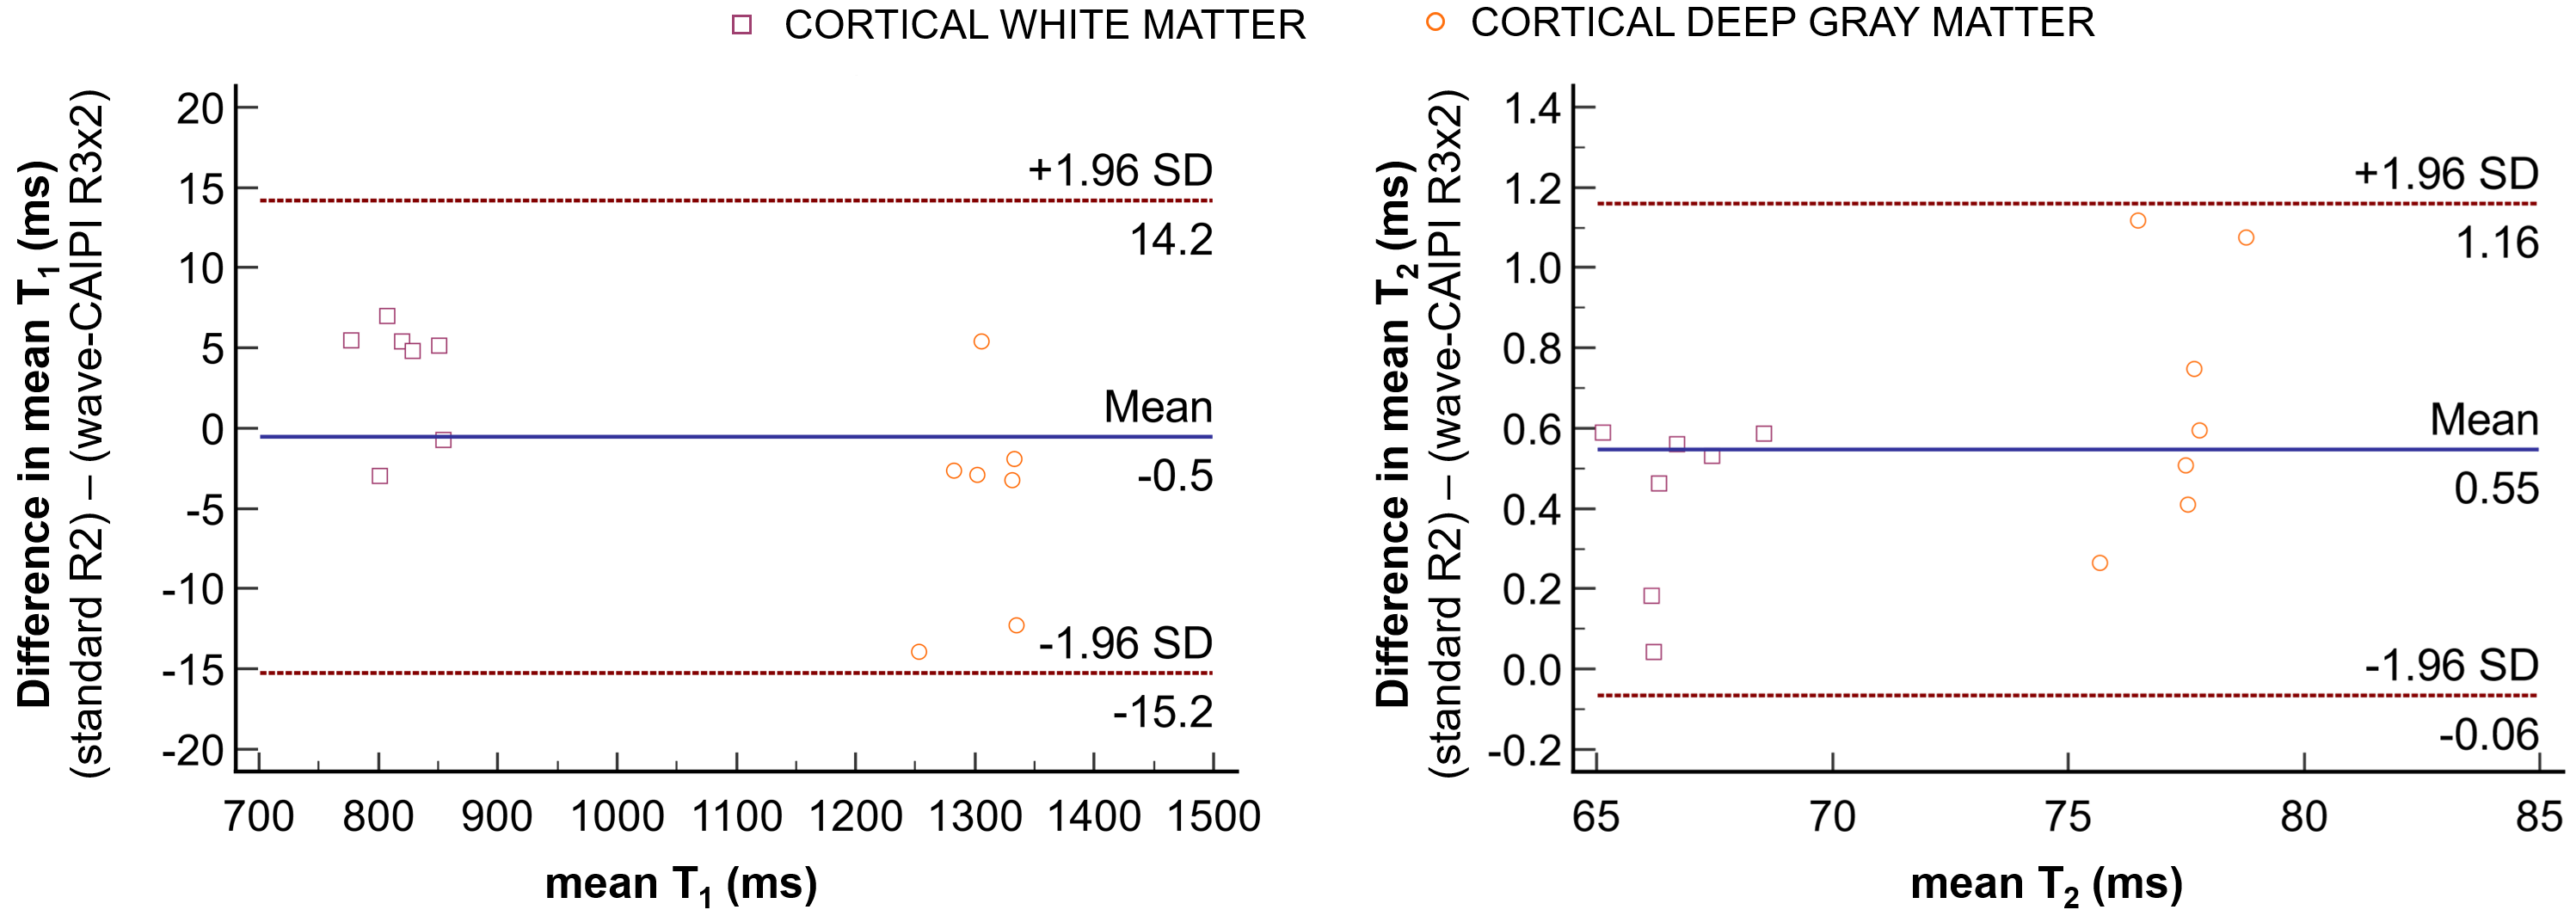
Phantom and invivo scans: All MRI experiments were performed on a 3T MAGNETOM Prisma scanner (Siemens Healthcare, Erlangen, Germany) using a 32ch head receive array. Both acquisitions were run on the ISMRM/NIST phantom, and the two sets of quantitative maps were compared using a linear correlation fit. Similarly, the T1 and T2 maps agreement between the two acquisitions was also evaluated in vivo on 7 adult volunteers, by directly comparing the estimated values and performing a Bland-Altman analysis on cortical deep gray and white matter regions. These regions were segmented in FreeSurfer22 using the synthetically generated T1w volume generated in the SyntheticMR software.
Results
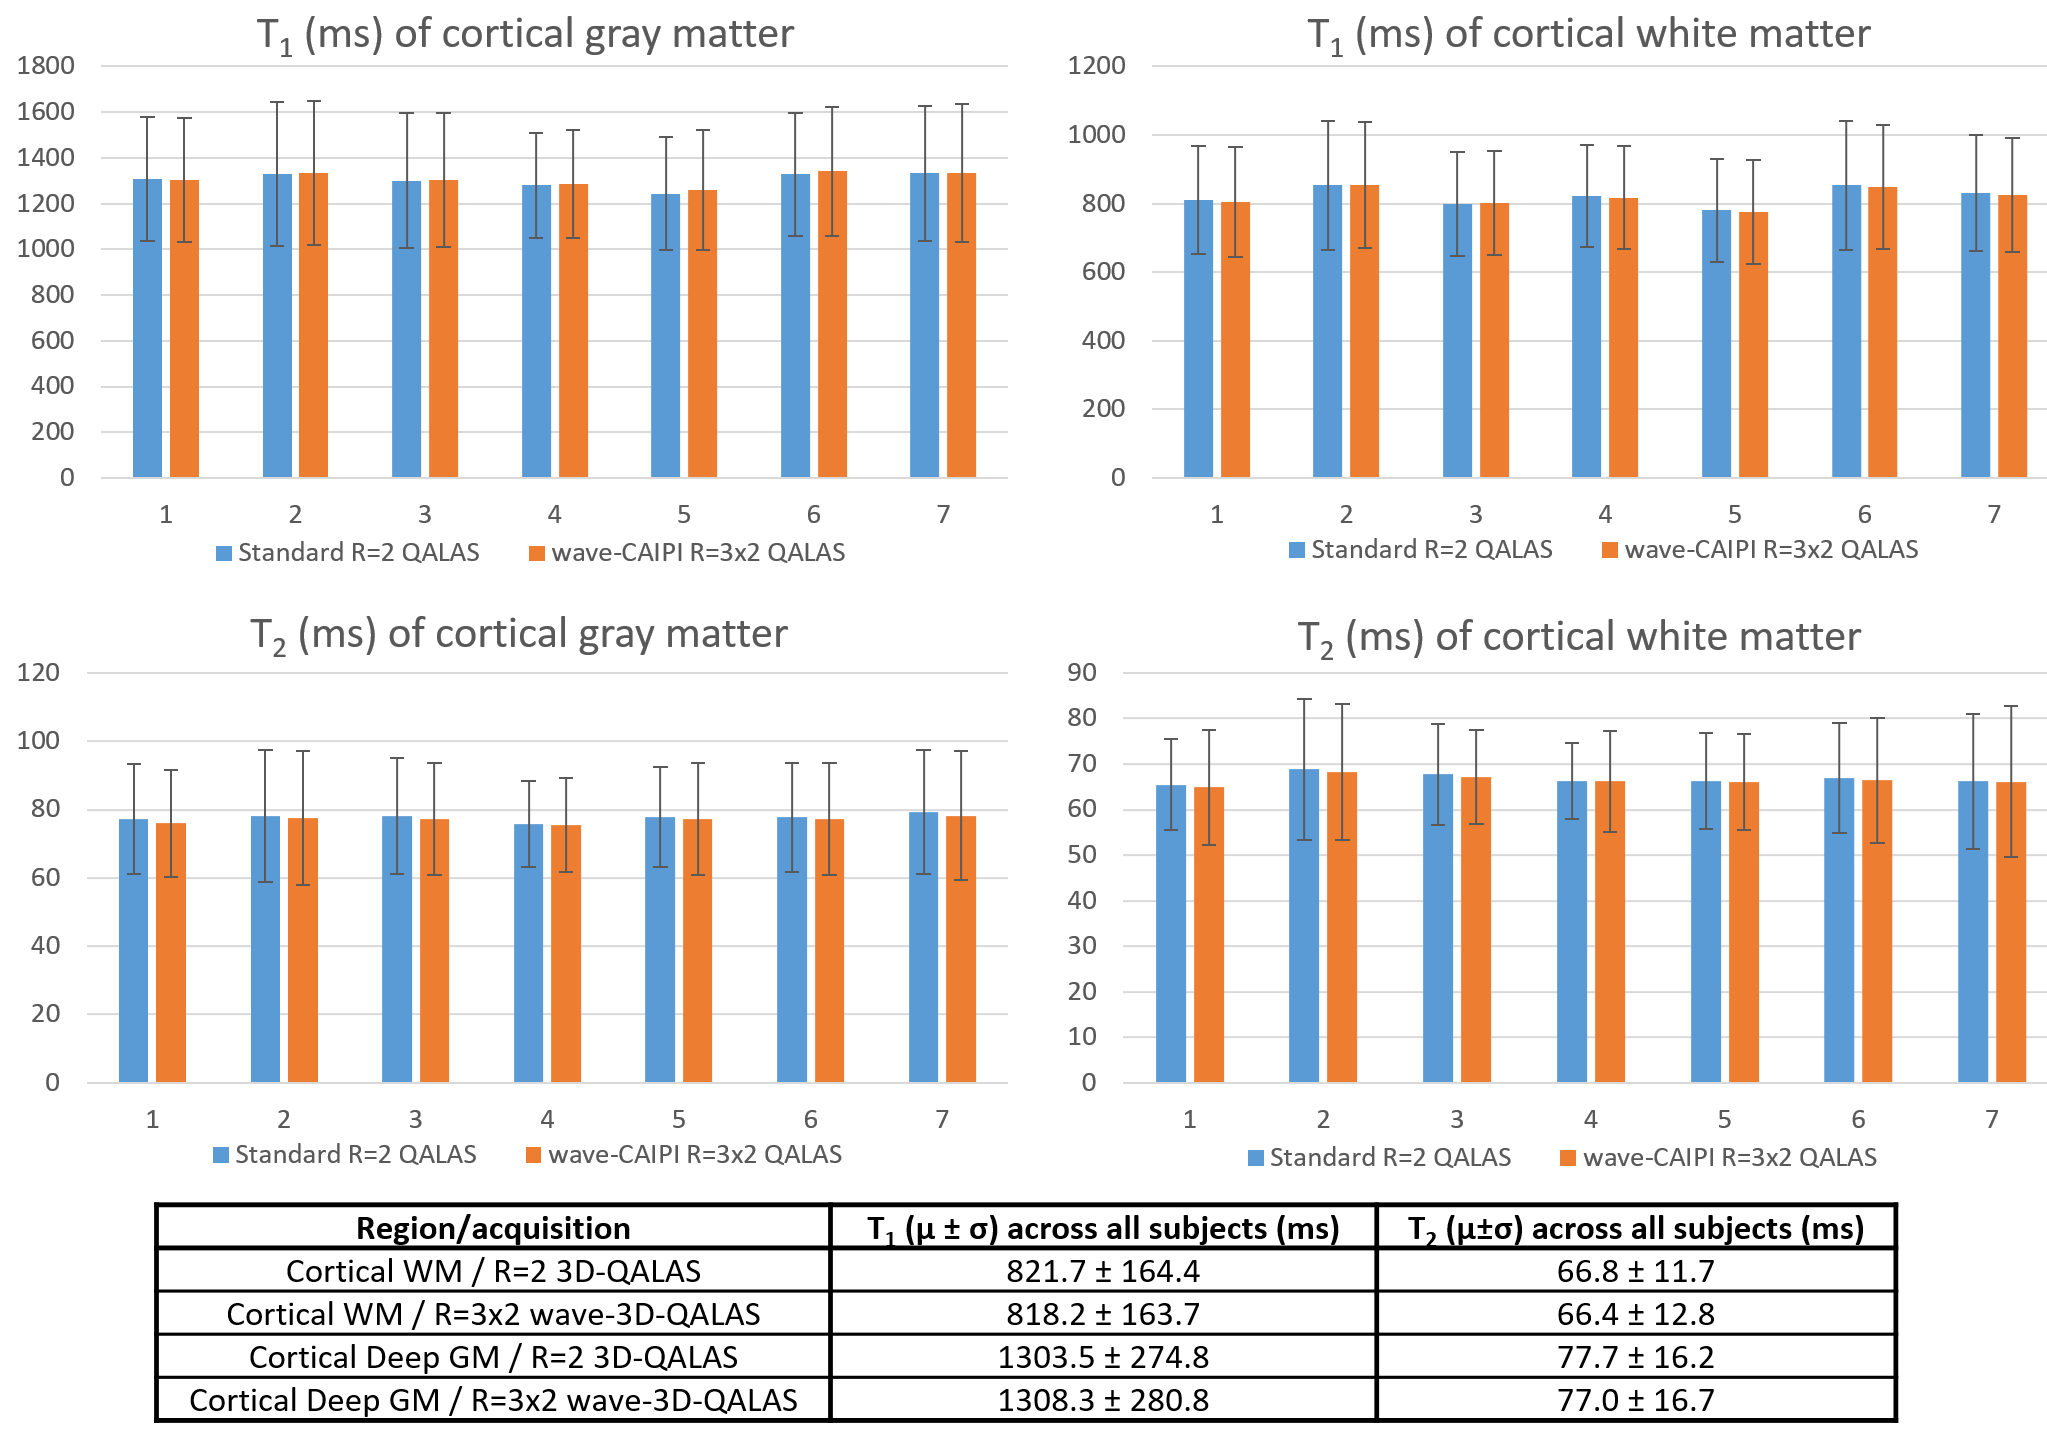
Figure 2 shows correlation plots comparing the fitting accuracy among the ISMRM/NIST phantom’s reference values, and the T1/T2 estimates from the conventional (R=2) and wave-CAIPI (R=3x2) 3D-QALAS acquisitions. Vials with T1 and T2 values within the brain’s physiological range were included in the fit, i.e. between 0.3s-2s and 20ms-400ms for T1 and T2, respectively. Conventional and wave-CAIPI 3D-QALAS show excellent agreement (R2>0.999 for both T1 and T2), with both showing strong linear fit against the reference values (R2>0.975 for T1 and R2>0.990 for T2). Figure 3 shows T1, T2 and PD maps from both the conventional and wave-CAIPI 3D-QALAS acquisition from a representative subject, demonstrating how similar the two sets of maps are qualitatively. Furthermore, Figure 4 shows Bland-Altman analysis of the estimated T1 and T2 values calculated from the two acquisitions in the cortical, white and deep gray matter from all 7 subjects. As seen, the mean difference T1 and T2 values of the two acquisitions is within the 95% confidence interval, demonstrating quantitatively that the two acquisitions yield very similar T1 and T2 estimates. Figure 5 shows plot charts of the mean and standard deviations of the T1 and T2 values in these two brain regions in all 7 subjects for both acquisitions, and the table at the bottom summarizes the mean and standard deviations of the estimated T1 and T2 values across all 7 subjects, which are in line with previously reported literature values.Discussion and Conclusion
3D-QALAS enhanced with wave-CAIPI readouts enables time-efficient, full brain quantitative T1, T2 and PD mapping at 1.15mm3 voxels in 3 minutes at R=3x2 acceleration. When tested on the ISMRM/NIST phantom and 7 adult volunteers, the quantitative maps obtained from the accelerated wave-CAIPI 3D-QALAS showed very similar values to those obtained from the standard (R=2) 3D-QALAS, alluding to the accuracy and robustness of the proposed methods. Enabling parametric mapping in less than 5 minutes at 1mm voxels or lower is possible by incorporating advanced reconstruction techniques,23,24 which are part of our future work.Acknowledgements
This work was supported by research grants NIH R01 EB028797, R03 EB031175, U01 EB025162, P41 EB030006, U01 EB026996, R01 EB017337, U01 HD087211, R01 HD100009 and the NVidia Corporation for computing support.References
1. Ehses P, Seiberlich N, Ma D, Breuer FA, Jakob PM, Griswold MA, et al. IR TrueFISP with a golden-ratio-based radial readout: fast quantification of T1, T2, and proton density. Magn Reson Med 2013;69:71–81.
2. Deoni SCL, Peters TM, Rutt BK. High-resolutionT1 andT2 mapping of the brain in a clinically acceptable time with DESPOT1 and DESPOT2. Magnetic Resonance in Medicine 2005:237–41. https://doi.org/10.1002/mrm.20314.
3. Fleysher R, Fleysher L, Gonen O. The optimal MR
acquisition strategy for exponential decay constants estimation. Magn Reson Imaging 2008;26:433–5.
4. Ma D, Gulani V, Seiberlich N, Liu K, Sunshine JL,
Duerk JL, et al. Magnetic resonance fingerprinting. Nature 2013;495:187–92.
5. Liao C, Bilgic B, Manhard MK, Zhao B, Cao X, Zhong J,
et
al. 3D MR fingerprinting
with accelerated stack-of-spirals and hybrid sliding-window and GRAPPA
reconstruction. Neuroimage 2017;162:13–22.
6. Kvernby S, Warntjes MJB, Haraldsson H, Carlhäll C-J,
Engvall J, Ebbers T. Simultaneous three-dimensional myocardial T1 and T2
mapping in one breath hold with 3D-QALAS. J Cardiovasc Magn
Reson 2014;16:102.
7. MacKay AL, Vavasour IM, Rauscher A, Kolind SH, Mädler
B, Moore GRW, et al. MR Relaxation in Multiple Sclerosis. Neuroimaging
Clinics of North America 2009:1–26. https://doi.org/10.1016/j.nic.2008.09.007.
8. Liao C, Wang K, Cao X, Li Y, Wu D, Ye H, et al. Detection of Lesions in Mesial Temporal Lobe
Epilepsy by Using MR Fingerprinting. Radiology 2018;288:804–12.
9. Lutti A, Dick F, Sereno MI, Weiskopf N. Using
high-resolution quantitative mapping of R1 as an index of cortical myelination.
Neuroimage 2014;93 Pt 2:176–88.
10. Waehnert MD, Dinse J, Schäfer A, Geyer S, Bazin P-L,
Turner R, et al. A subject-specific framework for in vivo
myeloarchitectonic analysis using high resolution quantitative MRI. Neuroimage 2016;125:94–107.
11. Ma D, Jones SE, Deshmane A, Sakaie K, Pierre EY,
Larvie M, et al. Development of high-resolution 3D MR fingerprinting
for detection and characterization of epileptic lesions. J Magn Reson
Imaging 2019;49:1333–46.
12. Stevenson VL, Parker GJ, Barker GJ, Birnie K, Tofts
PS, Miller DH, et al. Variations in T1 and T2 relaxation times of normal
appearing white matter and lesions in multiple sclerosis. J Neurol Sci 2000;178:81–7.
13. Parry A, Clare S, Jenkinson M, Smith S, Palace J,
Matthews PM. White matter and lesion T1 relaxation times increase in parallel
and correlate with disability in multiple sclerosis. J Neurol 2002;249:1279–86.
14. Reitz SC, Hof S-M, Fleischer V, Brodski A, Gröger A,
Gracien R-M, et al. Multi-parametric quantitative MRI of normal
appearing white matter in multiple sclerosis, and the effect of disease
activity on T2. Brain Imaging Behav 2017;11:744–53.
15. Fujita S, Hagiwara A, Takei N, Hwang K-P, Fukunaga I,
Kato S, et al. Accelerated Isotropic Multiparametric Imaging by
High Spatial Resolution 3D-QALAS With Compressed Sensing: A Phantom, Volunteer,
and Patient Study. Invest Radiol 2021;56:292–300.
16. Polak D, Cauley S, Huang SY, Longo MG, Conklin J,
Bilgic B, et al. Highly-accelerated volumetric brain examination
using optimized wave-CAIPI encoding. J Magn Reson Imaging 2019;50:961–74.
17. Bilgic B, Xie L, Dibb R, Langkammer C, Mutluay A, Ye
H, et al. Rapid multi-orientation quantitative susceptibility
mapping. Neuroimage 2016;125:1131–41.
18. Gagoski BA, Bilgic B, Eichner C, Bhat H, Grant PE,
Wald LL, et al. RARE/turbo spin echo imaging with Simultaneous Multislice
Wave-CAIPI. Magn Reson Med 2015;73:929–38.
19. Bilgic B, Gagoski BA, Cauley SF, Fan AP, Polimeni JR,
Ellen Grant P, et al. Wave-CAIPI for highly accelerated 3D imaging. Magnetic Resonance
in Medicine 2015:2152–62.
https://doi.org/10.1002/mrm.25347.
20. Cauley SF, Setsompop K, Bilgic B, Bhat H, Gagoski B,
Wald LL. Autocalibrated wave-CAIPI reconstruction; Joint optimization of
k-space trajectory and parallel imaging reconstruction. Magn Reson Med 2017;78:1093–9.
21. Polak D, Setsompop K, Cauley SF, Gagoski BA, Bhat H,
Maier F, et al. Wave-CAIPI for highly accelerated MP-RAGE imaging. Magn Reson Med 2018;79:401–6.
22. Fischl B. FreeSurfer. Neuroimage 2012;62:774–81.
23. Bilgic B, Kim TH, Liao C, Manhard MK, Wald LL, Haldar
JP, et al. Improving parallel imaging by jointly reconstructing
multi-contrast data. Magn Reson Med 2018;80:619–32.
24. Aggarwal HK, Mani
MP, Jacob M. MULTI-SHOT SENSITIVITY-ENCODED DIFFUSION MRI USING MODEL-BASED
DEEP LEARNING (MODL-MUSSELS). Proc IEEE Int Symp
Biomed Imaging 2019;2019:1541–4.
Figures
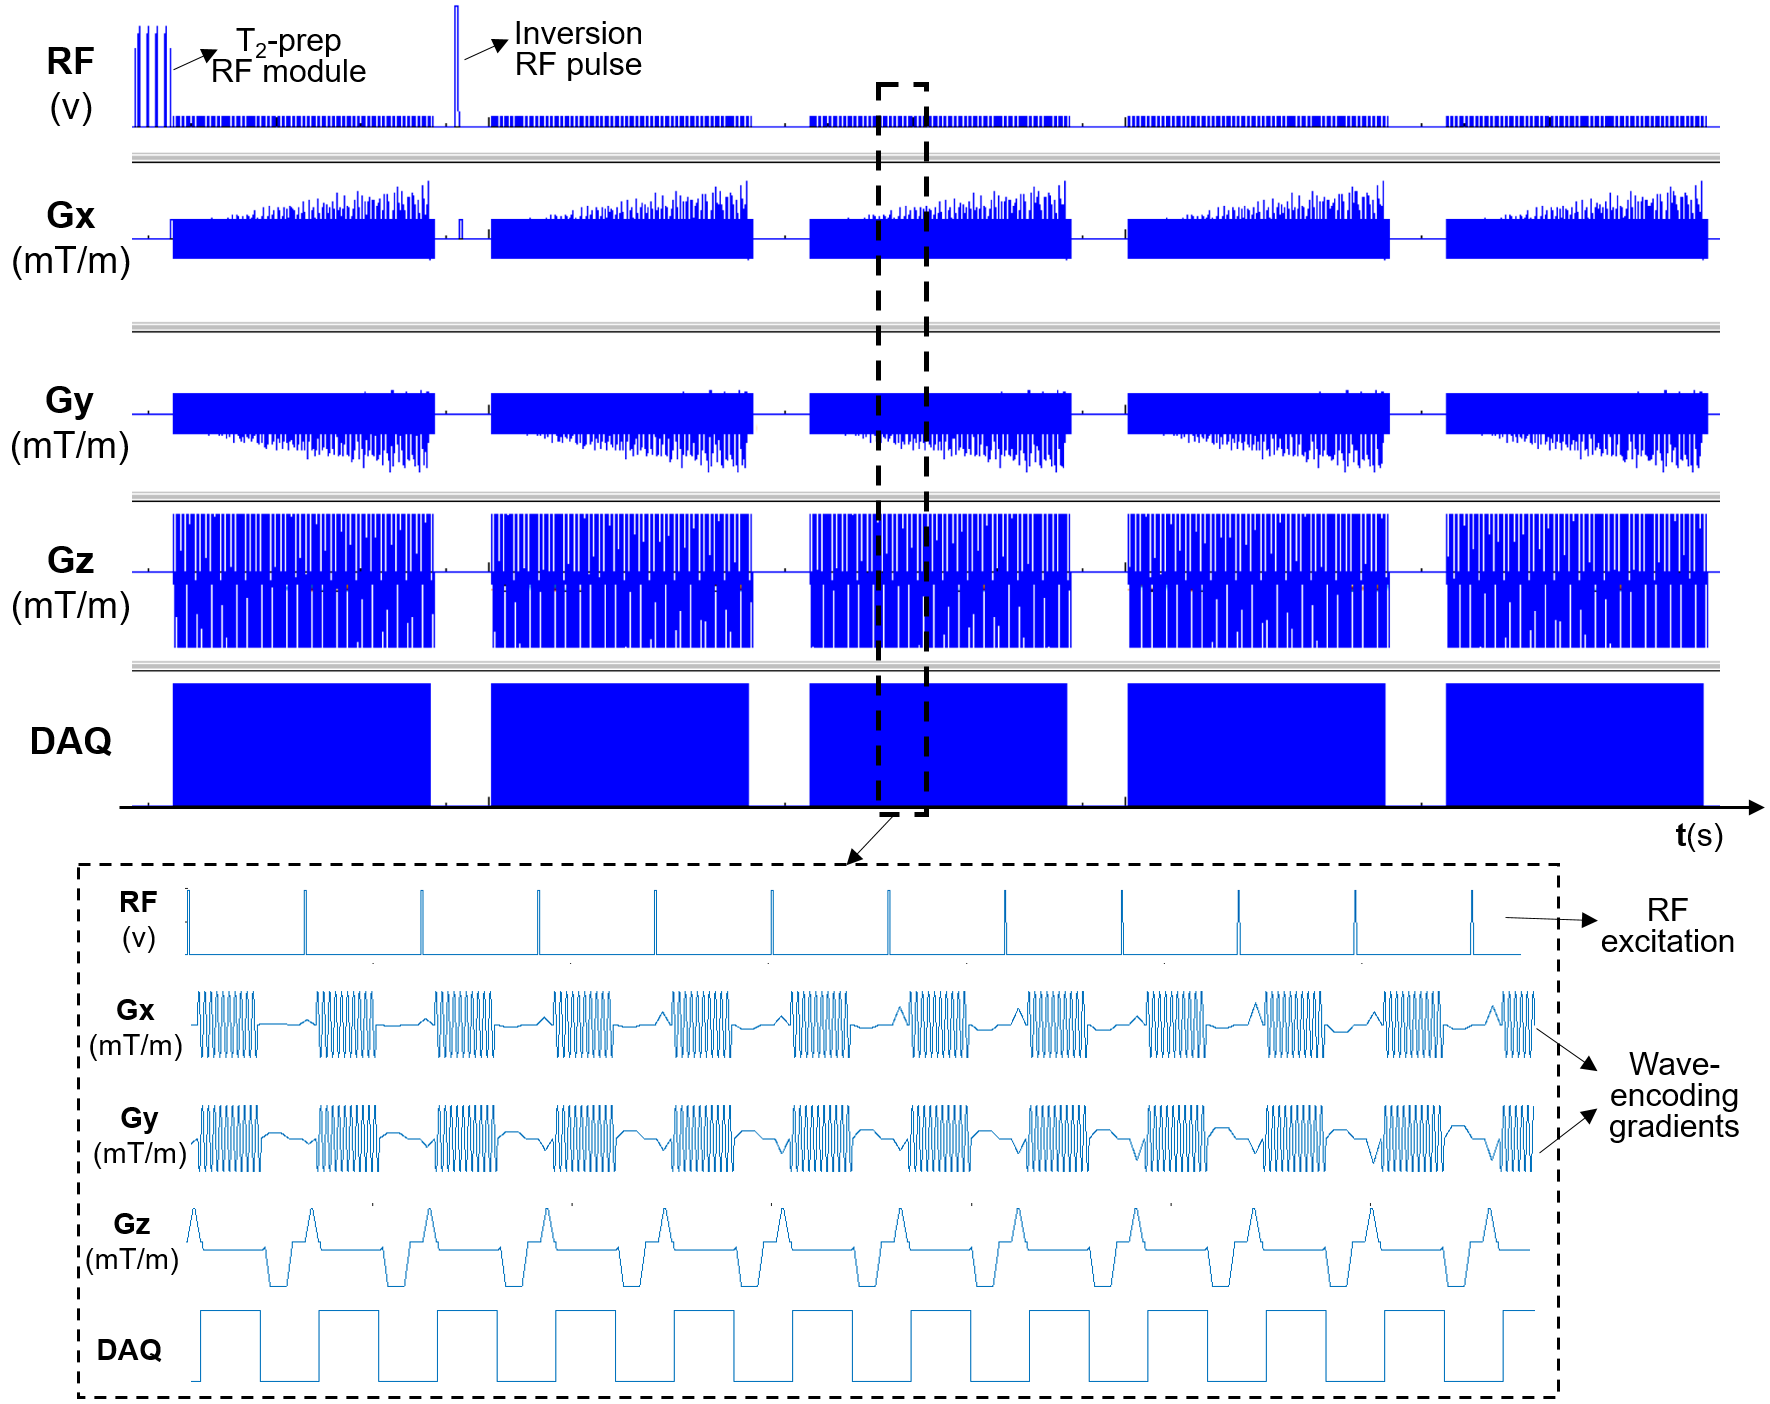
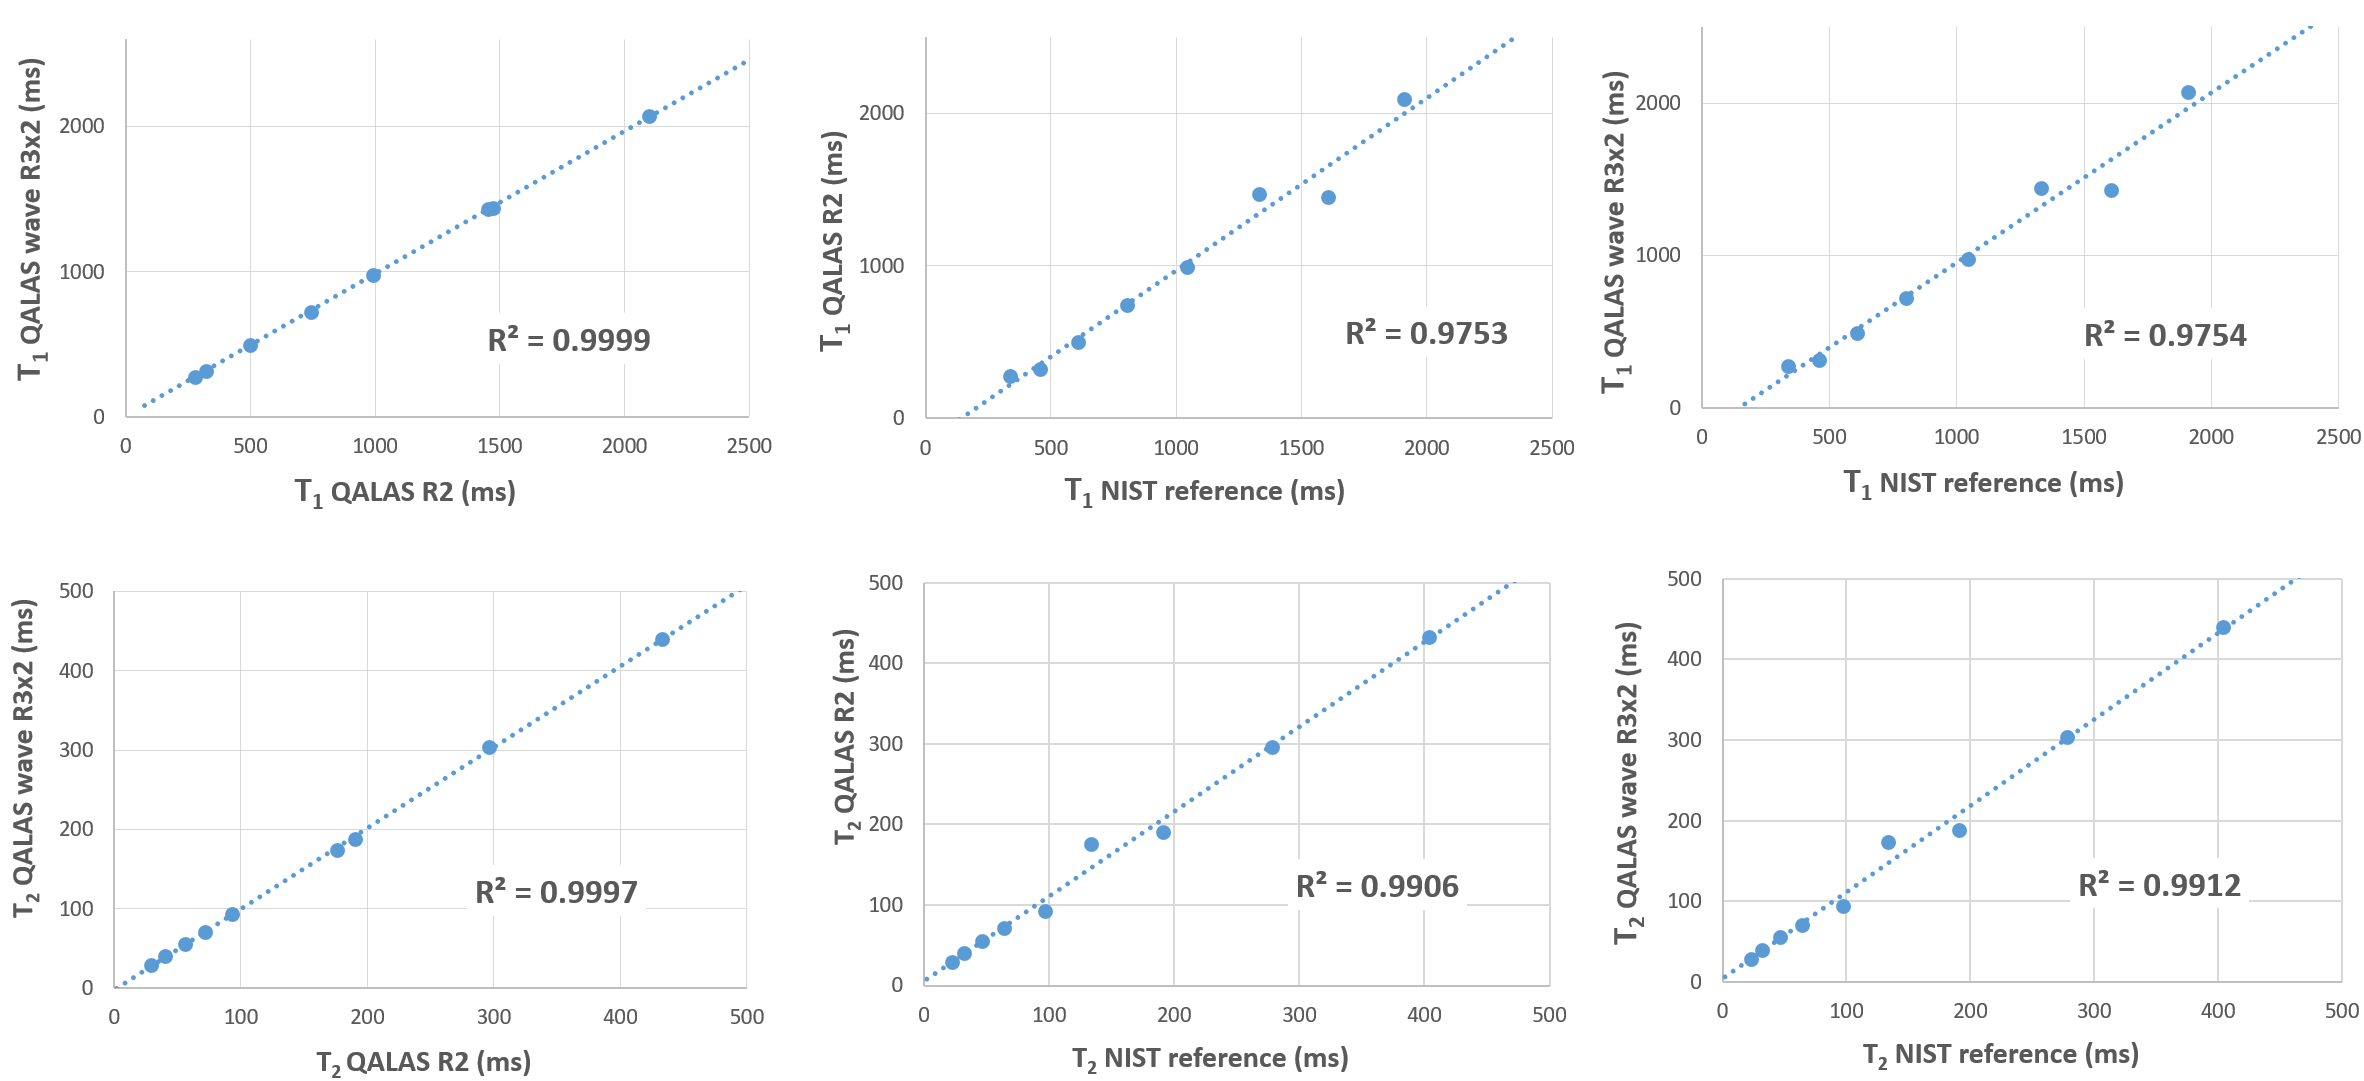
Figure 2: Correlation plots comparing T1 (top row) and T2 (bottom row) values from the NIST phantom between the two QALAS acquisitions (left column), and between the reference values and the R=2 (middle row) and the wave-CAIPI R=3x2 QALAS acquisition (right row). All plots show strong linear fit, with R2≥0.99 for T2 and R2≥0.975 for T1. Note the particularly excellent agreement between the T1 and T2 values from the standard and the wave-CAIPI acceleration 3D-QALAS acquisitions.
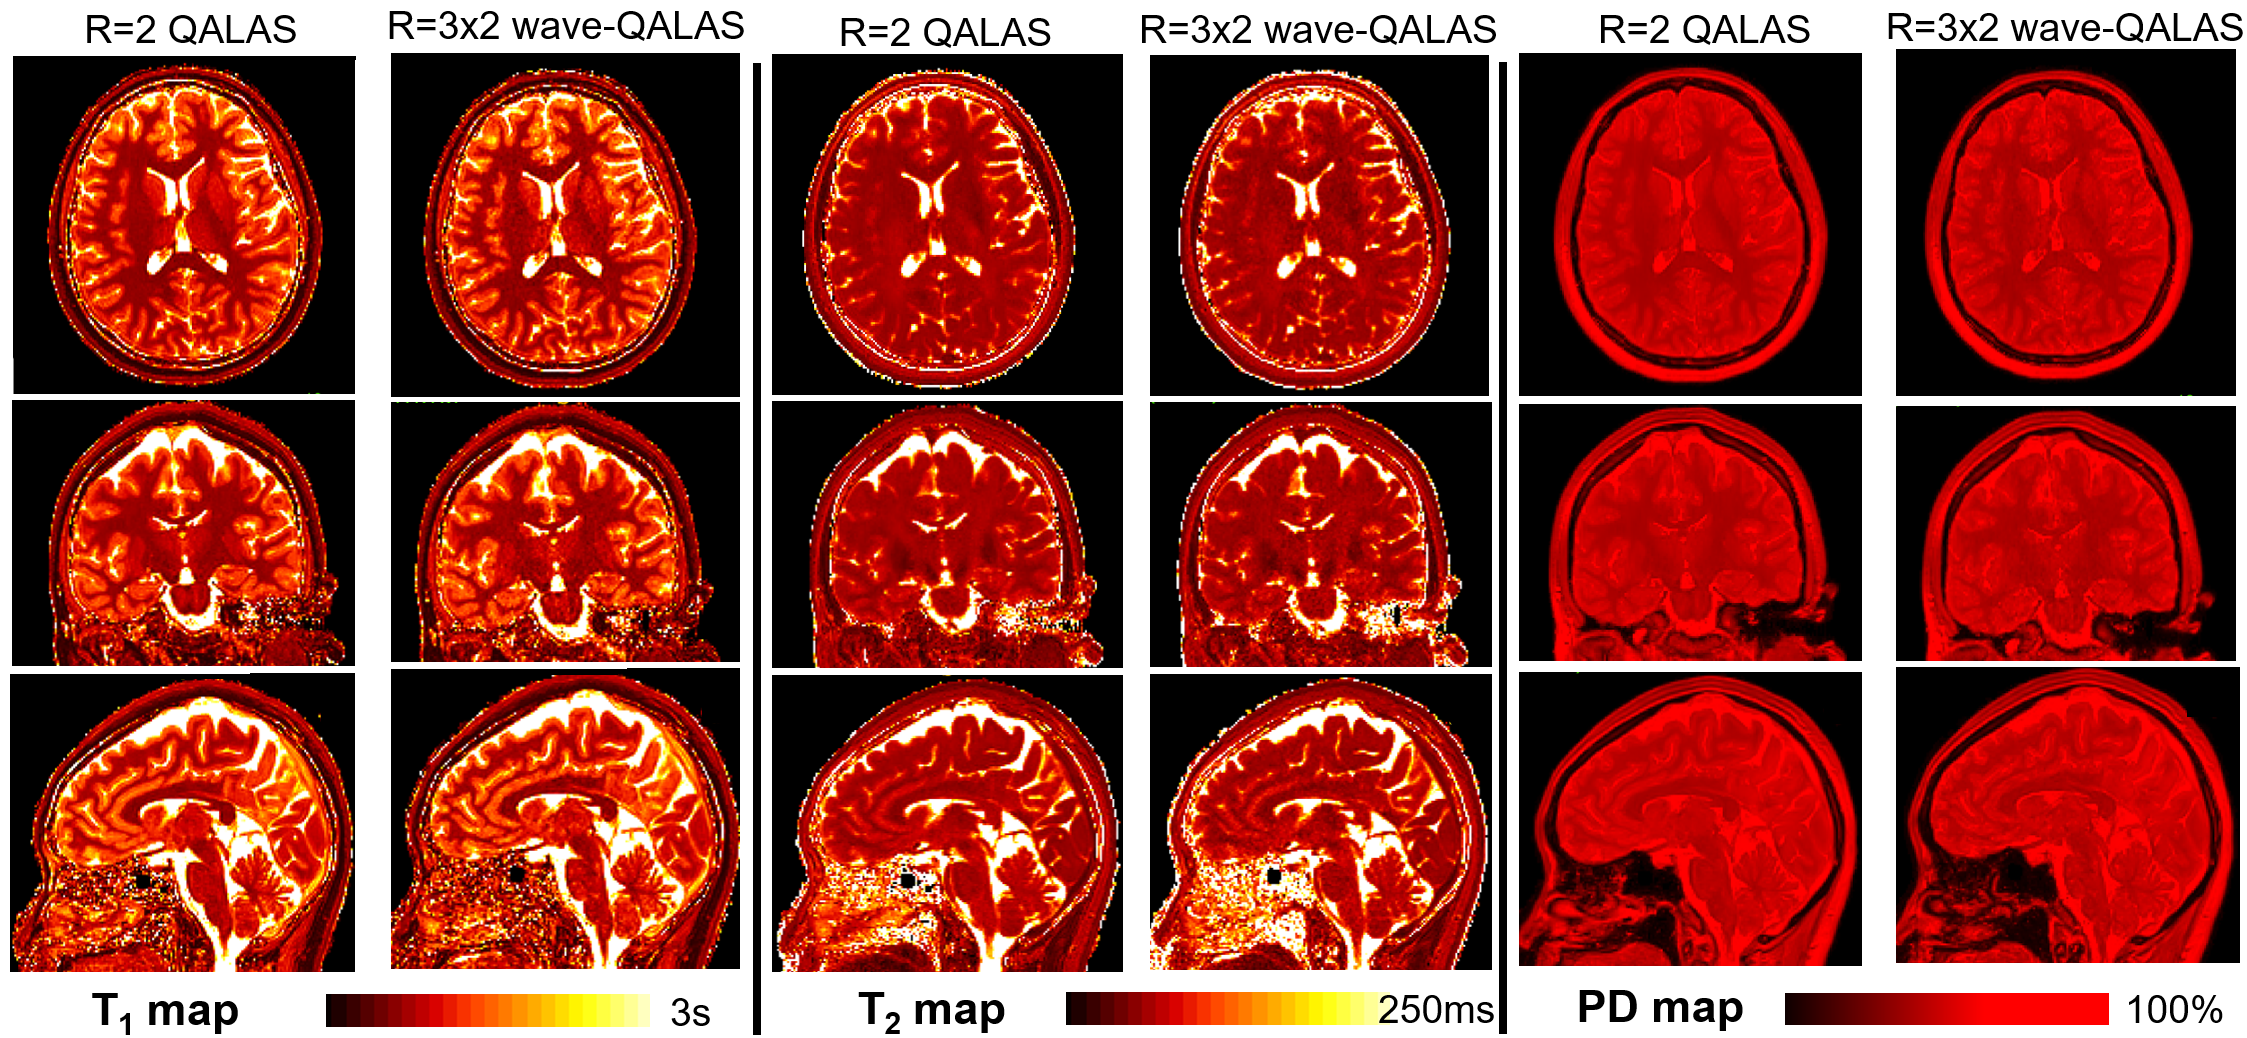
Figure 3: Quantitative T1, T2 and PD maps from a representative adult volunteer estimated from the standard Cartesian R=2, and the accelerated R=3x2 wave-CAIPI 3D-QALAS acquisition, demonstrating qualitatively how similar are the obtained maps, despite the R=3x2 wave-CAIPI scan being almost three times faster.