4387
Generation of DSC-MRI derived relative CBV maps from IVIM-MRI data1Department of Electronic Science, Xiamen University, Xiamen, Fujian, China, 2Department of Radiology, First Affiliated Hospital of Fujian Medical University, Fuzhou, Fujian, China, 3MSC Clinical & Technical Solutions, Philips Healthcare, Shenzhen, China
Synopsis
Dynamic susceptibility contrast magnetic resonance imaging (DSC-MRI) derived relative cerebral blood volume (rCBV) is a valuable diagnosis biomarker. However, the injection of gadolinium-based contrast agent (GBCA) in DSC-MRI acquisition is prone to cause adverse effects. In this study, a rCBV generation method was proposed based on deep neural network and intravoxel incoherent motion magnetic resonance imaging (IVIM-MRI) data. Consistency analysis shows that the rCBV maps generated from our proposed method are of high consistency with the realistic ones, implying that the proposed method has the potential to obtain DSC-MRI derived rCBV maps without GBCA injection.
Introduction
Dynamic susceptibility contrast magnetic resonance imaging (DSC-MRI) involves injection of gadolinium-based contrast agent (GBCA) to dynamically alter the T2 or T2* transverse relaxation rate of tissues for quantitative perfusion information acquisition. DSC-MRI derived relative cerebral blood volume (rCBV) has been demonstrated to provide information about tumor malignancy and has been applied to brain tumor treatment monitoring. Intravoxel incoherent motion magnetic resonance imaging (IVIM-MRI) is a non-invasive perfusion imaging technique from which the perfusion fraction f could be obtained by fitting a biexponential model with multi b value diffusion weighted imaging (DWI) data. Theoretically, CBV could be represented as the product of IVIM-MRI derived f and tissue NMR-visible water content fraction.1 It is well-established that deep neural network owns incomparable nonlinear fitting ability and has been successfully applied to solve complicated mapping relations of quantitative MRI.2,3 Here we introduced deep neural network to obtain DSC-MRI derived rCBV maps from IVIM-MRI data without GBCA injection for the first time.Methods
MR imaging: From September 2016 to December 2018, 64 patients with pathologically confirmed glioblastoma had undergone multimodality MR examinations including DSC- and IVIM-MRI. Both DSC- and IVIM-MRI data were acquired on 3T SIEMENS Skyra scanners with a 16-channel head-neck coil. Detailed imaging acquisition protocol is as follows: (1) IVIM-MRI: Single-shot spin-echo EPI sequence, 100 × 100 mm2 field of view, 5 mm slice sickness, 6 mm spacing between slices, TE/TR = 68/4100 ms, echo train length = 54 ms; voxel size is 0.7 × 0.7 × 5.0 mm3, b values are 0, 50, 100, 150, 200, 300, 400, 600, 700, 800, 1000, 1400, 2000 s/mm2 and was repeated 2, 2, 2, 2, 2, 2, 2, 2, 2, 3, 3, 4, 6 times; (2) DSC-MRI: Single-shot gradient-echo EPI sequence, 100 × 100 mm2 field of view, 5 mm slice sickness, 6 mm spacing between slices, TE/TR = 30/1600 ms, echo train length = 63 ms; voxel size is 1.7 × 1.7 × 5.0 mm3. This retrospective study was approved by the institutional review board, and informed consent was obtained.Proposed scheme: Figure 1 shows the framework of proposed rCBV generation method. Multi b value DWI images after normalization were employed as the neural network input, together with rCBV maps obtained from 3T SIEMENS Skyra scanner as the training labels. rCBV maps were registered to S0 (b = 0) images of each patient automatically with MATLAB toolbox SPM12. A 5-level U-Net with perception loss was introduced to fulfill the nonlinear mapping. Patient data were randomly divided into training, validation and testing sets, 1000 2D slices were available for training and 100 for validation in final.
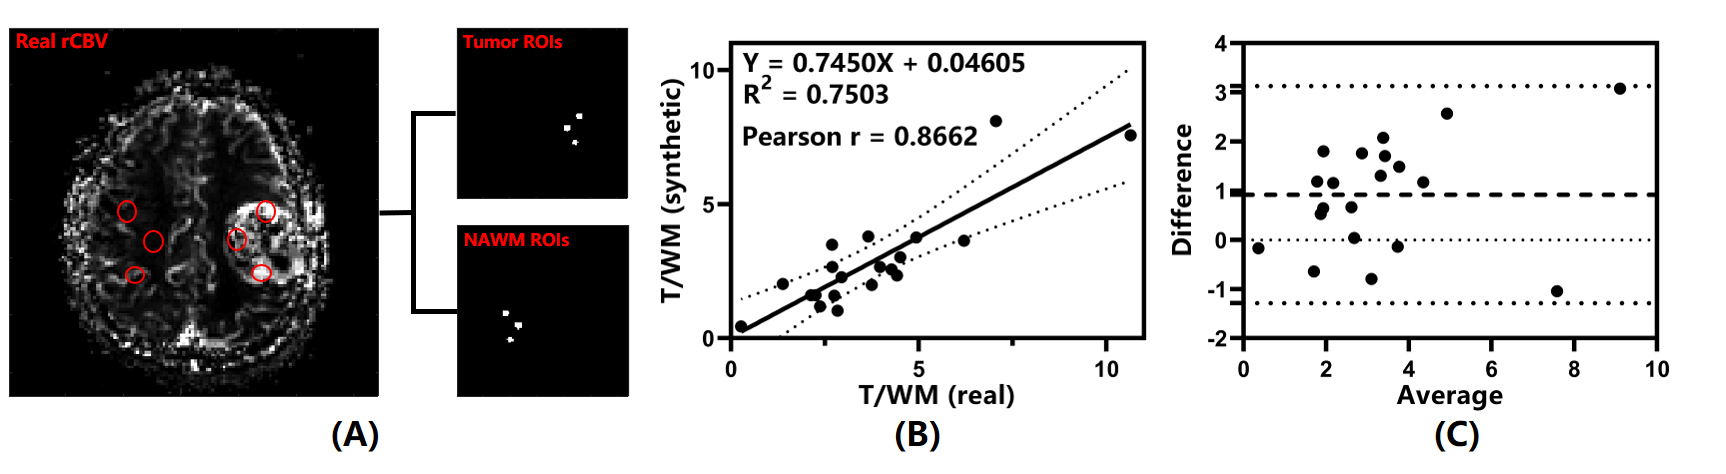
Performance evaluation: To quantitatively analysis the agreement between synthetic and real rCBV maps, 3 tumor and 3 contralateral normal-appearing white matter (NAWM) ROIs were manually drawn in the real rCBV maps of 20 patients respectively and copied to the corresponding synthetic ones. Mean values of 3 ROIs were averaged for tumor and WM to compute the tumor rCBV and the tumor to white matter (T/WM) ratio. Linear regression, Pearson correlation and Bland-Altman analysis were done for tumor rCBV and T/WM ratios of real and synthetic rCBV maps.
Results
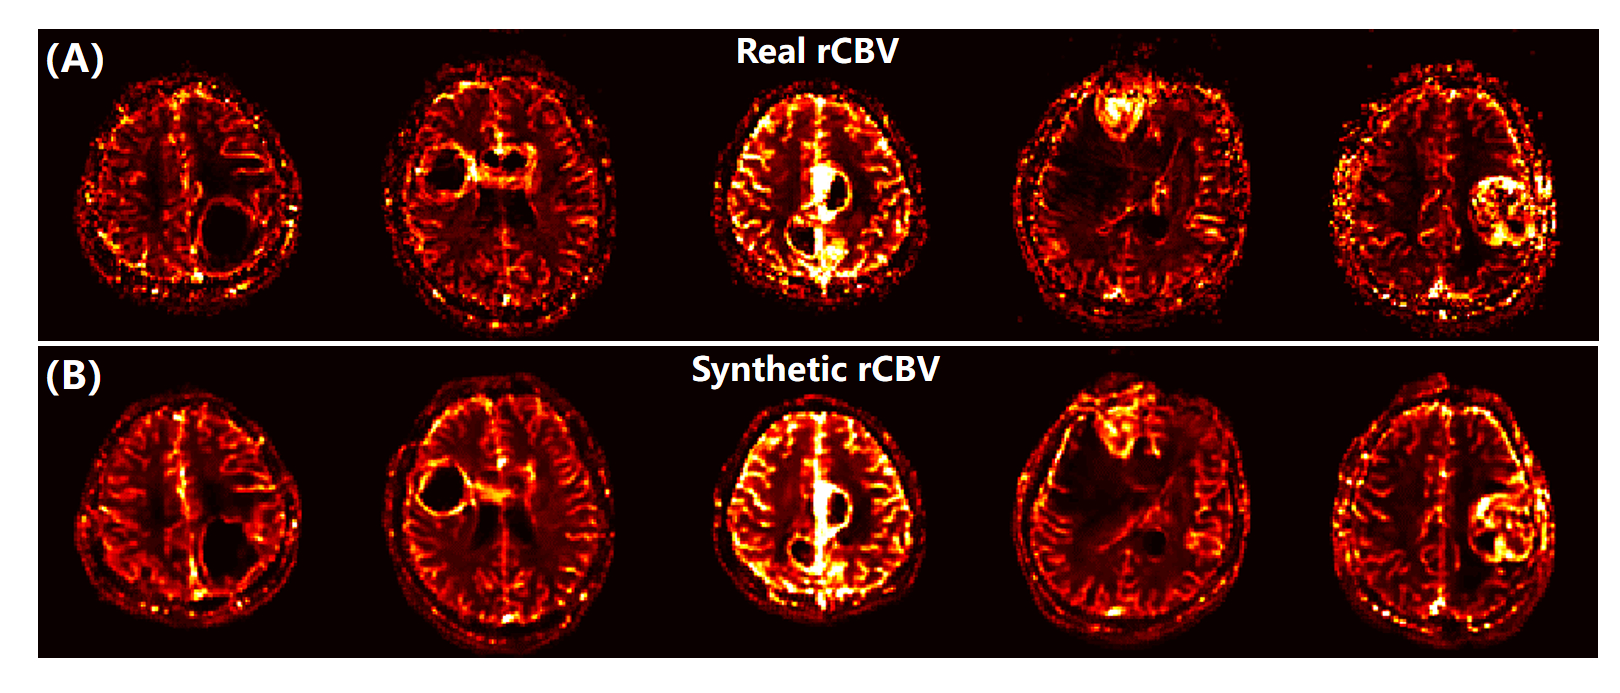
Figure 2 shows the real and synthetic rCBV maps of 5 patients diagnosed with pathologically confirmed glioblastoma. The synthetic and real maps are nearly indistinguishable with obvious elevation of tumor rCBV compared to the surrounding parenchyma. Moreover, background noise is significantly reduced on synthetic maps.Figure 3 illustrates the results of analysis between real and synthetic tumor rCBV. As shown in Fig. 3A, there is a linear relationship between them and could be represented as (rCBVT)synthetic = 0.7999 × (rCBVT)real + 41.38 (R2 = 0.7165). The Pearson correlation coefficient is 0.8465 (P < 0.0001). Bland-Altman analysis in Fig. 3B shows all the data distribute within the 95% limits of agreement (LoA) with a mean difference of 410.2 (a.u.).
Figure 4 illustrates the results of analysis between real and synthetic T/WM ratios. As Fig. 4B shows, there is a linear relationship between them and could be represented as (rCBVT/WM)synthetic = 0.7450 × (rCBVT/WM)real + 0.04605 (R2 = 0.7503). The Pearson correlation coefficient is 0.8662 (P < 0.0001). Bland-Altman analysis in Fig. 4C shows all the data distribute within the 95% LoA with a mean difference of 0.92. That is, both the tumor rCBV and T/WM ratio Bland-Altman analyses show clinically acceptable difference between real and synthetic rCBV maps.
Discussion and conclusion
This study proposes a method for generation of DSC-MRI derived rCBV maps from IVIM-MRI data based on deep neural network. We take the potential relationship between IVIM-MRI derived f and DSC-MRI derived rCBV from the perspective of physical significance into consideration and correlate IVIM-MRI with DSC-MRI derived rCBV. Experimental results demonstrate the feasibility of synthesizing rCBV maps from IVIM-MRI. Especially, for IVIM-MRI, when high b values (b = 1000-2000 s/mm2) are available, model could be extended to the hybrid IVIM–DKI (diffusion kurtosis imaging) model which could more accurately capture the complexity of tumor microstructure compared to the conventional biexponential or DKI model alone.4,5 In summary, it is feasible to simultaneously acquire DSC-MRI derived rCBV without injection of GBCA and IVIM-MRI derived Gaussian and non-Gaussian diffusion parameters.Acknowledgements
This work was supported by the National Natural Science Foundation of China under grant numbers 11775184 and 82071913, and Science and Technology Project of Fujian Province 2019Y0001.References
1. Lebihan D, Turner R. The capillary network: A link between IVIM and classical perfusion. Magn. Reson. Med. 1992; 27: 171-178.
2. Cai CB, Wang C, Zeng Y, et al. Single-shot T2 mapping using overlapping-echo detachment planar imaging and a deep convolutional neural network. Magn. Reson. Med. 2018; 80: 2202-2214.
3. Zhang J, Wu J, Chen SJ, et al. Robust single-shot T2 mapping via multiple overlapping-echo acquisition and deep neural network. IEEE Trans. Med. Imaging. 2019; 38: 1801-1811.
4. Lu YG, Jansen JFA, Mazaheri Y, et al. Extension of the intravoxel incoherent motion model to non-gaussian diffusion in head and neck cancer. J. Magn. Reson. Imaging. 2012; 36: 1088-1096.
5. Ianuş A, Santiago I, Galzerano A, et al. Higher-order diffusion MRI characterization of mesorectal lymph nodes in rectal cancer. Magn. Reson. Med. 2019; 84: 348-364.
Figures