4383
R2* changes reflect the kinetics of formalin-based penetration and fixation in post-mortem tissue1High Field Magnetic Resonance, Max Planck Institute for Biological Cybernetics, Tuebingen, Germany, 2Wellcome Centre for Human Neuroimaging, London, United Kingdom, 3High Field Magnetic Resonance,, Max Planck Institute for Biological Cybernetics, Tuebingen, Germany, 4Biomedical Magnetic Resonance, University Hospital Tuebingen, Tuebingen, Germany, 5Clinical Anatomy, University Hospital Tübingen, Tuebingen, Germany
Synopsis
Post-mortem brain MRI can yield valuable information. However, tissue preservation requires substitution of the CSF-fluid by fixation agents, which is time-consuming for large samples. R2* maps, dominated by R2-effects, were measured at several timepoints during fixation of pig-brain tissue samples using formalin-based fixatives.
Introduction
Magnetic resonance imaging of post-mortem brain samples can reveal valuable information about different brain properties and clinical disease [1-3]. Tissue preservation during prolonged scanning not performed in situ may require substitution of the CSF-fluid by fixation agents. Tissue penetration and cross-linking may be time-consuming, especially for large samples. The rate of fixative diffusion has been previously determined to be 0.55-0.78 [4-5]. A more direct MRI-based measure of this factor is desirable.Previously, the change in T2 during immersion fixation has been modelled as contributions from fixed, unfixed and decomposed tissue in varying fractions [2], hence this MR-parameter may putatively serve as a proxy for the fixation process. Precise measurements of transverse relaxation necessitate use of the CPMG technique to avoid influence of diffusion-effects on quantification at long echo-times. CPMG are inherently challenging, since care must be taken to avoid slice crosstalk and requires the use of a train of high SAR 180° pulses, possibly leading to tissue heating. For 3D measurements the effective transverse relaxation time, R2* , can be used but the relative contributions from R2 and R2` need to be investigated.
In the present work we investigate the use of R2* maps to monitor penetration and fixation with formalin-based agents.
Method
Four formalin-based fixative agents with/without polyvinylpyrrolidone (PVP) and different salt concentrations were formulated to achieve different dielectric properties and to optimize B1-transmit homogeneity at 9.4T.Pig brain samples were bought from a slaughter house and placed in fixative solutions with a post-mortem interval of less than 6h and were kept at room temperature at all times. For each fixative a sample was embedded in one of the chambers of a container subdivided into four equal segments, using sterile gauze soaked in the same fixative. Simultaneous MR-scanning of all samples was performed at 12 hours, 1, 2, 3, 4, 13, 19, and 28 days after start of fixation, at 9.4T in a Siemens whole body MR scanner using a 16-channel transmit array in combination with a 31-element receive array [8]. R2* were obtained from fitting the multi-exponential decay data acquired with a multi-echo GRE (TE= 6.03, 12, 18, 24, 30 ms; TR=34 ms; FA =15°; voxel size=0.4 mm isotropic; FoV=204×165.8×46 mm3). R2-maps were obtained from CPMG-spin-echo-images of a single slice; (TR=3s ; 32 echoes in steps of 7.2ms; TE1=7.2,TE32=227.6ms; voxel size: 0.47x0.47x2mm³; FoV=192x192x2 mm3) analyzed with the extended phase graph model. The data acquired on different days were co-registered using SPM12 and were mapped to the same spatial grid using nearest neighbor interpolation. White (WM) and grey matter (GM) voxels were identified from anatomical T1-weighted scans at the first time point. In line with previous studies, the kinetics of the changes in R2* was well-described by a sum of a mono exponential recovery and decay and allowed pixel-wise fitting, R2* = A.e-at + B(1-e-bt), where and are the coefficients for the exponential decay and recovery, respectively. The time-point at which the maximum R2* was reached, was determined numerically after pixel-wise fitting
Results
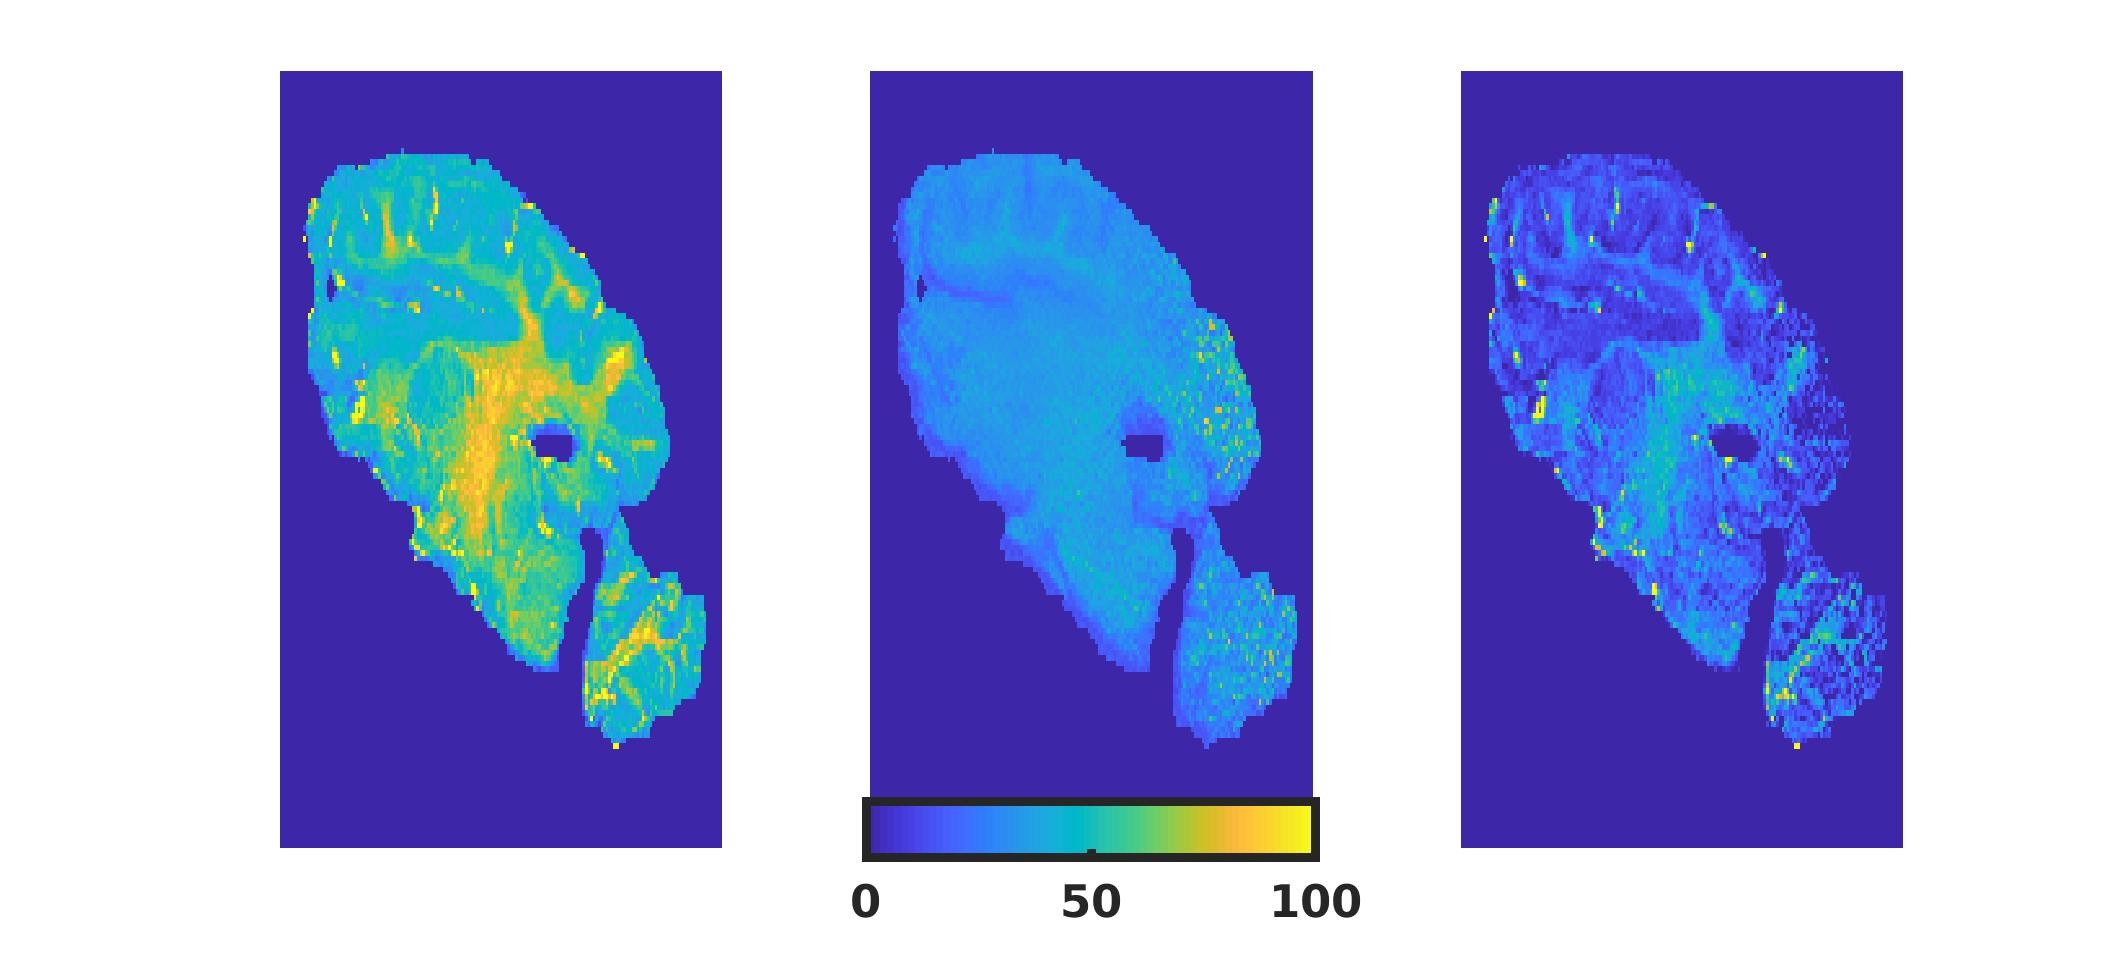
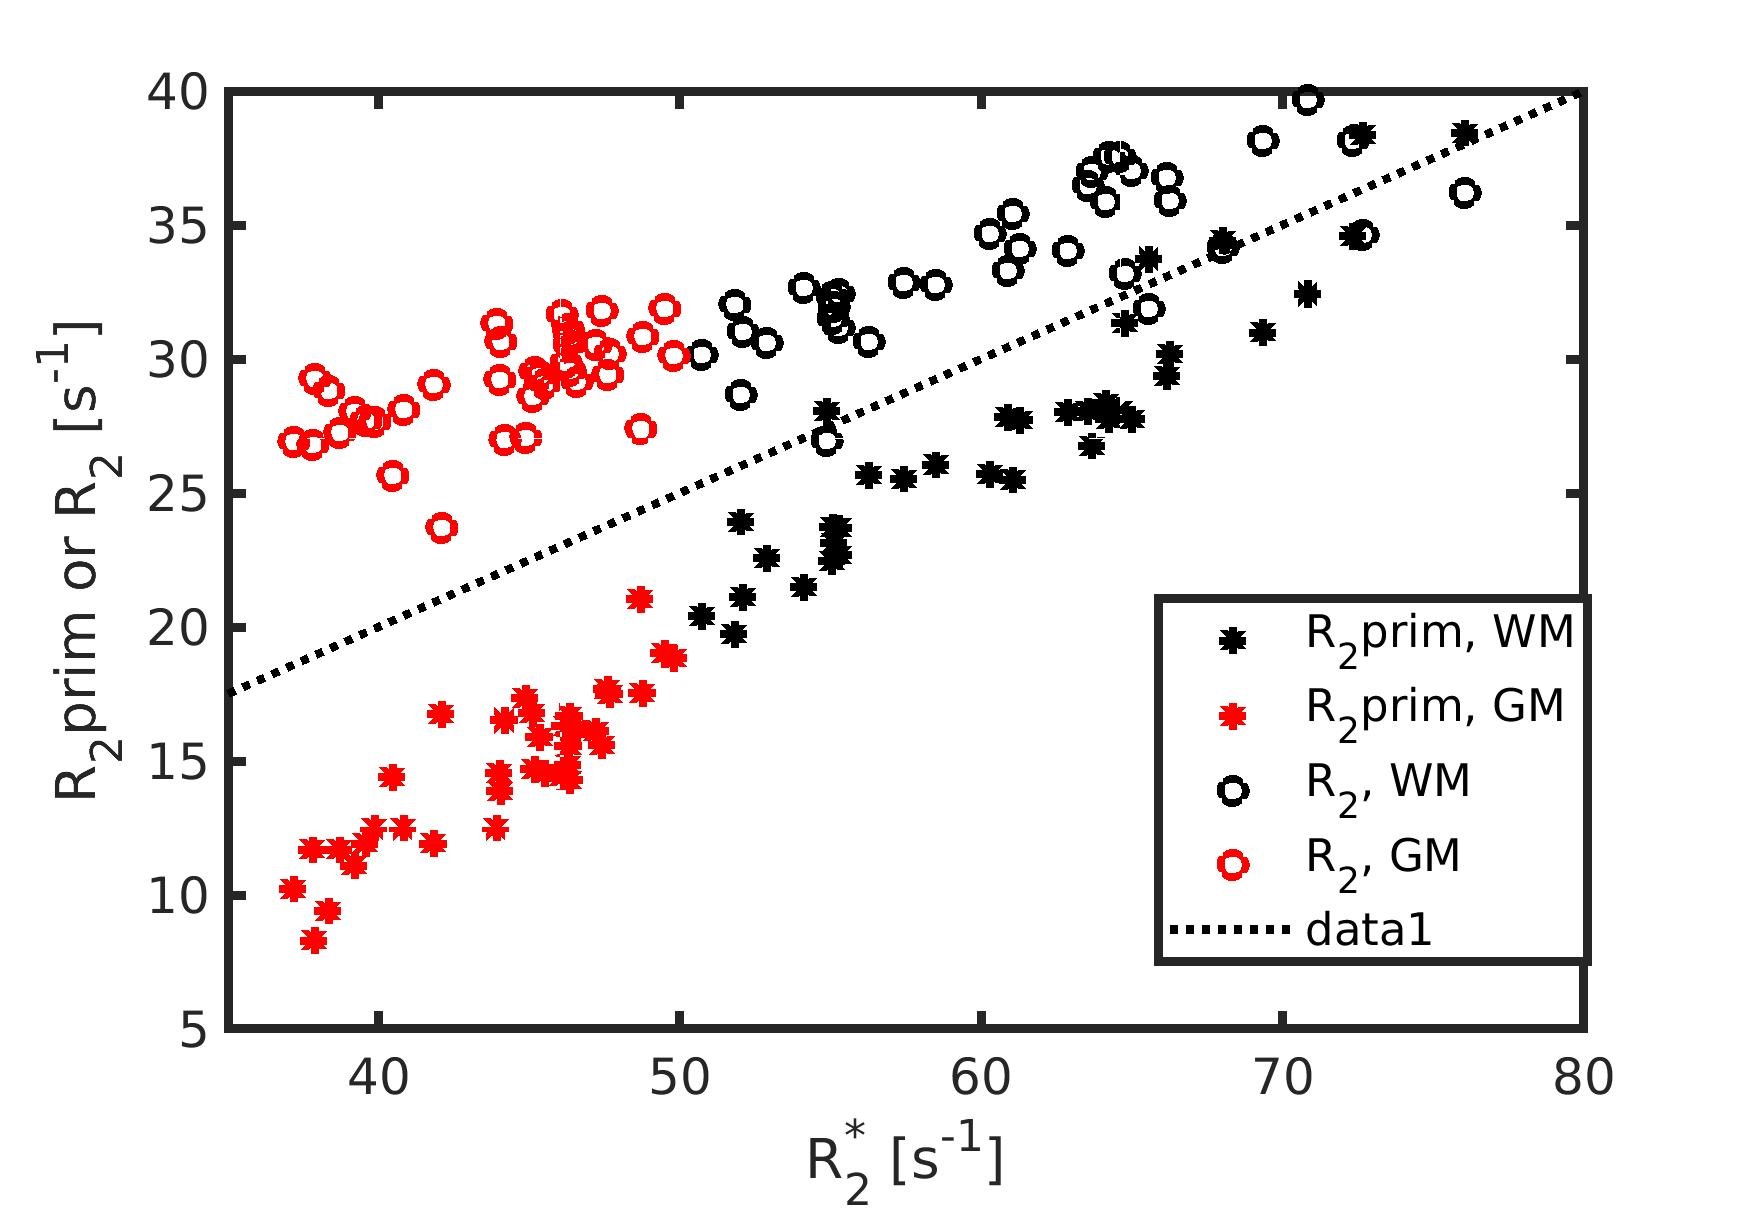
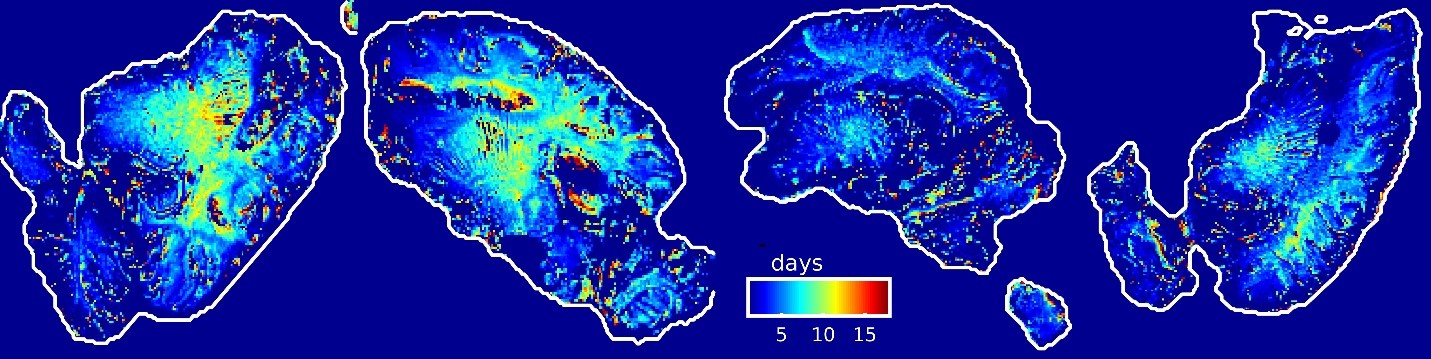
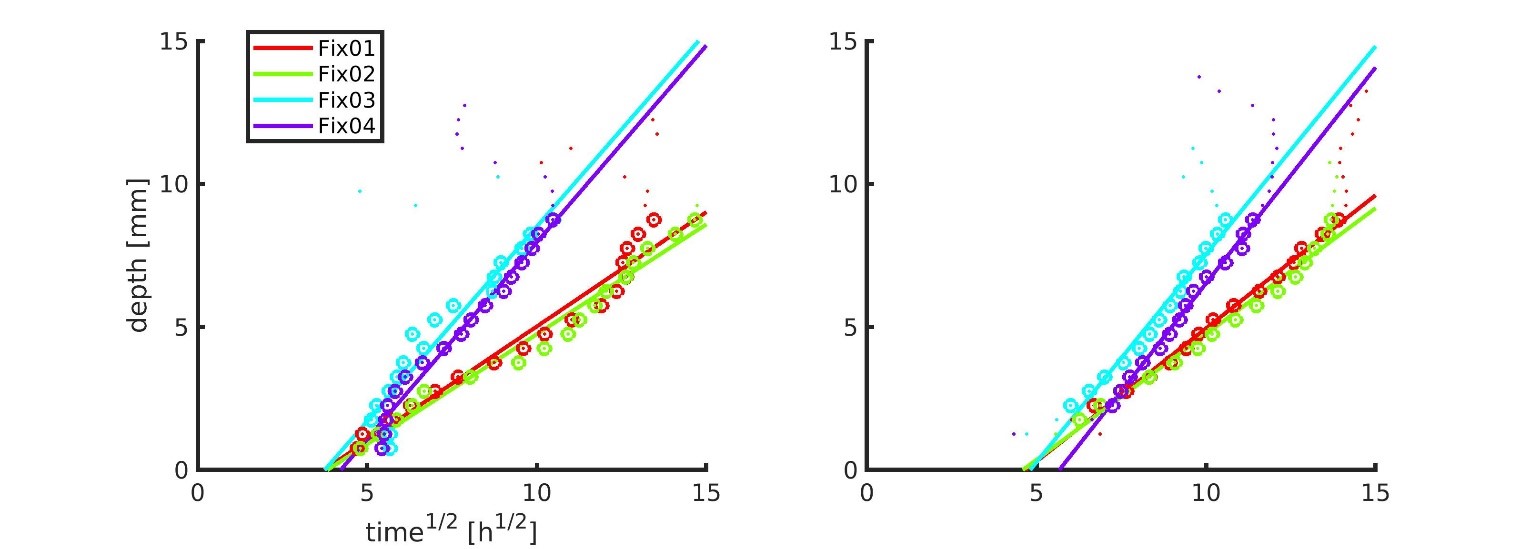
Figure 1 shows the R2*, R2 and R2` maps of Fix02 at day 28. Considering all fixatives and all time-points we found that R2* is dominated by R2-effects, especially in GM (Figure 2). Figure 3 shows an increase in R2* values with fixation time, which is sudden in GM, and more prolonged in WM. The R2* variation rate slows down after day 13 in GM, likely reflecting completion of the fixation procedure. Maximum R2* values are reached at later time-points for PVP containing fixatives and at larger tissue depths (Figure 4). Fitting of the depths against the square-root-of the timepoint for maximal R2* yielded coefficients of 0.9mm/sqrt(hour) without PVP in Fix01 and Fix02 and 1.5mm/sqrt(hour) with PVP (Figure 5).Discussion and conclusion
The multi-faceted kinetics of T2 during immersion fixation has been modelled previously as contributions from fixed, unfixed and decomposed tissue in varying fractions during fixation [3]. The two exponentials used here for R2* likely captures the combined effect of cellular swelling and tissue decay, on the one hand, and penetration and molecular cross-linking of the fixative agent on the other hand. Fitting could be obtained voxel-wise, yielding consistent results, with maximal R2* values reached at later time points with increasing tissue depths. Fitting yielded values that correspond well to previously reported rates of fixative diffusion. [4-5], suggesting the use of quantitative R2* mapping to monitor formalin penetration and tissue fixationAcknowledgements
No acknowledgement found.References
1. Gouw A. A., Seewann A., Vrenken H., Van der Flier W. M. , Rozemuller J.M., Barkhof F., Scheltens P., Geurts J.J., et al. Heterogeneity of white matter hyperintensities in Alzheimer's disease: post-mortem quantitative MRI and neuropathology. Brain. 2008; 131: 3286-3298.
2. Dawe R.J., Bennett D.A., Schneider J.A., Vasireddi S.K., Arfanakis K., et al. Postmortem MRI of human brain hemispheres: T2 relaxation times during formaldehyde fixation. Magn. Reson. Med. 2009; 61(4):810–818.
3. Shepherd T., Thelwall P., Stanisz G., Blackband S., et al. Aldehyde fixative solutions alter the water relaxation and diffusion properties of nervous tissue. Magn. Reson. Med. 2009; 62 (1): 26-34.
4. Start RD, Layton CM, Cross SS, Smith JH. Reassessment of the rate of fixative diffusion. J Clin Pathol. 1992;45(12):1120-1121. doi:10.1136/jcp.45.12.1120
5. Medawar PB. III.-THE RATE OF PENETRATION OF FIXATIVES. J R Microsc Soc. 1941;61(1-2):46-57. doi:10.1111/j.1365-2818.1941.tb00884.x.
6. Shajan G., Kozlov M., Hoffmann J., Turner R., Scheffler K. and Pohmann R., et al. A 16-Channel Dual-Row Transmit Array in Combination with a 31-Element Receive Array for Human Brain Imaging at 9.4 T. Magn. Reson. Med. 2014; 71:870–879.
Figures