4382
Feasibility of 3T imaging in idiopathic normal pressure hydrocephalus patients with Certas Plus Valve: comparison of artifacts 3T vs 1.5T.1Mayo Clinic, Rochester, MN, United States
Synopsis
We compared the artifact induced by the Certas Plus at 3.0T vs 1.5T in 9 patients with idiopathic normal pressure hydrocephalus (iNPH) on six sequences (3D MPRAGE, Sagittal T1, axial DWI, axial GRE, axial T2 FLAIR, axial T2 FSE) at three levels (atria of the lateral ventricles, cerebral aqueduct, and cerebellum hemispheres). The 1.5T scans had a significantly greater area of artifact on DWI (all levels) and GRE (cerebellar level) sequences, and a smaller area of artifact on T2 FLAIR (cerebellar level). Post-shunt imaging at 3T with the Certas plus valve is feasible and with lesser artifact than on 1.5T.
Introduction
Idiopathic normal pressure hydrocephalus (iNPH) may be treated with ventriculoperitoneal (VP) shunt placement (1). After VP shunt placement, imaging with CT - and more recently MRI - is performed to evaluate for features of overdrainage and improvement in radiographic features of iNPH, as an indirect indicator of shunt function. Unfortunately, the shunt valve may induce artifacts that shadow the adjacent brain regions and obscure evaluation. In our clinical practice, post-shunt imaging is typically triaged to 1.5T scanners rather than 3T in an effort to reduce shunt-related artifact based on theory and prior work (2). While the extent of shunt-related artifact has been studied for several types of shunt valves (3), only limited in vivo studies exist on the extent of shunt-related artifact from the more recently available Certas plus valve (4, 5). The goal of this study was to compare areas and volumes of shunt-induced artifact between 3T and 1.5T images in iNPH patients with a Certas Plus valve as an initial step in assessing feasibility of 3T post-shunt imaging.Methods
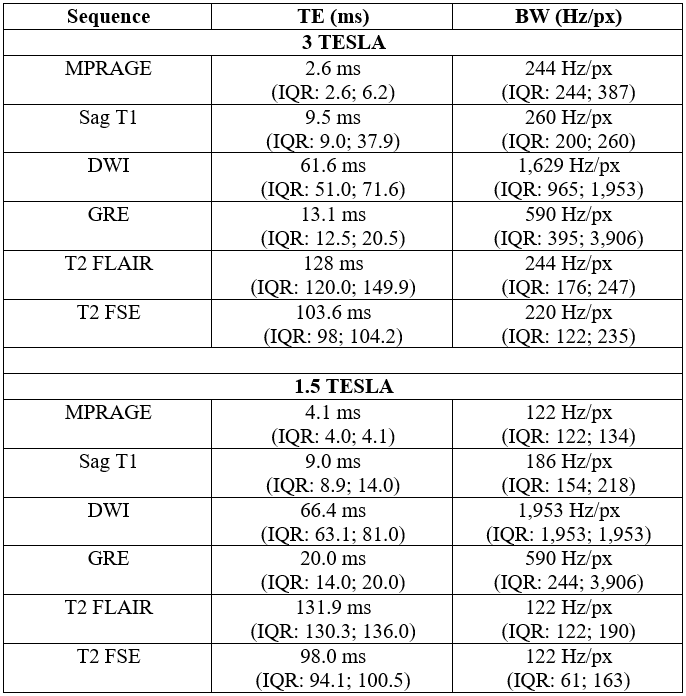
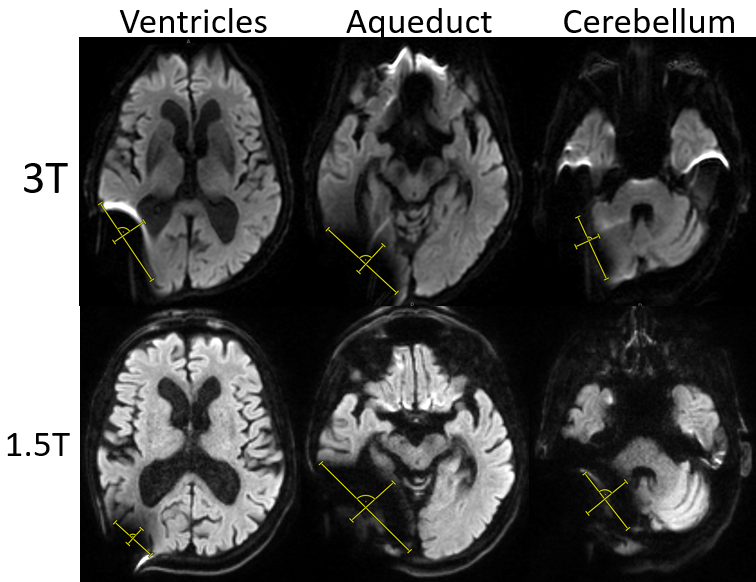
Patients: We retrospectively identified a cohort of 9 iNPH patients using an in-house built software for patient diagnostic code detection. Inclusion criteria were a Certas Plus valve placed via the right parietal approach for treatment of iNPH and at least one 3T and one 1.5T MRI performed after the surgery. Imaging: Imaging was performed on 1.5T (7 GE, 2 SIEMENS) and 3T (5 GE, 4 SIEMENS). MPRAGE, sagittal T1, axial DWI, axial GRE, axial T2 FSE, and axial T2 FLAIR were performed according to standard clinical imaging protocols. Acquisition parameters are summarized in Figure 1.Analysis: We calculated area on artifact (defined as the region of signal blowout, as shown in Figure 2) in a transversal plane by measuring the 2 greatest dimensions at 3 levels: atria of the lateral ventricle, cerebral aqueduct, and mid cerebellar hemispheres. We assumed an elliptic shape and used the formula: $$A = πab$$We also calculated the volume of artifact at the aqueductal level assuming an ellipsoid shape with the following formula: $$V = (4/3)πabc$$ with a and b representing the 2 dimensions of aqueductal area artifact and c representing the craniocaudal dimension of the artifact, calculated on a sagittal plane. A Wilcoxon Rank Sum Test was used to compare areas and volumes of artifacts between 3T and 1.5T scans. The null hypothesis represented no differences among field strengths. P-values smaller than 0.05 were considered statistically significant.
Results
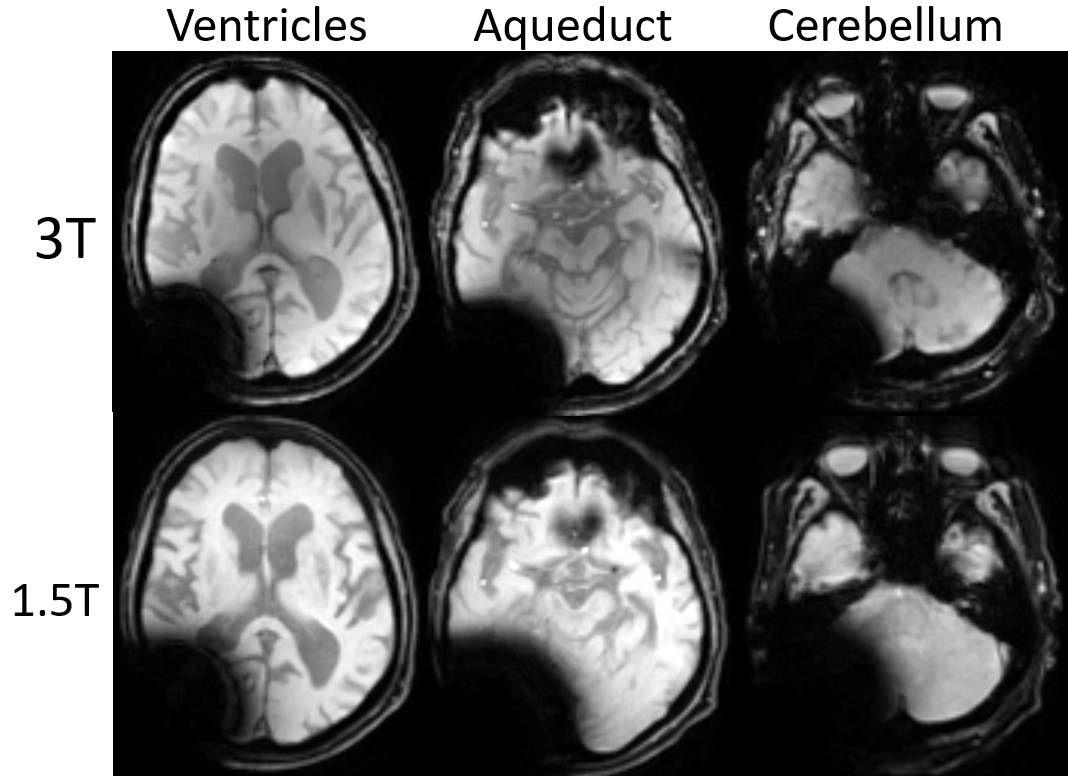
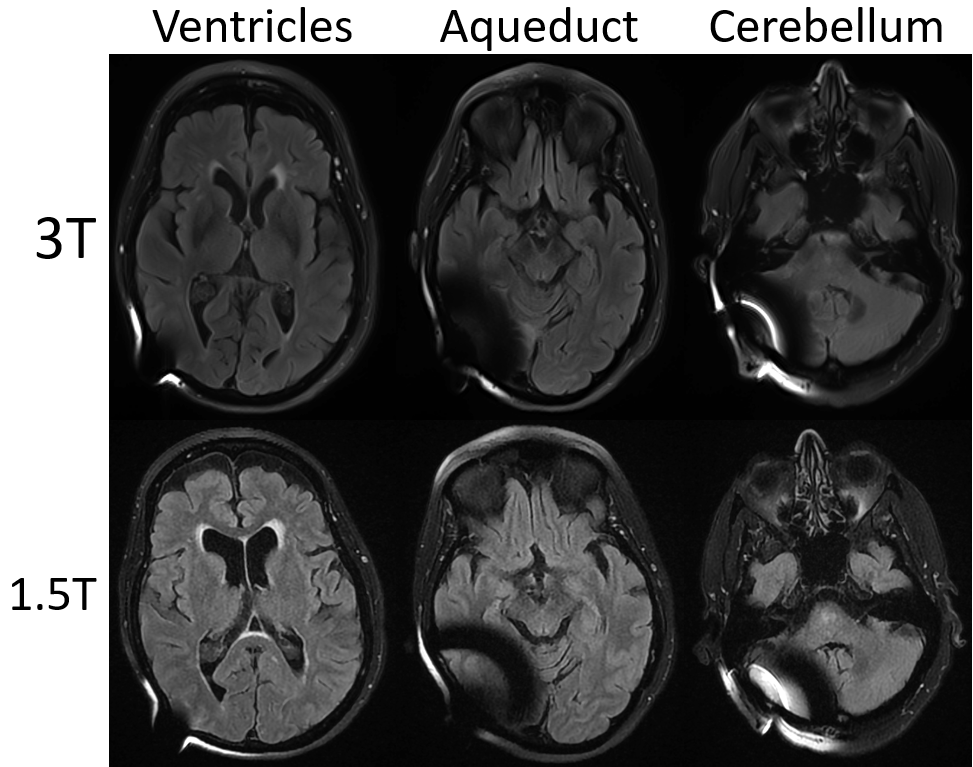
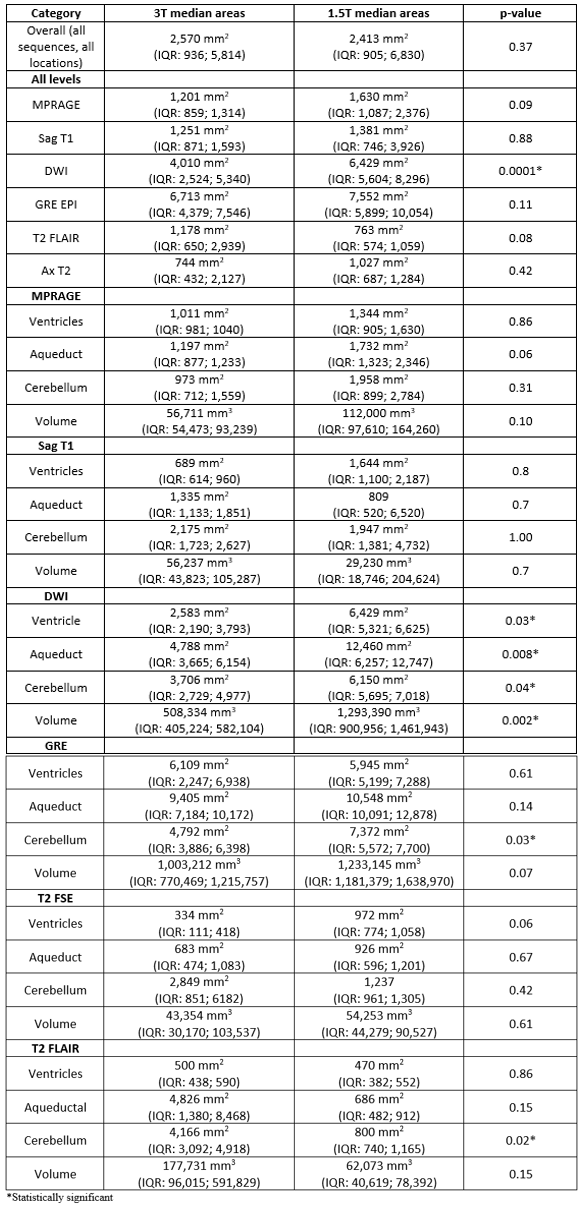
When considering all levels together, DWI showed a smaller extent of artifact on 3T vs 1.5T (p= 0.0001). Breaking down comparisons by individual sequences and levels, 3T scans had a significantly lesser degree of artifacts on DWI (Figure 2. Lateral ventricle p= 0.03; aqueduct p= 0.008; cerebellum p= 0.04) and on GRE (Figure 3. Cerebellum p= 0.03). On the contrary, 1.5T imaging had less artifacts in T2 FLAIR (Figure 4. Cerebellum p= 0.02). In terms of artifact volumes, we found that 3T images had smaller volumetric artifacts as compared to 1.5T on DWI (p= 0.002). The other sequences did not show a statistical difference between 3T and 1.5T. On MPRAGE, there was a trend toward smaller extent of artifact on 3T. On sagittal T1 and axial T2, there was a trend toward smaller extent of artifact at the level of lateral ventricles and cerebral aqueduct at 3T, though larger artifact at the level of the cerebellum. All results are reported in Figure 5.Discussion
Our results indicate that the relative extent of artifact on 3T vs 1.5T depends on the imaging sequence and anatomic location. The imaging sequences most prone to susceptibility artifact, DWI and GRE, showed on average less artifact at 3T vs 1.5T. Findings correspond with prior work showing smaller extent of artifact on 3T vs 1.5T DWI when a shunt valve was fixed to the temporal scalp of healthy volunteers (5). Artifact was on average similar in extent between 3T and 1.5T on the MPRAGE and sagittal T1 sequence, while T2 FLAIR showed greater extent of artifact on 3T. The differential performance by sequence may be related acquisition technique as well as specific parameters, such as TE and BW, which will be further evaluated in future studies. Regarding the anatomic location, 3T on average performed better on more cranial sections particularly on MPRAGE, DWI, and GRE, but had more artifacts at the lowest imaging plane evaluated, particularly on T2 FLAIR. The difference in artifact extent at more cranial vs caudal levels on 3T vs 1.5T may reflect differences in shape of the artifact.Conclusion
Our results indicate that post-shunt imaging in iNPH patients with the Certas Plus valve can be performed at 3T with the extent of shunt artifact being less than or similar to that on a 1.5T scanner on most sequences. The decreased artifact extent at 3T is likely related to difference in scan parameters and implies that artifact could be further reduced with future optimization of sequence parameters. Implications for clinical practice include wider availability of scanners on which post-shunt imaging may be performed and feasibility to perform potentially higher quality 3T exams without increased extent of shunt-related artifact compared to 1.5T.Acknowledgements
No acknowledgement found.References
1. Toma AK, Papadopoulos MC, Stapleton S, Kitchen ND, Watkins LD. Systematic review of the outcome of shunt surgery in idiopathic normal-pressure hydrocephalus. Acta Neurochir (Wien). 2013;155(10):1977-80.
2. Matsuura H, Inoue T, Ogasawara K, Sasaki M, Konno H, Kuzu Y, et al. Quantitative analysis of magnetic resonance imaging susceptibility artifacts caused by neurosurgical biomaterials: comparison of 0.5, 1.5, and 3.0 Tesla magnetic fields. Neurol Med Chir (Tokyo). 2005;45(8):395-8; discussion 8-9.
3. Toma AK, Tarnaris A, Grieve JP, Watkins LD, Kitchen ND. Adjustable shunt valve-induced magnetic resonance imaging artifact: a comparative study. J Neurosurg. 2010;113(1):74-8.
4. Uchida D, Amano Y, Nakatogawa H, Masui T, Ando N, Nakayama T, et al. Setting pressure can change the size and shape of MRI artifacts caused by adjustable shunt valves: a study of the 4 newest models. J Neurosurg. 2018:1-8.
5. Amano Y, Kuroda N, Uchida D, Sakakura Y, Nakatogawa H, Ando N, et al. Unexpectedly Smaller Artifacts of 3.0-T Magnetic Resonance Imaging than 1.5 T: Recommendation of 3.0-T Scanners for Patients with Magnet-Resistant Adjustable Ventriculoperitoneal Shunt Devices. World Neurosurg. 2019;130:e393-e9.
Figures