4381
Myelin Water Imaging in an HIV Population at Risk of Cerebral Small Vessel Disease1Department of Neurology, University of Rochester, Rochester, NY, United States, 2Department of Electrical and Computer Engineering, University of Rochester, Rochester, NY, United States, 3Department of Biomedical Engineering, University of Rochester, Rochester, NY, United States
Synopsis
HIV-infected individuals are at increased risk of developing cerebral small vessel disease (CSVD). Myelin damage is a feature in CSVD, and can be quantified using myelin water imaging. In this work, we investigated if MWI can be used to quantify myelin related changes in white matter in an HIV cohort at risk of CSVD. Our results lend support to the use of MHI to track myelin related abnormalities in the white matter.
Introduction
With an aging HIV population, there are valid concerns that persistent chronic inflammation may contribute to an increased risk of developing cerebral small vessel disease (CSVD) even after treatment with combination antiretroviral therapy (cART) [1, 2]. Demyelination, edema and gliosis are the most common findings in CSVD and are predominantly manifested as white matter hyperintensities (WMHs) in standard MR images [1]. Myelin water imaging (MWI), based on multicomponent T2 relaxation, provides highly specific myelin estimates through myelin water fraction (MWF) mapping [3, 4]. Generally, MWF results are interpreted by the mean value within a region of interest (ROI). However, recent studies reported an index termed as myelin heterogeneity index (MHI) calculated as the standard deviation (SD) of MWF divided by the mean within an ROI that could be more sensitive to myelin-related changes [5, 6]. The purpose of this work was to compare mean MWF, SD MWF and MHI between HIV+ and HIV- cohorts, and investigate their relationship with WMH volumes.Methods
After obtaining written informed consent 25 HIV+ patients (age=53±13 years, male/female=18/7) and 32 matched controls (HIV-) (age=57±9 years, male/female=24/8) were imaged at 3T (Siemens Prisma Fit, Germany) equipped with 64-channel head coil. The MRI protocol includes: 1) a T1w image using a 3D MPRAGE sequence [inversion time TI=926 ms, TR=1840 ms, TE=2.45 ms, voxel size=1.0×1.0×1.0 mm3, number of slice =176, scan time=4:16 min]; 2) 3D T2-weighted FLAIR imaging [TI=1,800 ms, TR=5,000 ms, TE=215 ms, voxel size=1.0×1.0×1.0 mm3, number of slices=256, scan time=5:40 min]; 3) whole brain MWI using a 3D gradient and spin echo (GRASE) sequence [TR=1,000 ms, number of echoes=32, TE=10 ms, echo spacing=10 ms, number of slices=24, slice thickness=5 mm, voxel size=1.5×1.5×5 mm3, scan time=9:33 min].Structural segmentation was performed on the T1w images using the anatomical processing script (fsl_anat), available as part of FMRIB's Software Library (FSL) [7]. The processing pipeline includes image reorientation and cropping, radio-frequency bias-field correction, linear, and nonlinear registration to MNI 2mm standard space via FLIRT and FNIRT respectively, brain extraction via BET [8], tissue segmentation with FAST, and subcortical structure segmentation using the FIRST algorithm. Lesion segmentation was performed from T1w and FLAIR images using volBrain, an automated online MRI brain volumetry system [9].
Voxel‐wise MWF maps were computed using a regularized, non‐negative least squares algorithm while compensating for stimulated echoes, as reported previously [4]. In this way, MWF was calculated as the ratio of the T2 signal from 10 to 40 ms (i.e., myelin water) divided by the total T2 signal from 10 to 200 ms (i.e., myelin water plus intra/extracellular water). T2w GRASE images at 12th echo in native space were then co‐registered (affine) with each participant's bias-field corrected T1w image and then applied the brain masks. Same brain masks were applied to MWF. Spatial normalization of the MWF map was performed using FSL.
The JHU atlas was used to calculate region averages in native space for 5 pre-defined regions-of-interest (ROIs) [i.e., SCC: Splenium of the Corpus Callosum; GCC: Genu of the Corpus Callosum; ALIC: Anterior Limbic Internal Capsule; PLIC: Posterior Limbic Internal Capsule; and PWM: Periventricular White Matter. An unpaired t-test was used to compare the differences in ROIs between the two cohorts. Pearson correlation analyses were performed to find the associations between imaging metrics and WMHs after controlling for age.
Results & Discussion
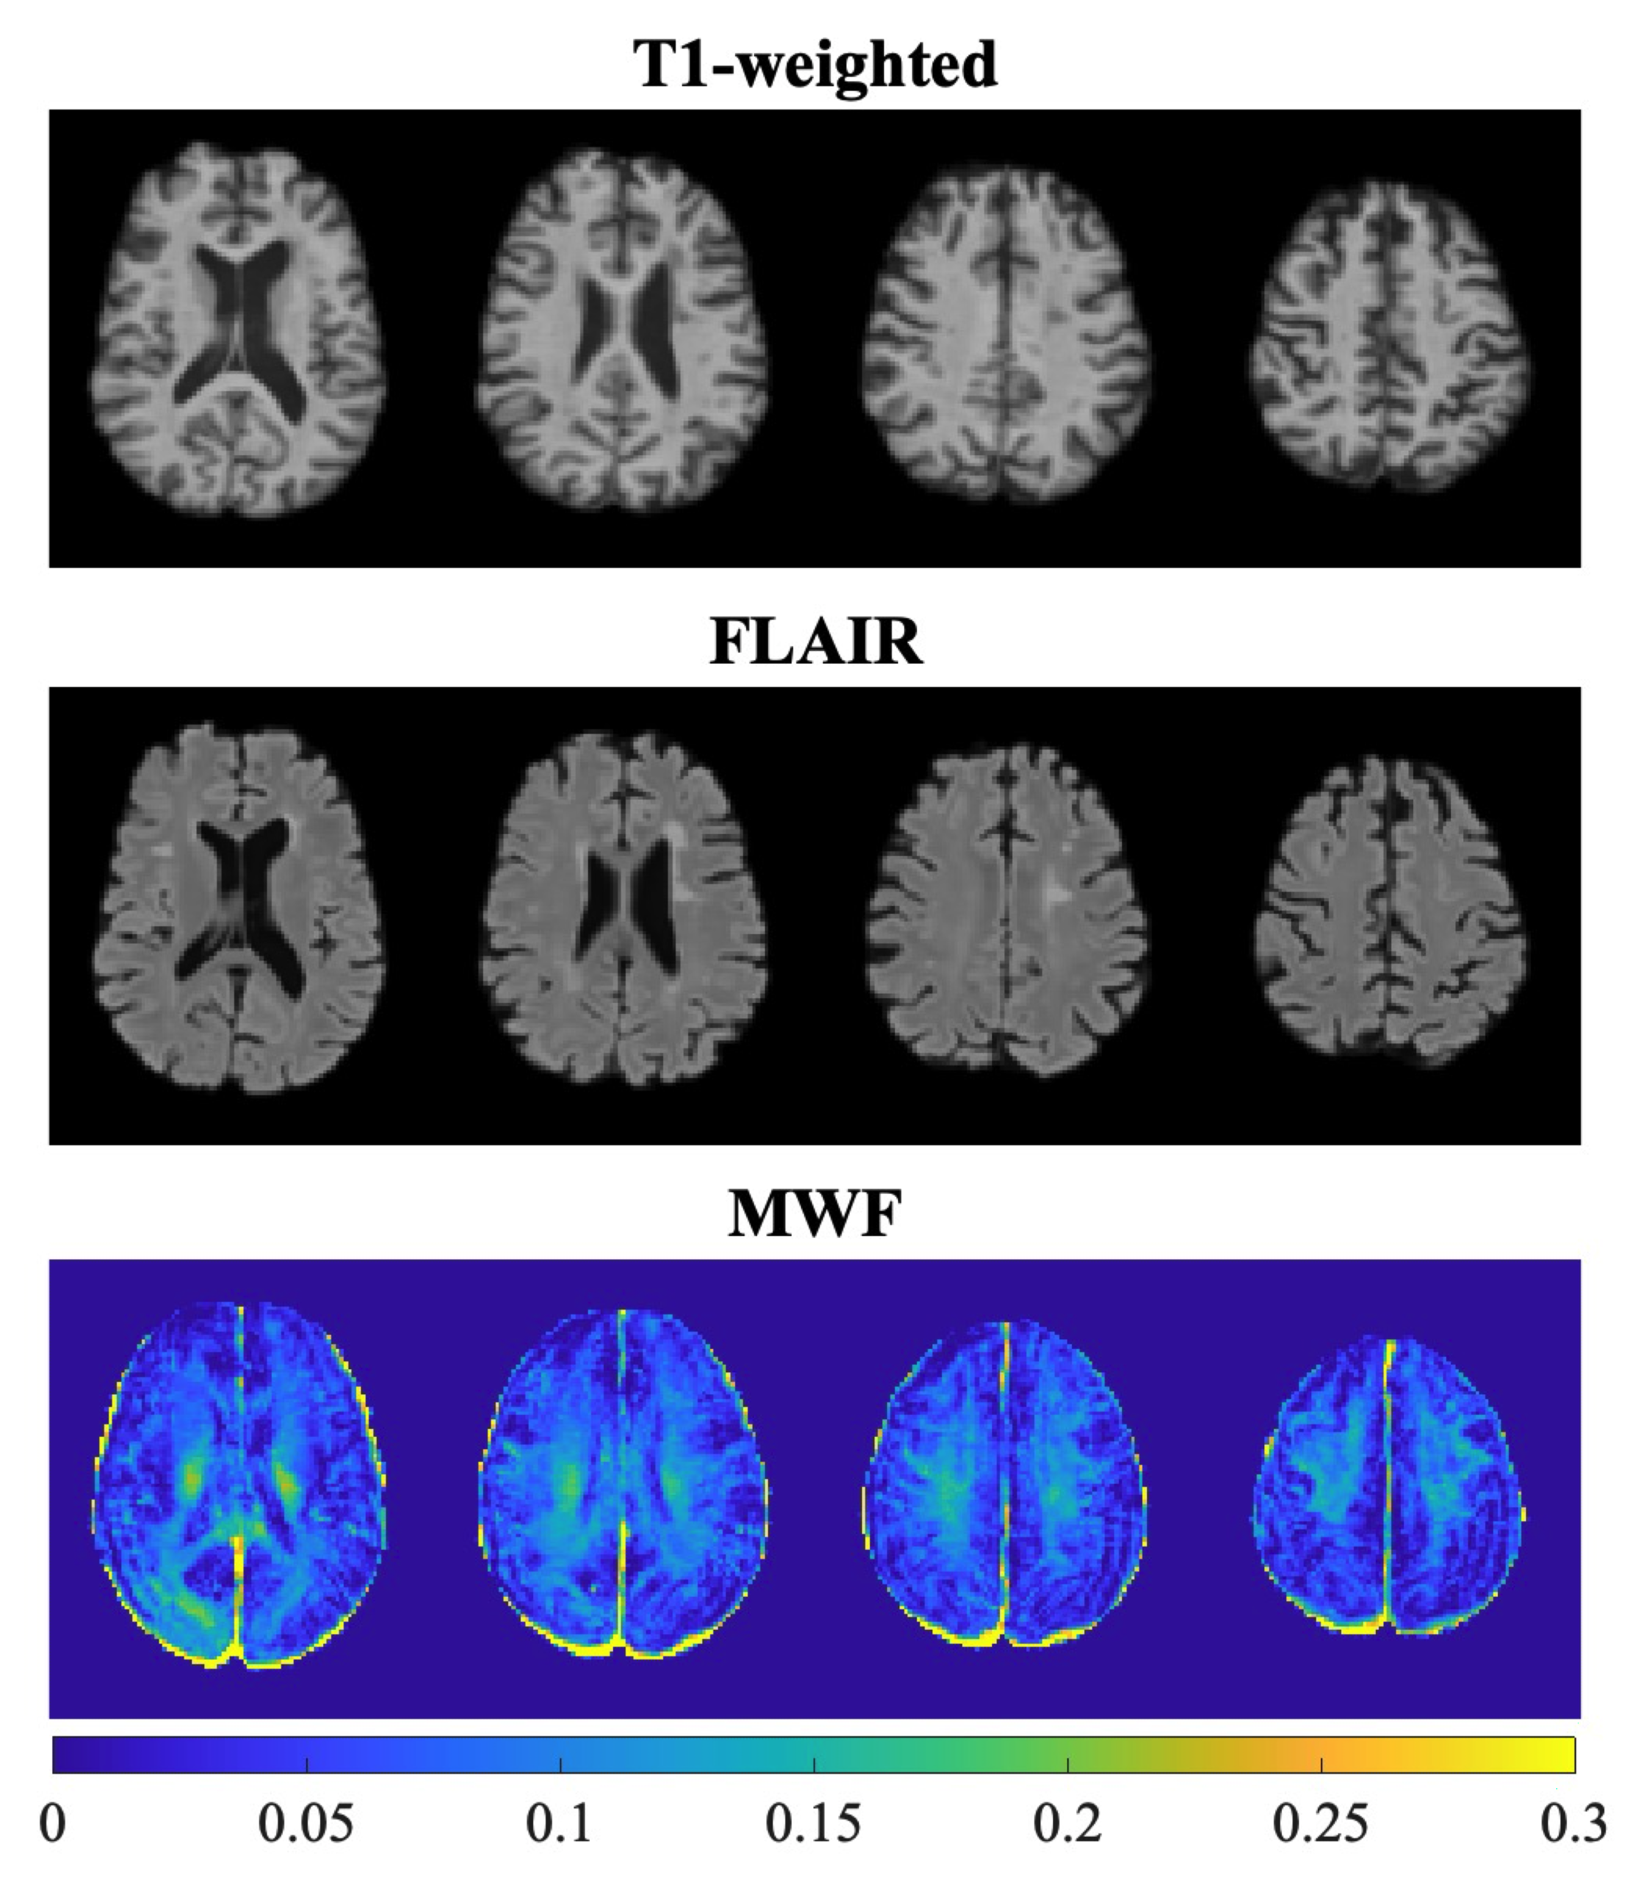
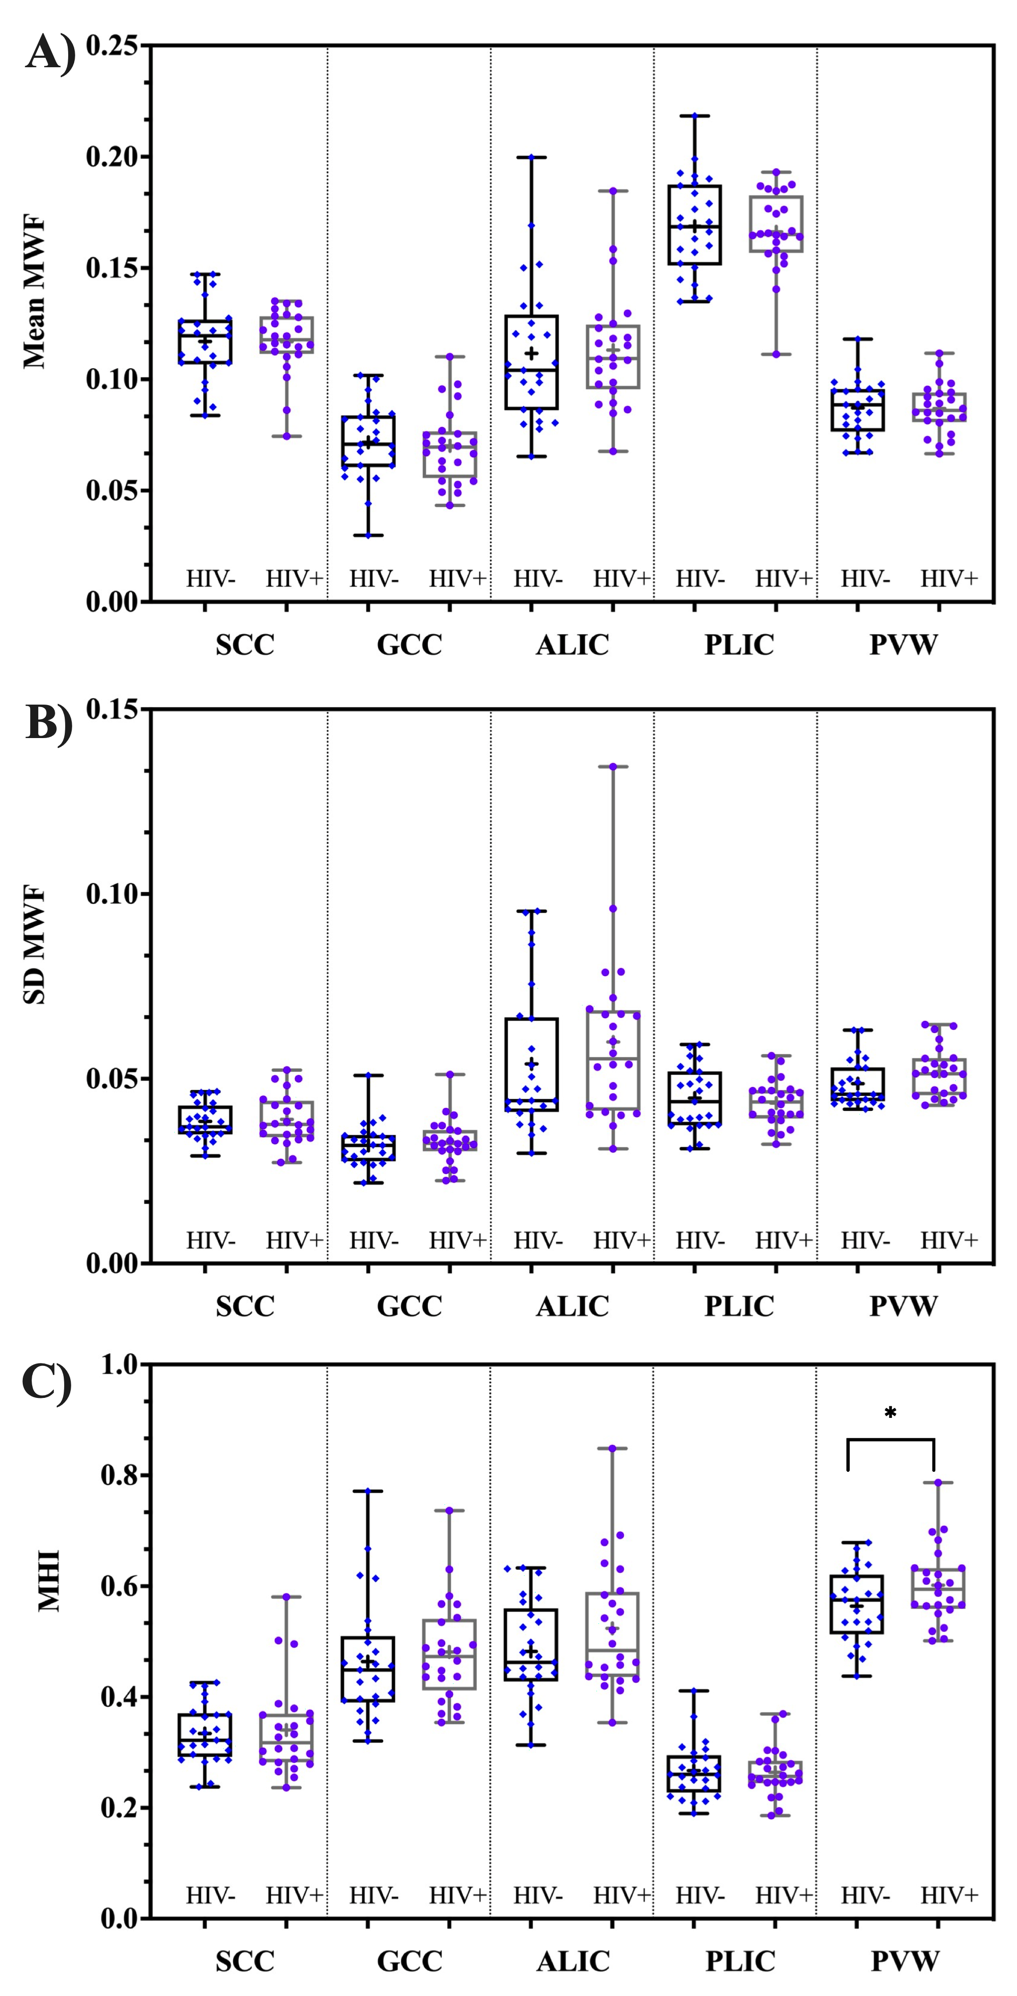
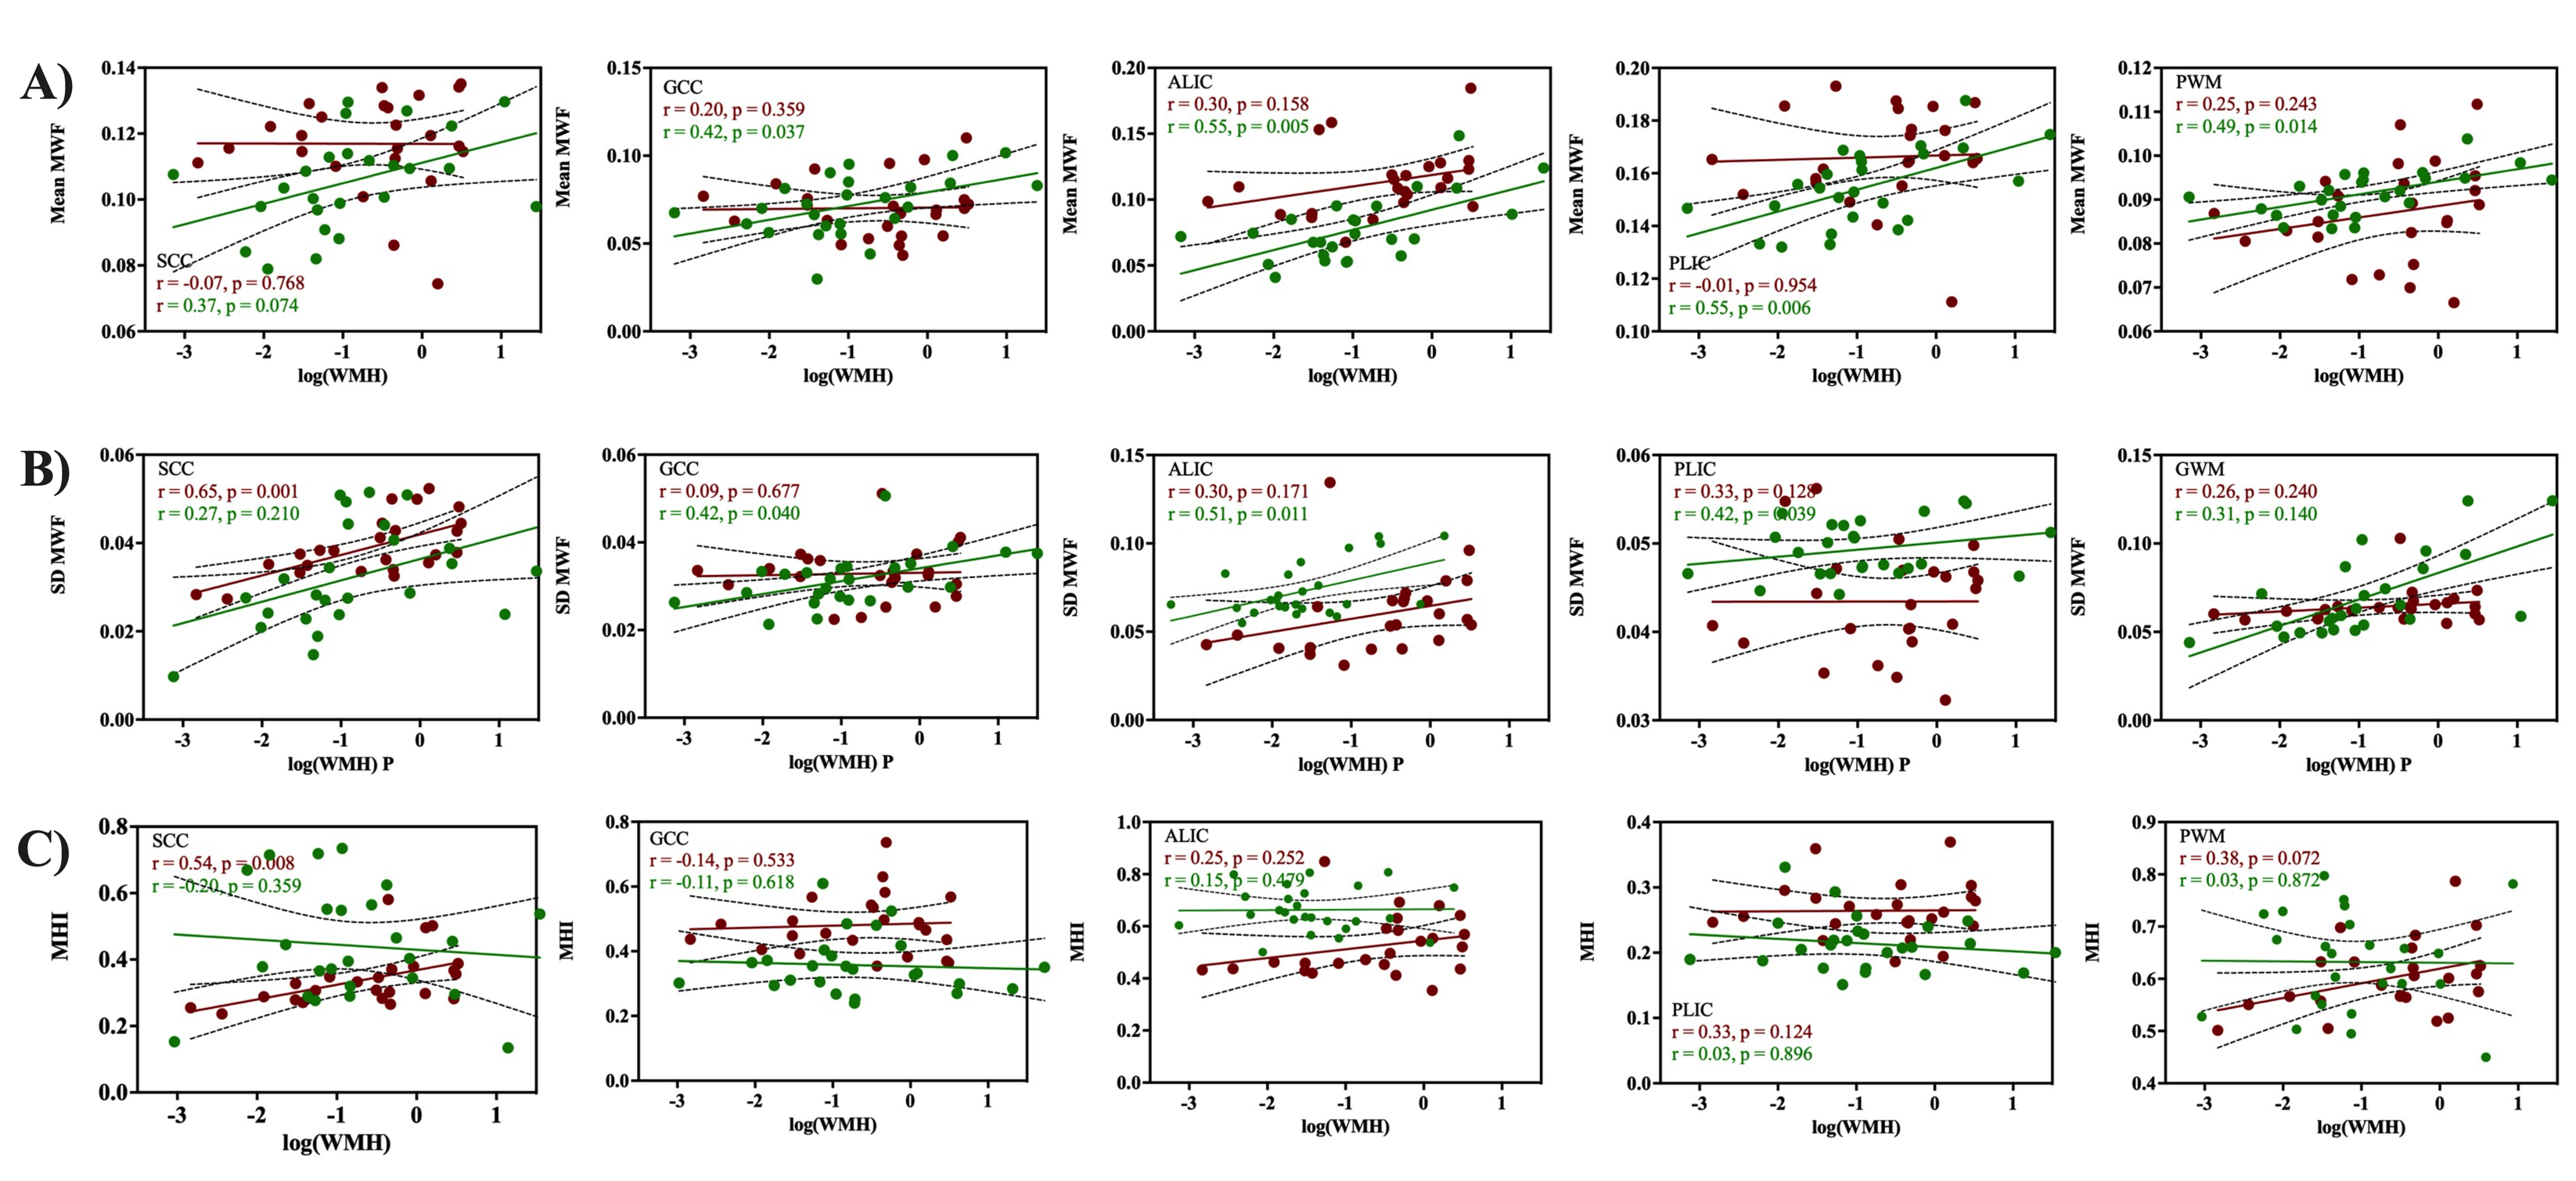
Figure 1 represents example images (anatomical images: T1w, T2-FLAIR and MWF maps) from a 61 years old HIV+ participant. Figure 2 shows whisker-box plots comparing MWF (mean and SD) and MHI in 5 different WM structures for HIV+ vs. HIV- cohorts. Mean and SD MWF were not significantly different between HIV+ and HIV- cohorts for any ROIs. This is likely due to the fact that demyelination is not prominent in this cohort as well as the natural variations in myelin content between HIV- subjects. MHI which reflects both myelin content and variability simultaneously showed increasing trends in HIV+ subjects compared to the HIV- subjects in most of the ROIs but only PWM was marginally significant (t=1.97, p=0.05). Figure 3 shows the relationship between MWF (mean and SD) and MHI with absolute WMH volumes (log-transformed). We found positive correlations between WMH volumes and Age (r=0.40, p=0.004) pooling all subjects. Mean MWF and SD MWF in WM ROIs showed moderate associations with WMH volumes in both HIV+ and HIV- subjects indicating the different amounts of the variability of myelin content present for each ROI. MHI vs. WMH volumes were significantly correlated in the SCC (r=0.54, p=0.008) and marginally significant in the PWM (r=0.38, p=0.072). Thus, MHI might be useful in detecting differences in myelin damage between HIV+ and HIV- at risk of CSVD.Conclusion
Myelin-related abnormality in HIV+ infected individuals at risk of CSVD can be better quantified with MHI. Future studies, with larger sample size, are necessary to confirm these findings. Furthermore, the clinical relevance of MWI metrics will be established by assessing the relationship with neurocognitive function.Acknowledgements
This work was supported by the National Institutes of Health (Grant Numbers: R01 AG054328, and R01 MH118020), and the Del Monte Institute of neuroscience, University of Rochester (Pilot grant).References
1. T., et al., White matter hyperintensities in relation to cognition in HIV-infected men with sustained suppressed viral load on combination antiretroviral therapy. Aids, 2016. 30(15): p. 2329-2339.2.
2. Haddow, L.J., et al., Magnetic Resonance Imaging of Cerebral Small Vessel Disease in Men Living with HIV and HIV-Negative Men Aged 50 and Above. AIDS research and human retroviruses, 2019.3.
3. Mackay, A., et al., In vivo visualization of myelin water in brain by magnetic resonance. Magnetic resonance in medicine, 1994. 31(6): p. 673-677.
4. Prasloski, T., et al., Rapid whole cerebrum myelin water imaging using a 3D GRASE sequence. Neuroimage, 2012. 63(1): p. 533-539.
5. Abel, S., et al., Associations between findings from myelin water imaging and cognitive performance among individuals with multiple sclerosis. JAMA network open, 2020. 3(9): p. e2014220-e2014220.
6. Lee, L.E., et al., Cervical cord myelin abnormality is associated with clinical disability in multiple sclerosis. Multiple Sclerosis Journal, 2021: p. 13524585211001780.
7. Smith, S.M., et al., Advances in functional and structural MR image analysis and implementation as FSL. Neuroimage, 2004. 23: p. S208-S219.
8. Smith, S.M., Fast robust automated brain extraction. Human brain mapping, 2002. 17(3): p. 143-155.
9. Manjón, J.V. and P. Coupé, volBrain: an online MRI brain volumetry system. Frontiers in neuroinformatics, 2016. 10: p. 30.
Figures