4380
Role of insulin resistance in the optic nerve glymphatic system1Department of Ophthalmology, New York University Grossman School of Medicine, NYU Langone Health, New York, NY, United States, 2Department of Radiology, New York University Grossman School of Medicine, NYU Langone Health, New York, NY, United States
Synopsis
Recent evidence suggests the existence of a functional glymphatic system in the optic nerve. Insulin resistance in the central nervous system (CNS-IR) has been implicated in neurodegenerative conditions. Its mechanism remains unclear though one candidate involves dysregulation of the cerebrospinal fluid (CSF). Here, we investigated if CNS-IR affects CSF flow in the visual pathway by measuring the spatiotemporal profiles of CSF dynamics using gadolinium-enhanced MRI following intrathecal administration of the specific insulin receptor blocker, S961. Our results suggested that central insulin function may play an imperative role in CSF dynamics for the homeostasis of the visual system.
Introduction
Recent studies have identified the existence of the glymphatic system in the brain for metabolic waste removal1. The optic nerve (ON) shares several characteristics with the brain2 including the absence of lymphatic vessels3, while a few ex-vivo studies have illustrated the presence of anatomical glymphatic components in the ON4-6. Characterization of the properties of CSF entry and clearance in the ON via in vivo imaging may allow for the identification of the function in the ON glymphatic system as well as the understanding of the mechanisms of relevant diseases. Insulin resistance (IR) in the central nervous system (CNS-IR) is associated with dysregulation of the cerebrospinal fluid (CSF) space which may lead to detrimental effects on the glymphatic system7. Although CNS-IR has been studied in different neurodegenerative diseases such as Alzheimer’s, whether and how CNS-IR affects the glymphatics of the visual system remains unclear. Here, we used contrast-enhanced MRI (CE-MRI)8 to examine the CSF dynamics in the eye and ON and to investigate its dependency on central insulin function through pharmacological blockade of insulin receptor using intrathecal S961 administration.Methods
Twenty-nine healthy adult C57BL/6J mice were divided into two groups (Group 1: n=20; Group 2: n=9) and subjected to CE-MRI using a 7-Tesla Bruker BioSpec 7030 system (Figure 1). Polyethylene tubing (inner and outer diameters of 0.28mm and 0.60mm respectively) was surgically implanted intrathecally in the lumbar region (L4-L5) of all mice (Figure 2). All animals received Gd-DTPA (MW=0.9kDa) as the contrast agent. In addition, Group 2 received S961 intrathecally at a dose of 10mg/kg 15 min before MRI. During MRI, mice were maintained with 37±1oC rectal temperature and 1.0%-1.5% isoflurane level. Contrast dynamics was monitored using a 3D T1-weighted FLASH sequence (echo time= 3.3ms, repetition time= 15ms, flip angle= 25o, field-of-view= 30x30x30mm3, and 78x78x78µm3 isotropic resolution). Each FLASH scan lasted 10 min and a total of 12 continuous scans were acquired (i.e. 3 baseline acquisitions followed by 30 min of contrast infusion at 1.6 µl/min via the catheter while the scanning continued until the 12th timepoint). T1-weighted signal intensity changes over time were quantified in 9 regions of interest (ROIs) and compared within and between groups (Figure 3). These ROIs included the posterior ON subarachnoid space (ONSAS-P), posterior ON parenchyma (ONP-P), anterior ON subarachnoid space (ONSAS-A), anterior ON parenchyma (ONP-A), muscle tissue (MT), olfactory bulb (OB), anterior chamber (AC), vitreous, and lens. For both groups, a series of one-way ANOVAs evaluating the change in contrast intensity (% change from baseline) over time was performed (Figure 4).Results
Group 1 showed a significant linear contrast enhancement over time (timepoints: 0, 10, 20, 30, 40, 50, 60, 70, 80 min from initiation of Gd-infusion) in ONSAS-P [F(8,152)=266.234, p<.001, ηp2=.933], ONSAS-A [F(8,152)=417.546, p<.001, ηp2=.956], ONP-P [F(8,152)=390.877, p<.001, ηp2=.954], ONP-A [F(8,152)=88.450, p<.001, ηp2=.825] and AC [F(8,152)=391.544, p<.001, ηp2=.899] (Figure 4). Bonferroni-corrected pairwise comparisons revealed significant increases between each subsequent timepoint (all p’s <.001) until peak intensity (Figure 5) whereby this trend plateaued , and reduced to non-significant levels, with a final significant dip (all p’s<.001).Group 2 showed significant linear contrast enhancement over time (timepoints: 0, 10, 20, 30, 40, 50, 60, 70, 80 min from start of contrast infusion) in ONSAS-P [F(8,104)=217.233, p<.001, ηp2=.833], and ONSAS-A [F(8,104)= 195.124, p<.001, ηp2=.788] (Figure 4). Bonferroni-corrected pairwise comparisons revealed significant increases between each subsequent timepoint in ONSAS-P and ONSAS-A (all p’s <.001) until peak intensity (Figure 5) while this trend was not observed in ONP-P, ONP-A, or AC. A two-way mixed ANOVA between groups (with repeated measures on maximum value) in each ROI showed a significant main effect of region, F(17,119)=35.68, p<.001, ηp2=.913 (Greenhouse-Geisser corrected), a significant main effect of group contrast, F(7,119)=5.847, p<.001, ηp2=.853, and a significant interaction effect of region+group, F(3.967,8.498)=51.848, p<.001, ηp2=.805. Pairwise comparisons showed that both Gd-DTPA and S961+Gd-DTPA groups significantly varied from one another (all p’s<.001), and all ROIs varied from one another (all p’s<.001), with the exceptions of ONSAS-P, ONP-P, ONP-A, MT, vitreous and lens (all p’s=1).
Discussion and Conclusions
Our results of altered CSF dynamics in the ON suggest a possible role of central insulin function on the physiology and homeostasis along the visual pathways. We also observed altered flow of CSF components into the AC of the eye upon CNS-IR. Taken together, these results suggest insulin function as a possible modulator of the glymphatic system in the eye and the ON with CNS-IR as a possible factor for glymphatic dysfunction and consequent neurodegeneration. These findings may open up new areas of research understanding neurodegenerative disorders of the visual system in the context of insulin resistance and glymphatic malfunction.Acknowledgements
This work was supported in part by the National Institutes of Health R01-EY028125, P30-CA016087 and P41-EB017183 (Bethesda, Maryland); BrightFocus Foundation G2019103 (Clarksburg, Maryland); Feldstein Medical Foundation Research Grant (Clifton, New Jersey); Research to Prevent Blindness/Stavros Niarchos Foundation International Research Collaborators Award (New York, New York); and an unrestricted grant from Research to Prevent Blindness to NYU Langone Health Department of Ophthalmology (New York, New York).
References
1. Iliff, J.J., et al., A paravascular pathway facilitates CSF flow through the brain parenchyma and the clearance of interstitial solutes, including amyloid beta. Sci Transl Med, 2012. 4(147): p. 147ra111.
2. Faiq, M.A., et al., Brain: The Potential Diagnostic and Therapeutic Target for Glaucoma. CNS Neurol Disord Drug Targets, 2016. 15(7): p. 839-44.
3. Chen, L., Ocular lymphatics: state-of-the-art review. Lymphology, 2009. 42(2): p. 66-76.
4. Mathieu, E., et al., Evidence for Cerebrospinal Fluid Entry Into the Optic Nerve via a Glymphatic Pathway. Invest Ophthalmol Vis Sci, 2017. 58(11): p. 4784-4791.
5. Wang, X., et al., An ocular glymphatic clearance system removes beta-amyloid from the rodent eye. Sci Transl Med, 2020. 12(536).
6. Deng, W., et al., Quantitative imaging of the clearance systems in the eye and the brain. Quant Imaging Med Surg, 2020. 10(1): p. 1-14.
7. Westwood, S., et al., The influence of insulin resistance on cerebrospinal fluid and plasma biomarkers of Alzheimer's pathology. Alzheimers Res Ther, 2017. 9(1): p. 31.
8. Iliff, J.J., et al., Brain-wide pathway for waste clearance captured by contrast-enhanced MRI. J Clin Invest, 2013. 123(3): p. 1299-309.
Figures
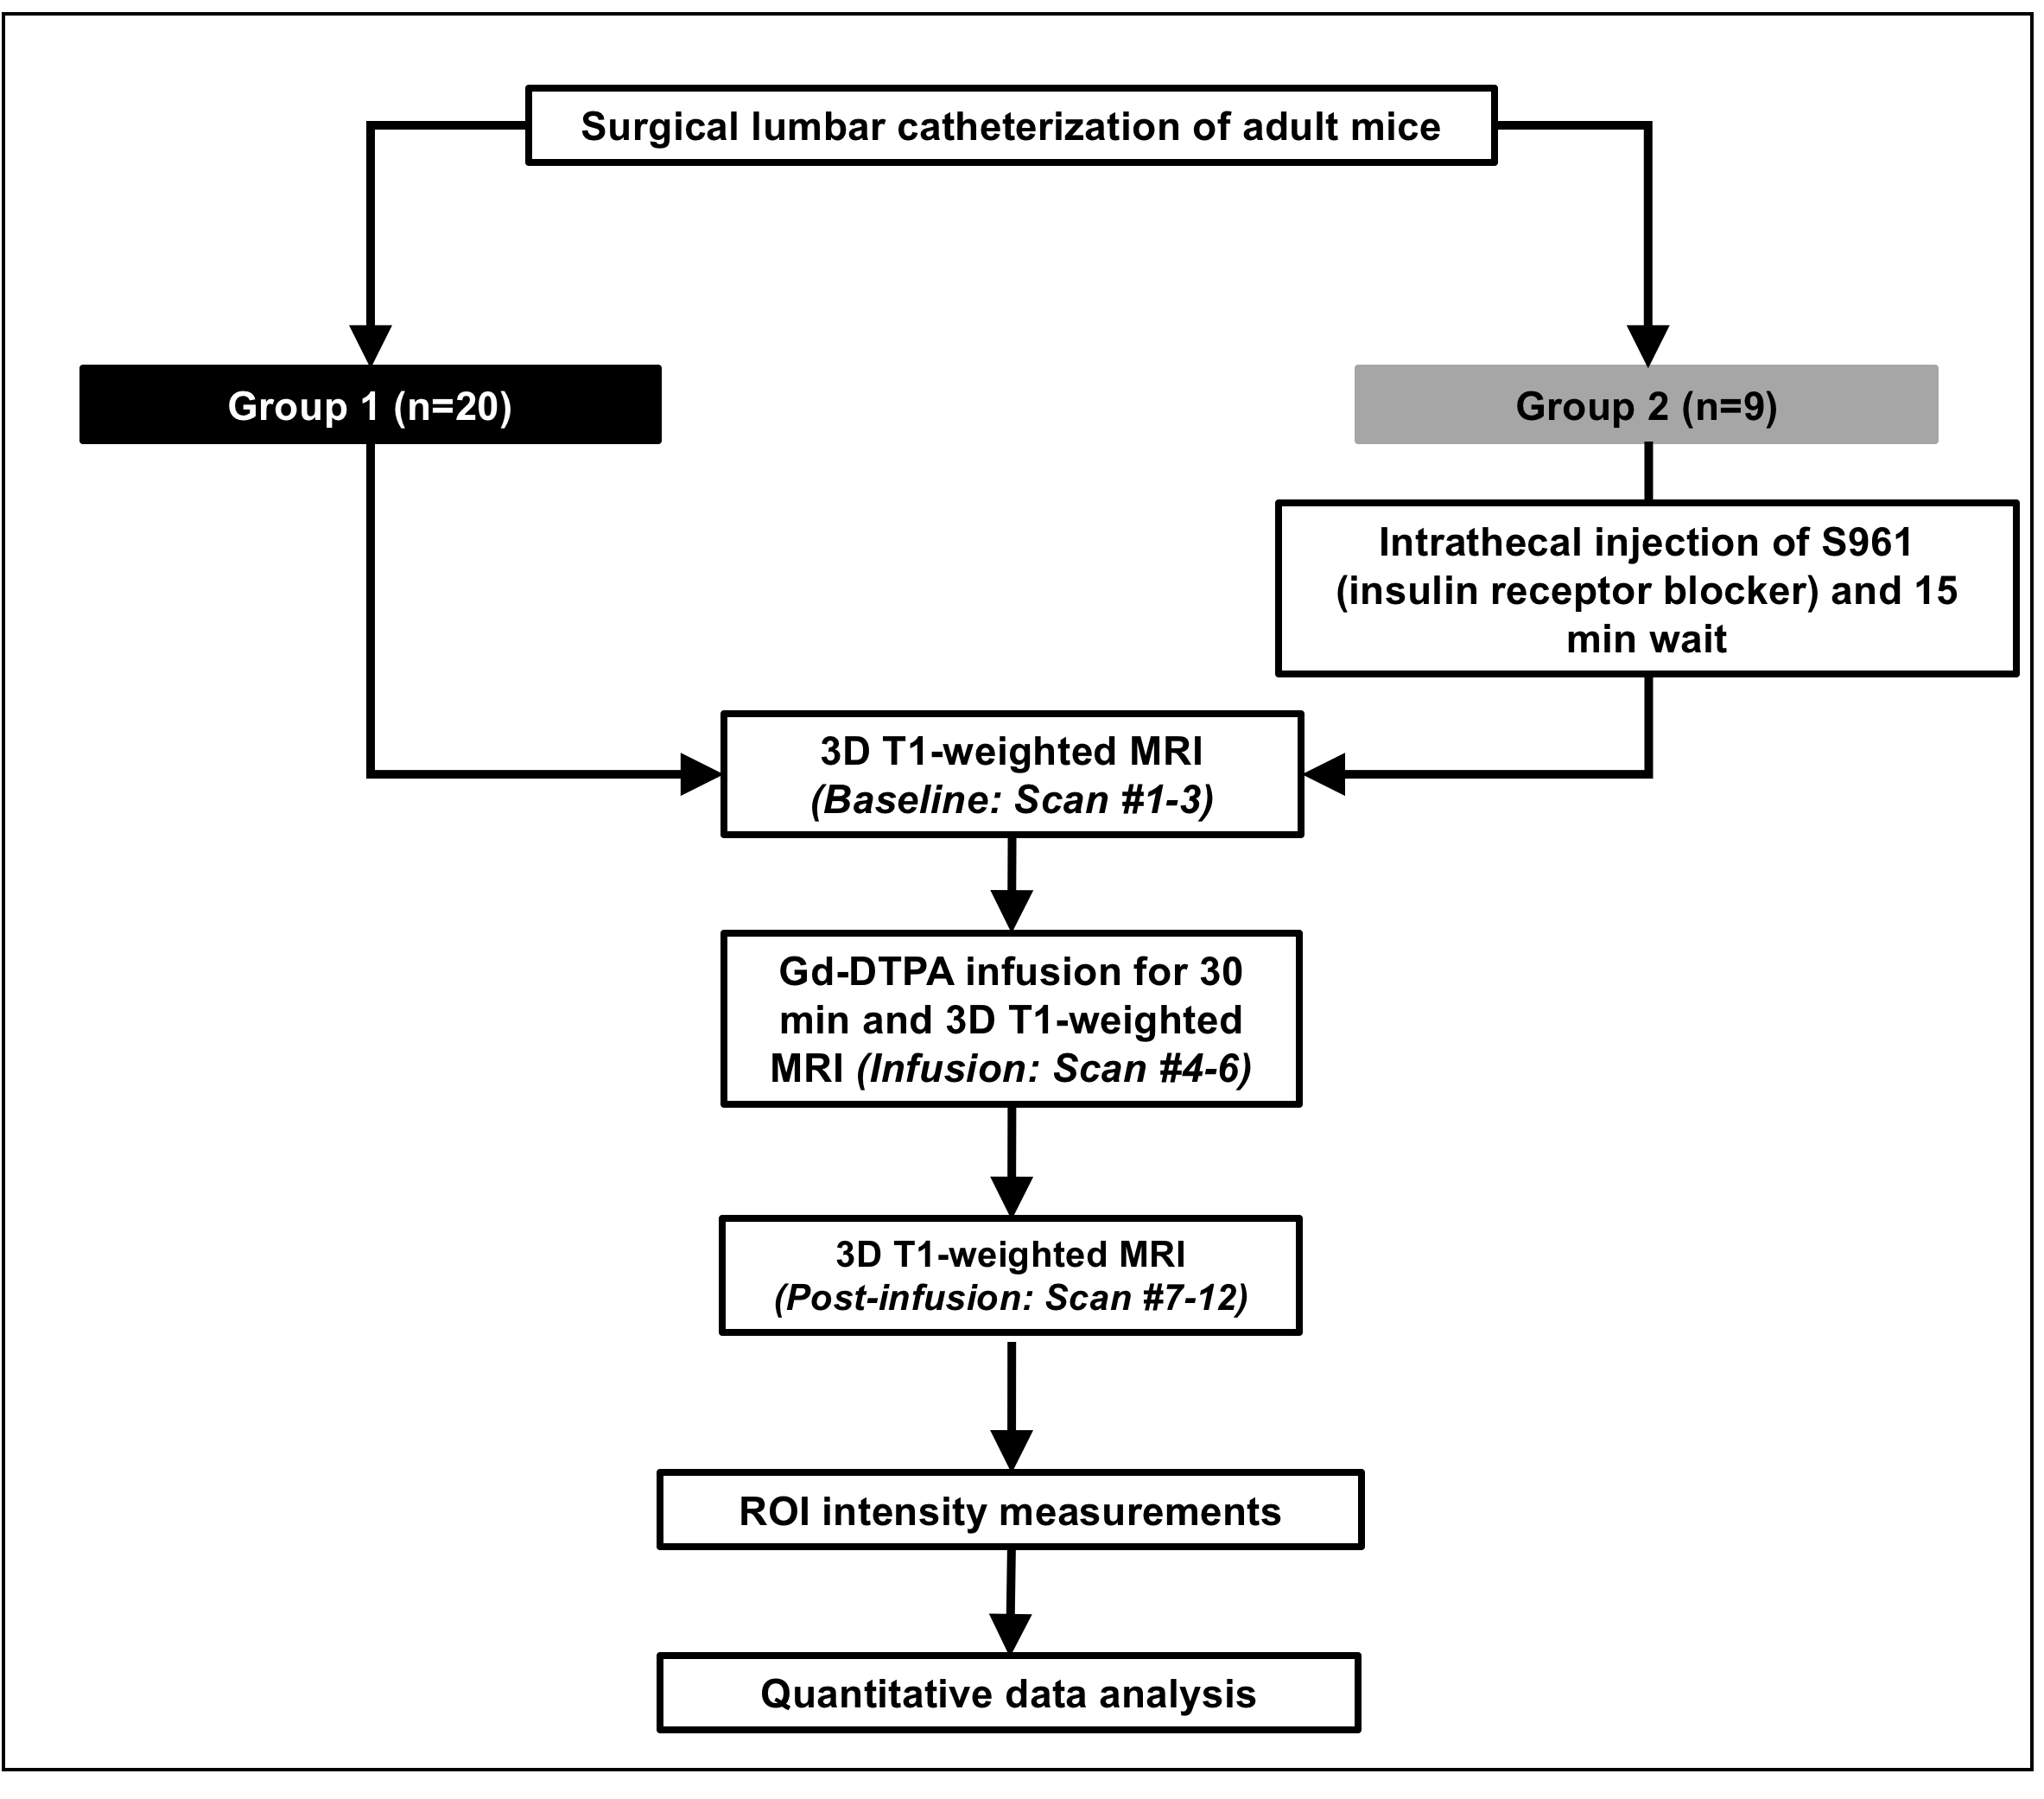
Figure 1: Overall experimental design. Note that each T1-weighted MRI scan lasted 10 min leading to a total scan time of 120 min.
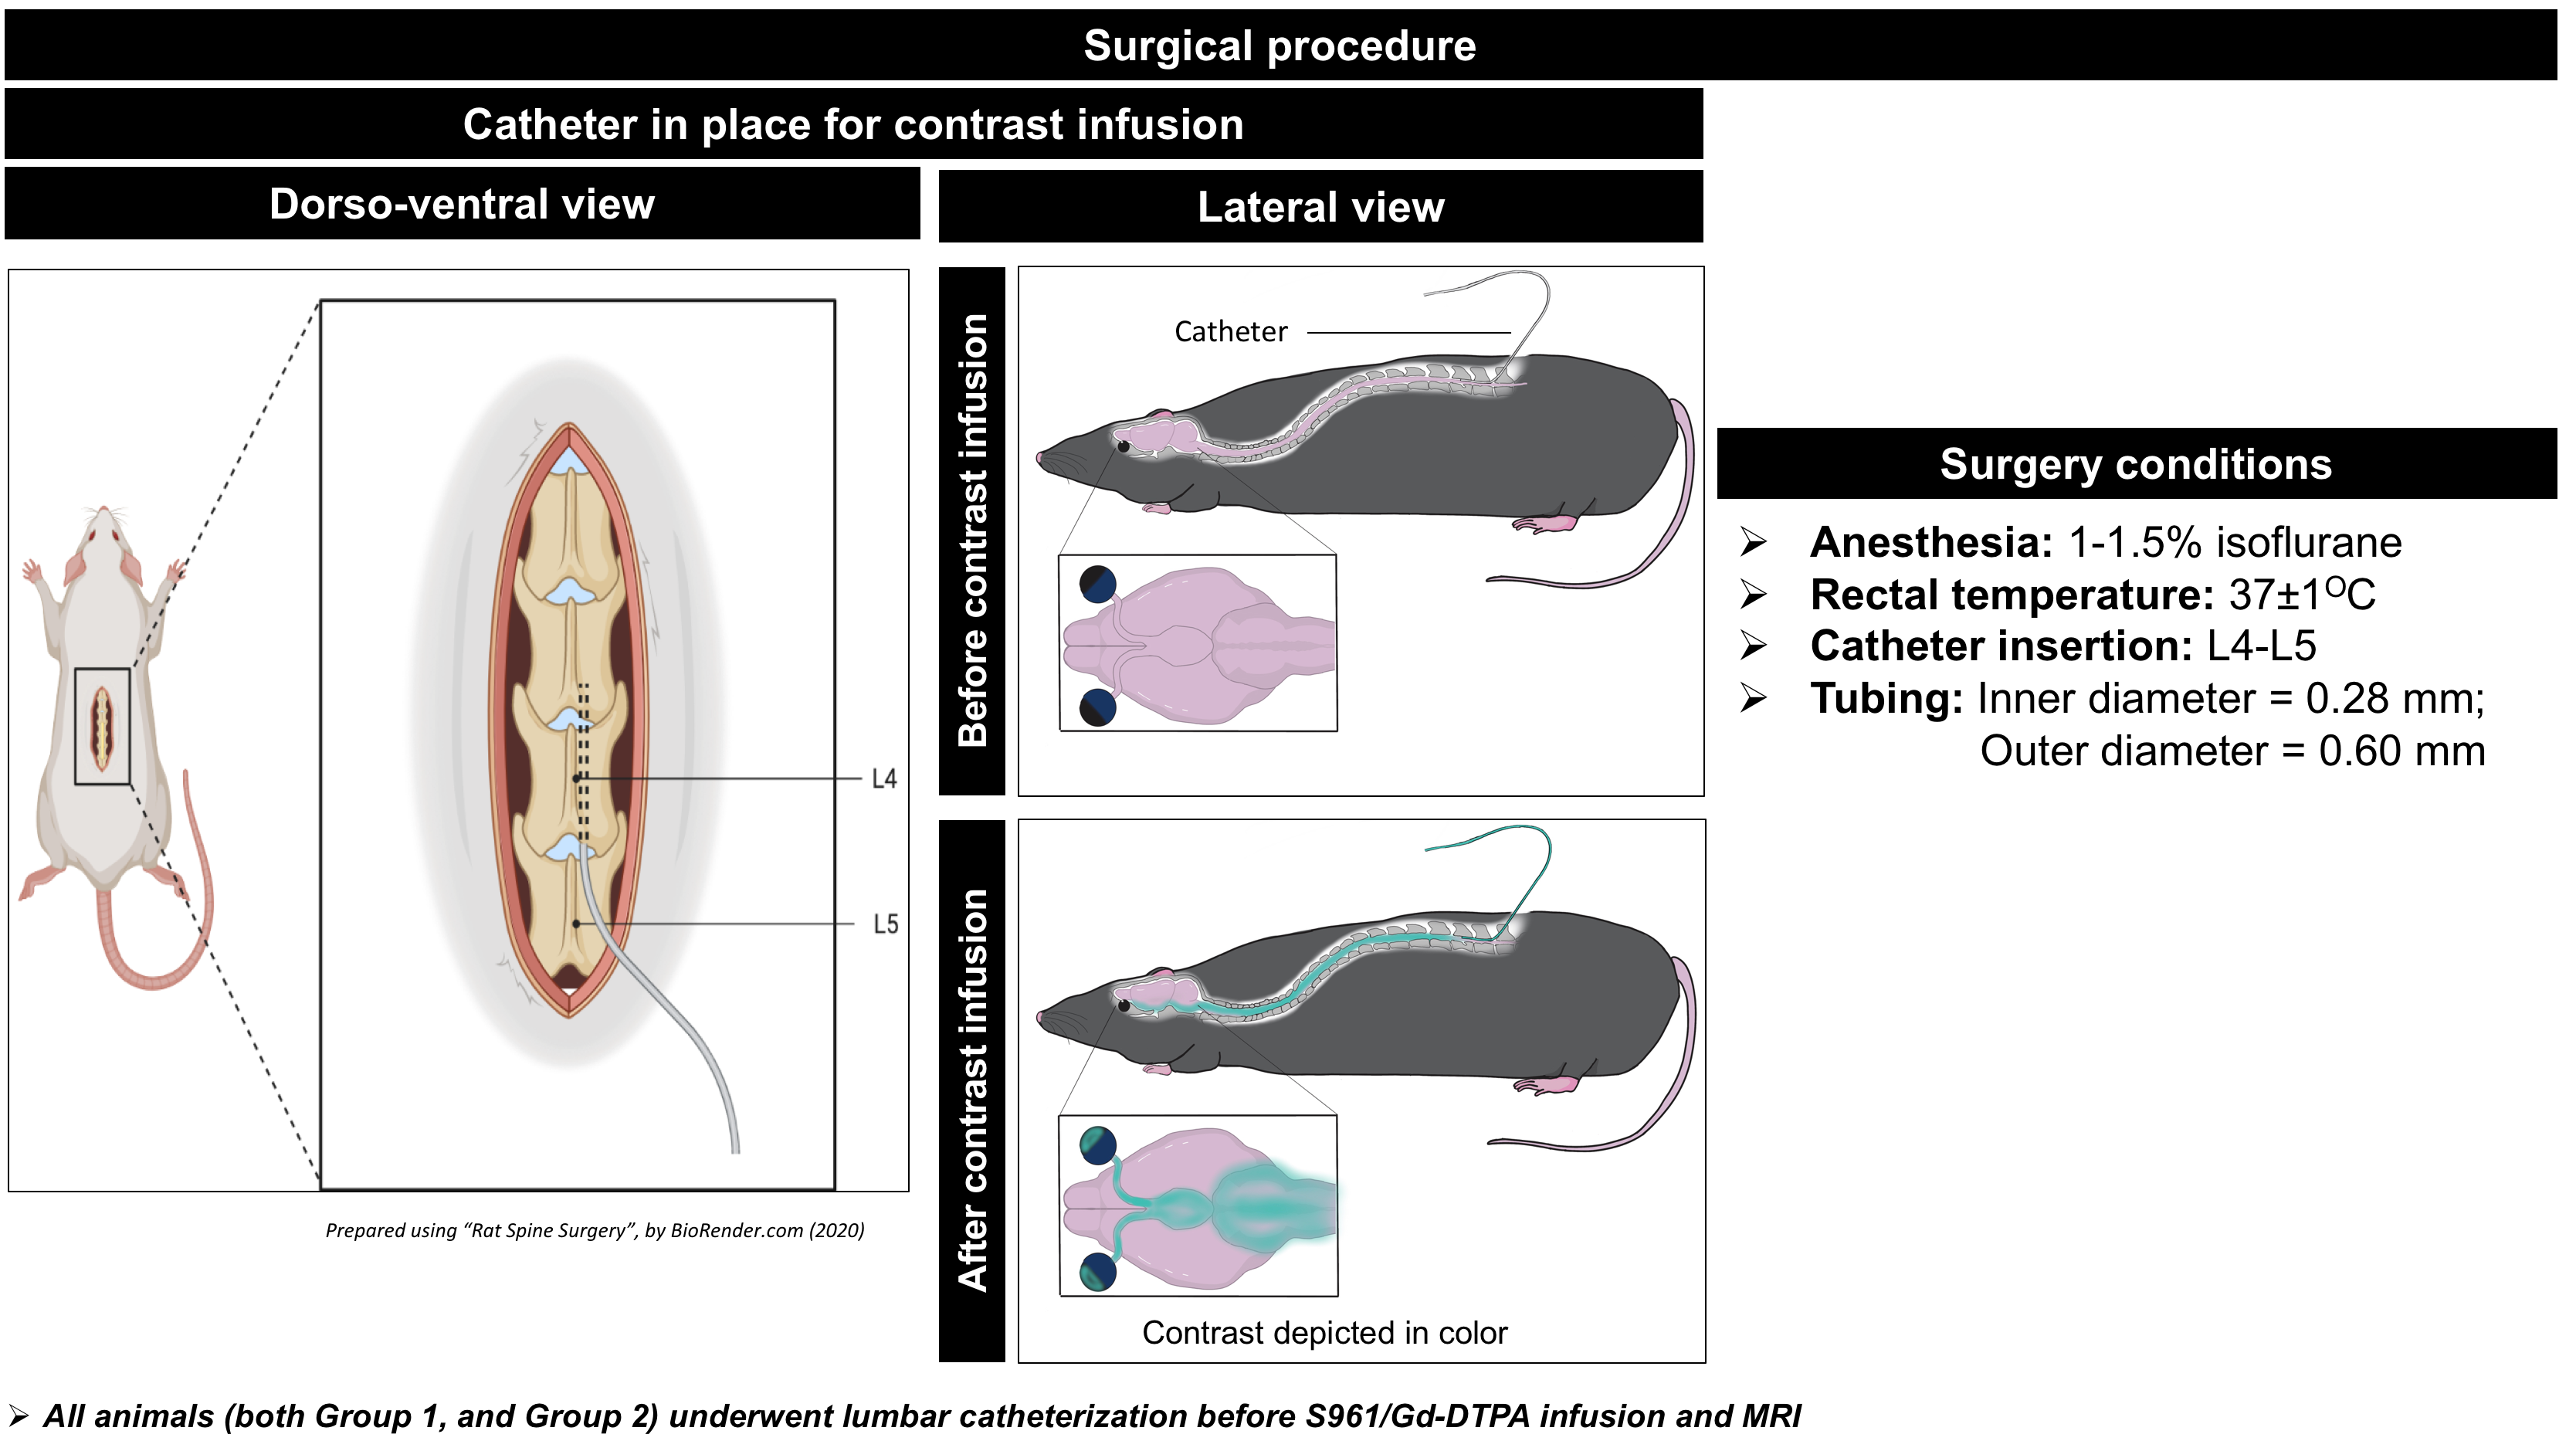
Figure 2: Surgical procedure to infuse S961 or contrast agent (Gd-DTPA) into the lumbar subarachnoid space at a controlled rate (1.6µl/min) enabling us to visualize the movement of CSF in living animals.
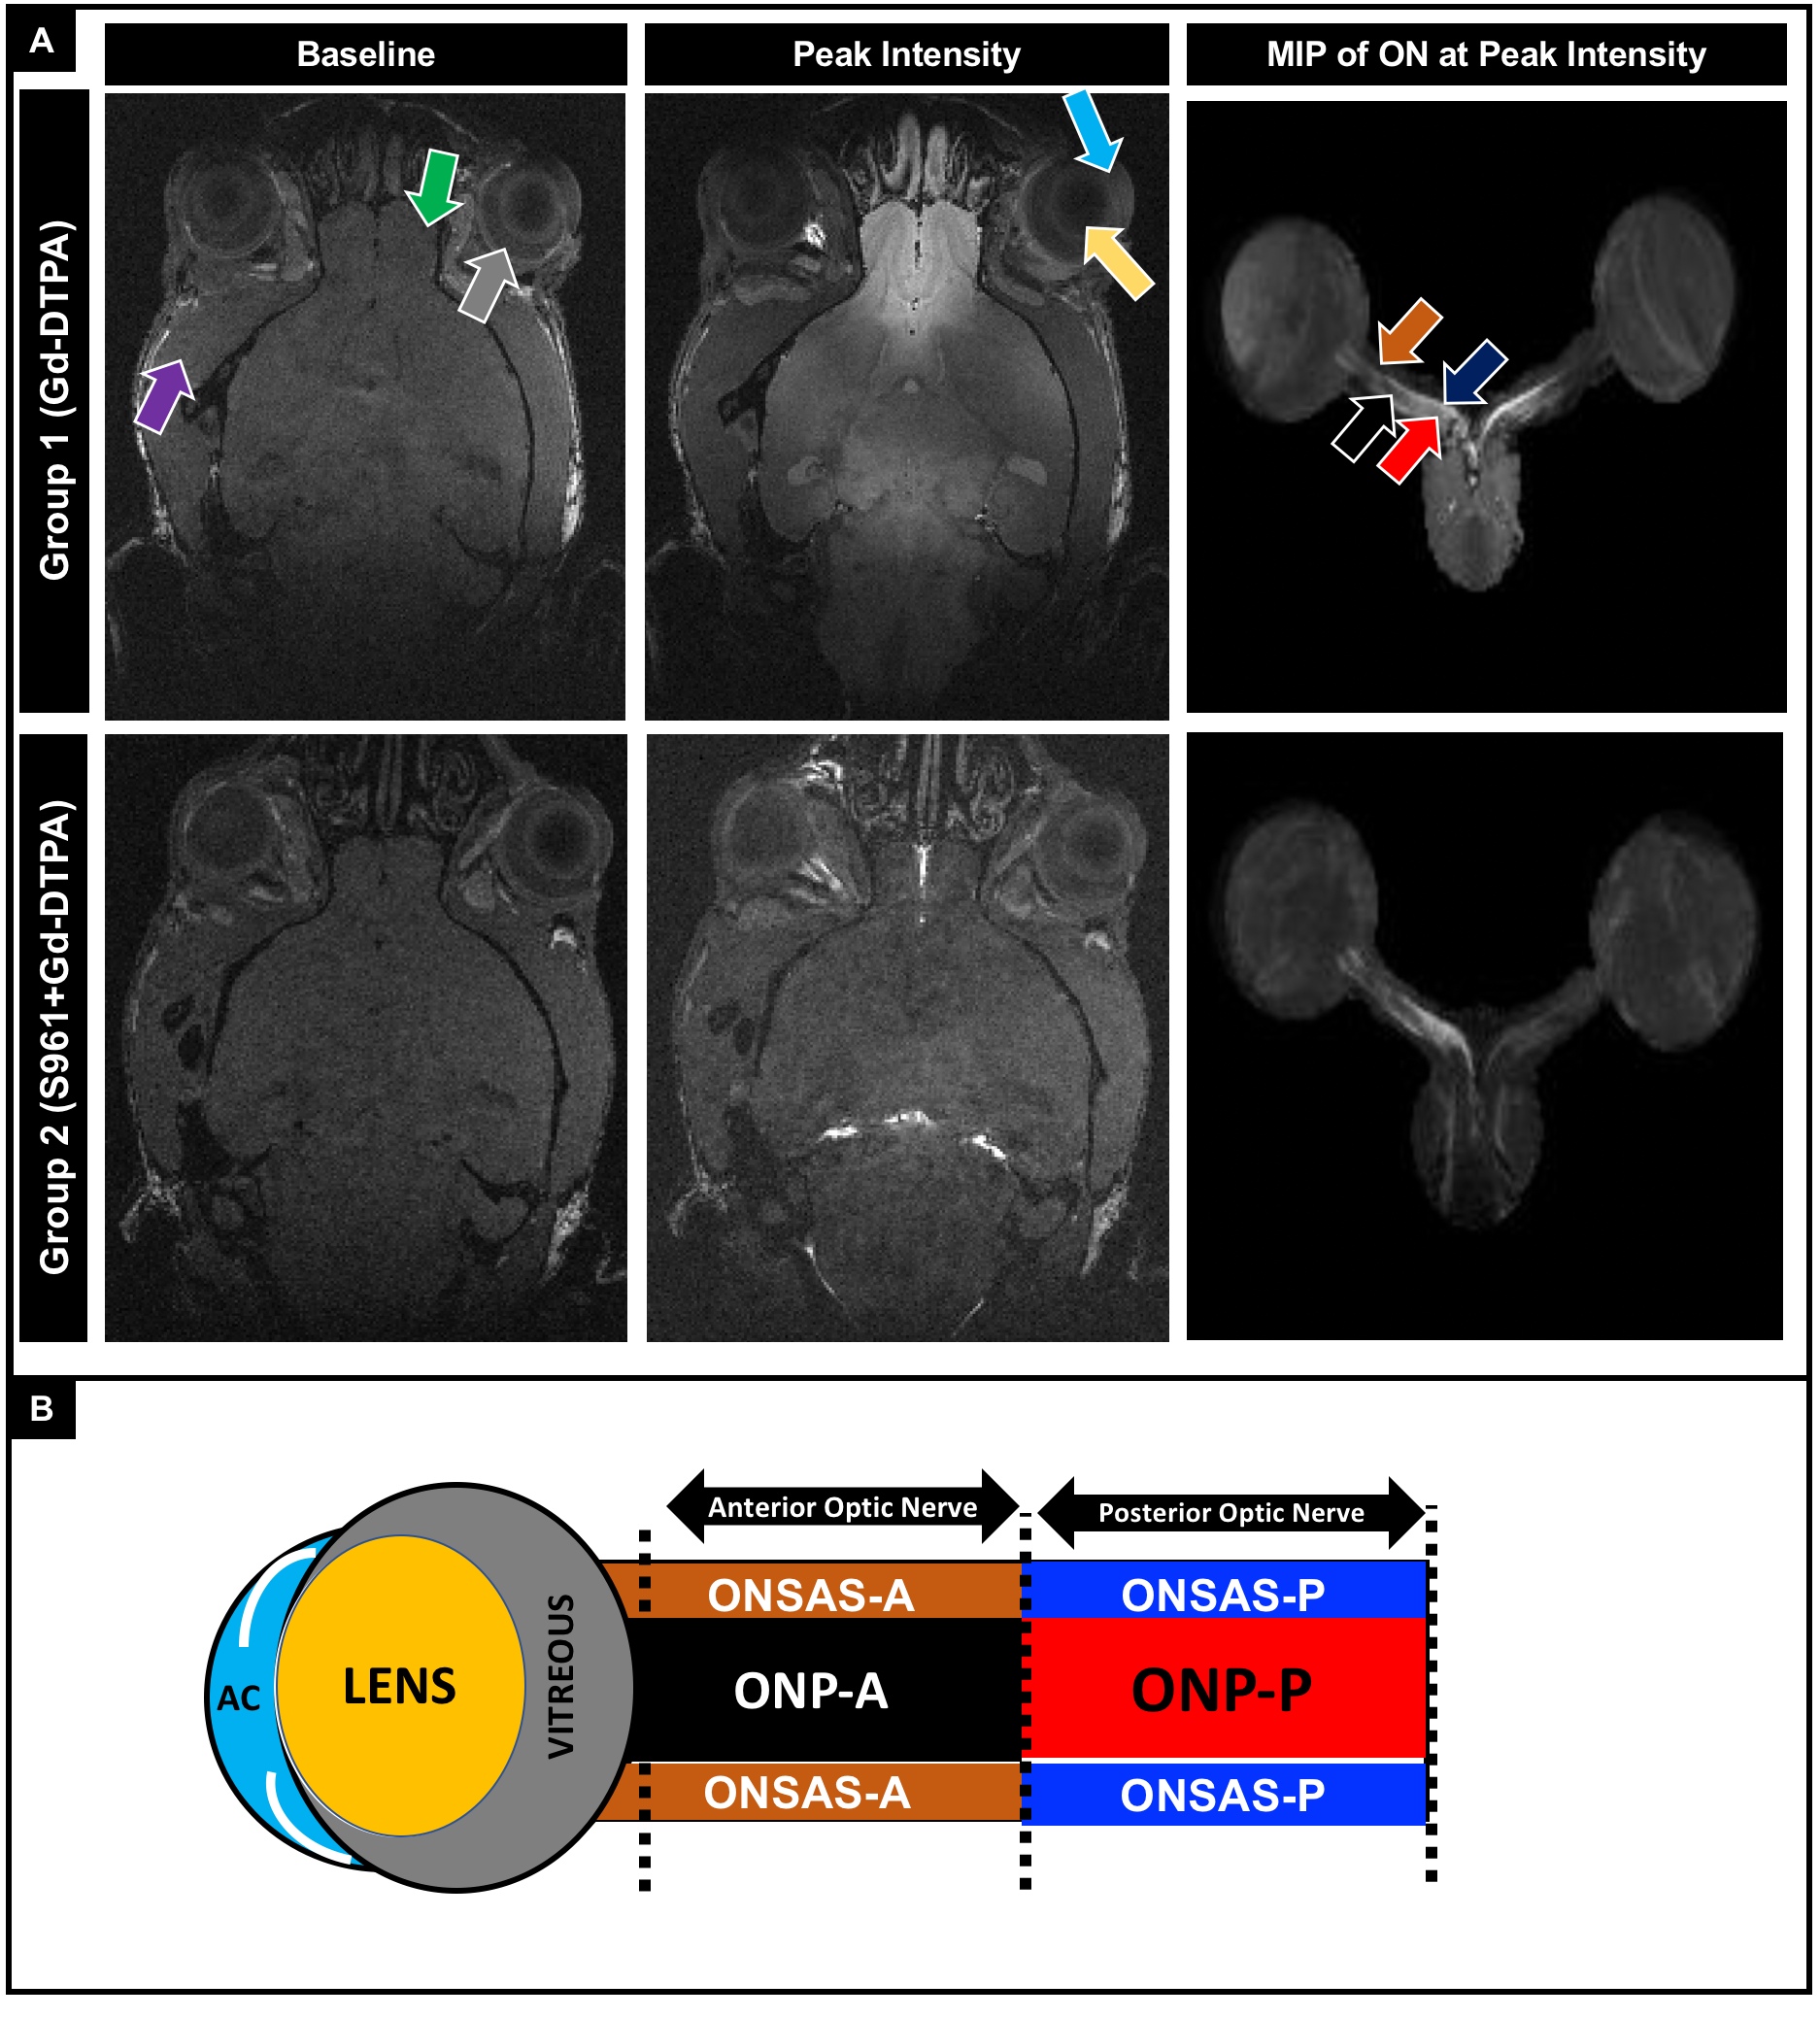
Figure 3: (A) 3D dynamic contrast-enhanced MRI at the level of the eye and optic nerve (ON) before (left column) and at peak intensity (middle column) after Gd-DTPA infusion into the subarachnoid space (SAS) of the lumbar spine. Right column shows the maximum intensity projection (MIP) after segmenting the eye and ON at peak intensity. Arrows in (A) and schematic in (B) indicate the regions of interest for quantitative analysis (ONSAS: optic nerve subarachnoid space; ONP: optic nerve parenchyma; P: posterior; A: anterior; MT: muscle tissue; OB: olfactory bulb; AC: anterior chamber).
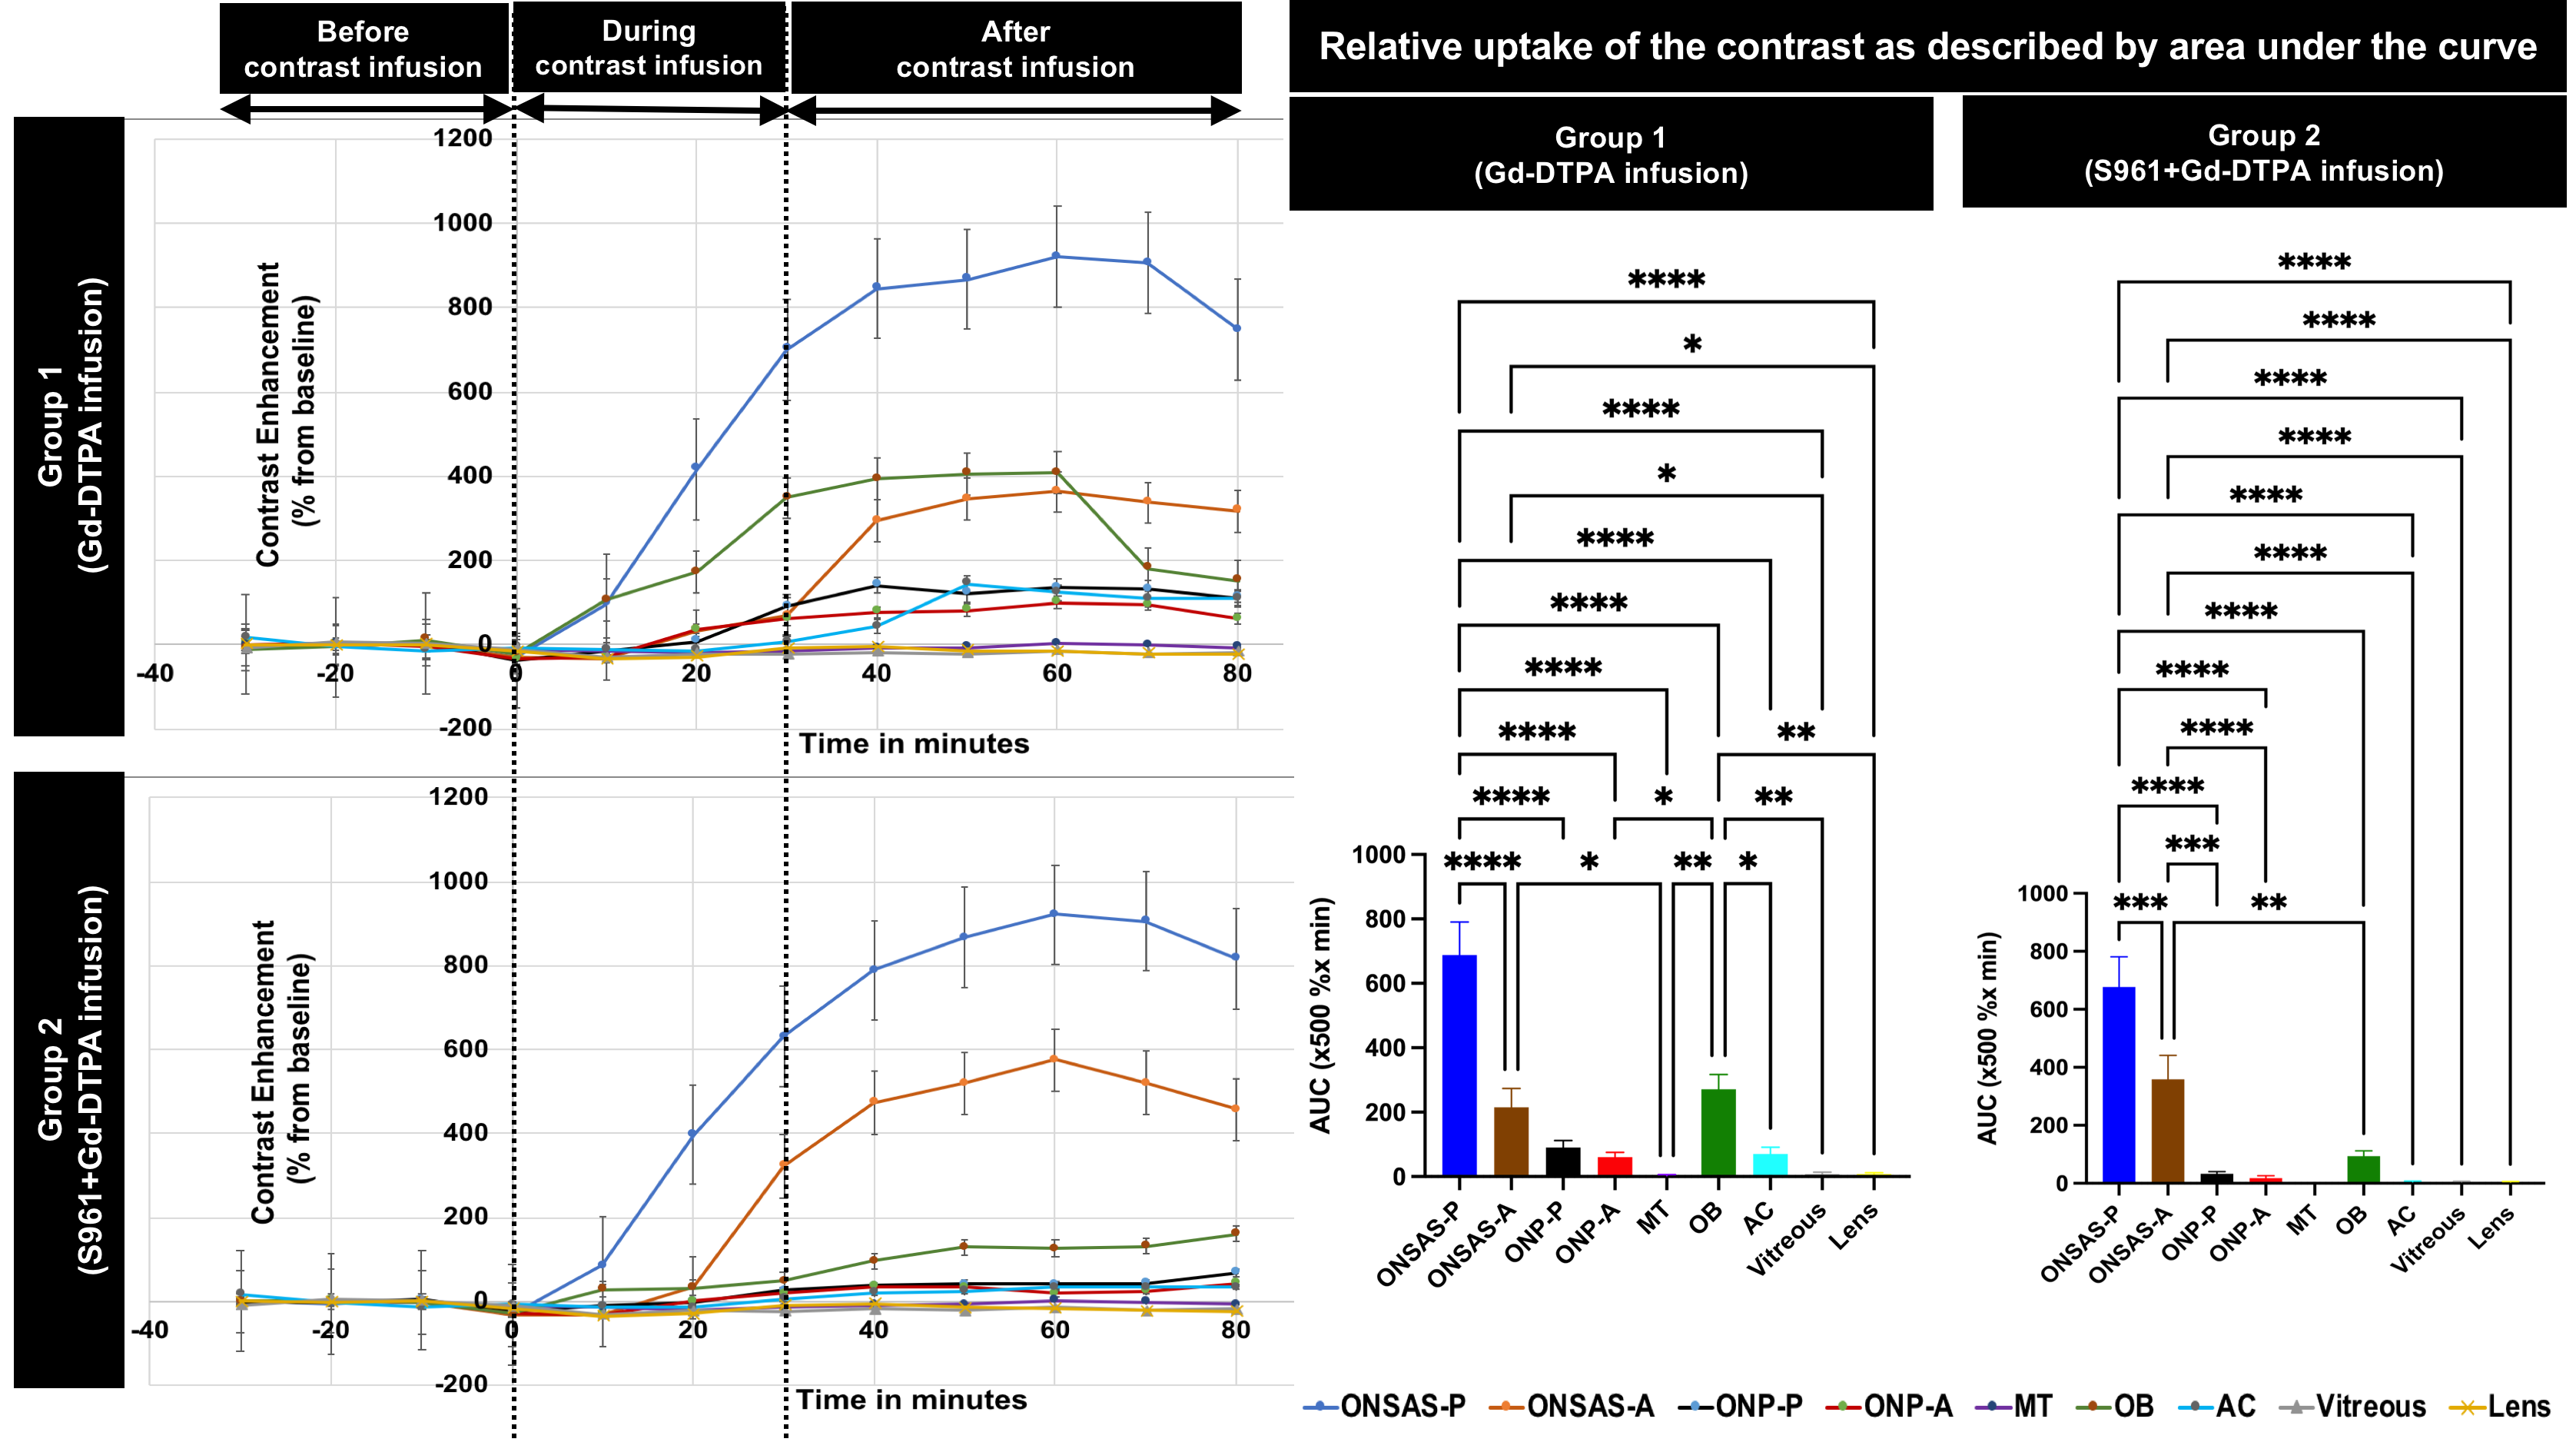
Figure 4: (Left) Temporal evolution of signal enhancement in the posterior optic nerve subarachnoid space (ONSAS-P), anterior ONSAS (ONSAS-A), posterior ON parenchyma (ONP-P), anterior ON parenchyma (ONP-A), muscle tissue (MT), olfactory bulb (OB), anterior chamber (AC), vitreous and lens before and after Gd-DTPA contrast infusion into SAS of the lumbar spine at timepoint zero. (Right) Relative contrast uptake in different regions of interest using area under curve (AUC). **p<0.01, ***p<0.001, ****p<0.0001.
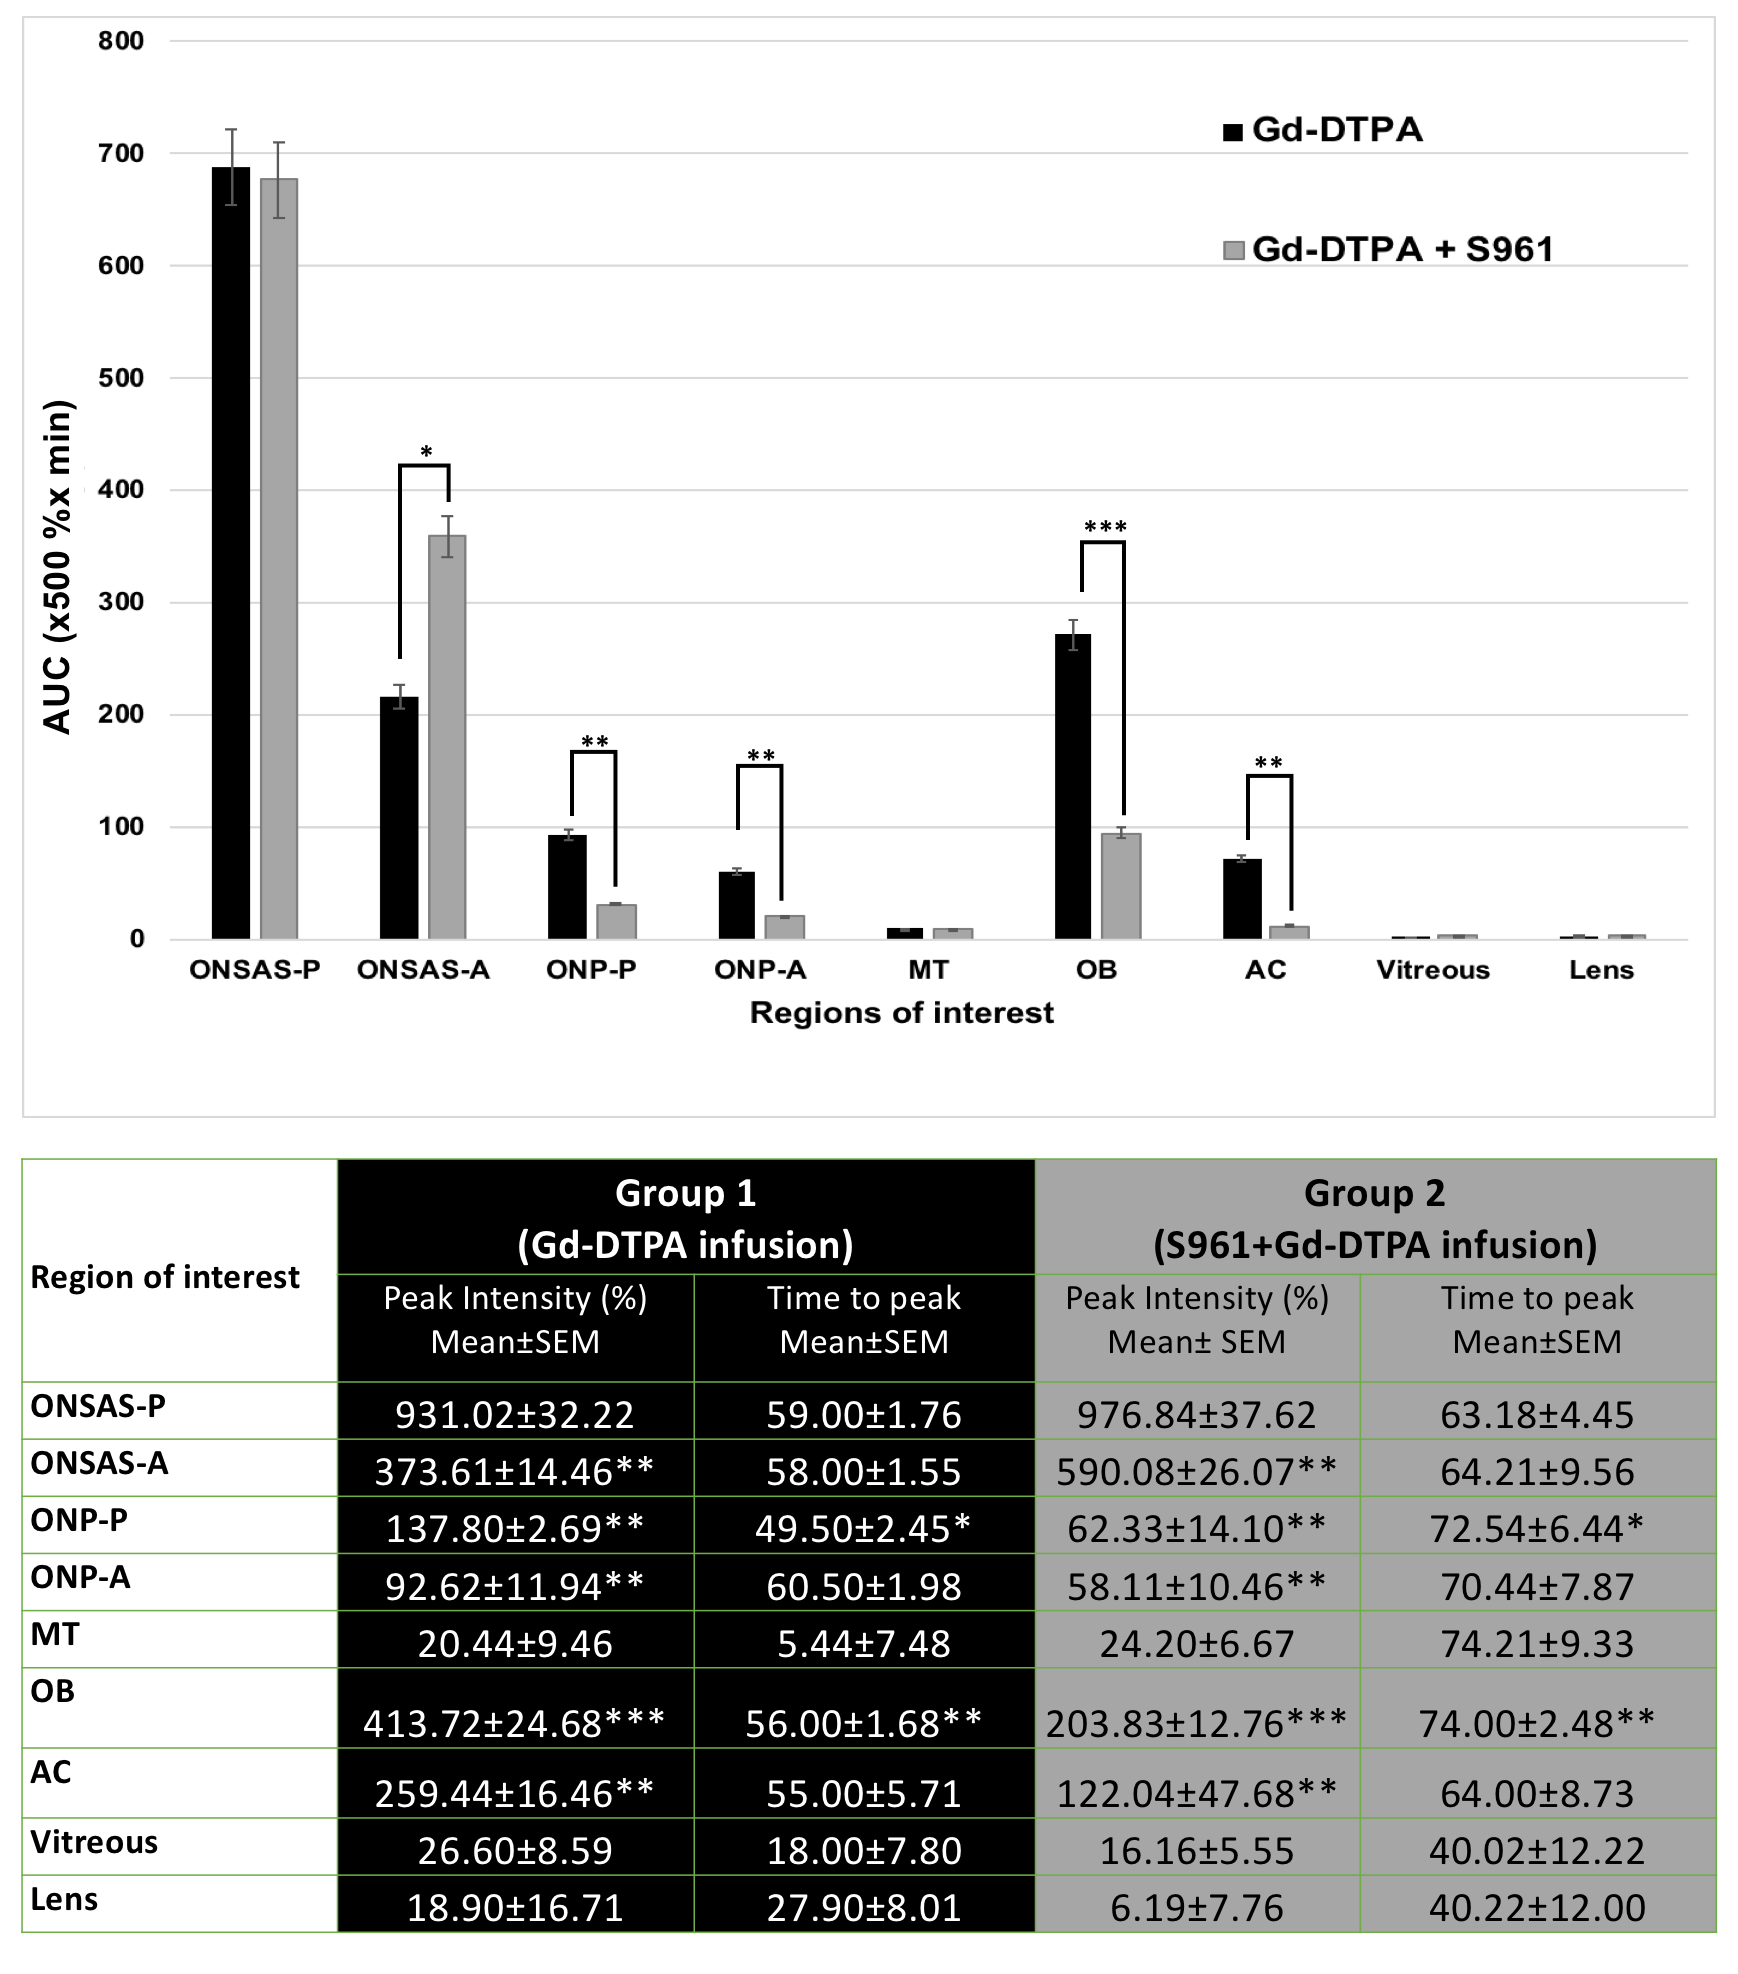
Figure 5: (Top) Graph shows a comparison of the relative contrast (Gd-DTPA) uptake (x500 %x min) by various regions of interest (ROIs). (Bottom) Table displays peak intensity (in % from baseline) and time to peak (in min) of contrast enhancement from the start of Gd-DTPA infusion in different ROIs. Group 1 vs Group 2: **p<0.01, ***p<0.001.