4378
Cerebral Blood Flow Autoregulation is a Major Contributor to Flow Dynamics of Cerebrospinal Fluid1AMRI, LFMI, NINDS, National Institutes of Health, Bethesda, MD, United States
Synopsis
In addition to the well-established origin in cardiac and respiratory cycles, CSF pulsations may also result from the much slower variations in vascular tone associated with cerebral blood flow (CBF) autoregulation. Using a novel quantitative MRI approach, we measured CSF flow velocities and displaced volumes resulting from these three mechanisms in 12 healthy human controls. We found the autoregulatory effects to be a major factor, with associated CSF velocities comparable to and displaced volumes an order of magnitude larger than the cardio-respiratory effects. This may be an important mechanism underlying the CSF oscillations recently observed in resting-state fMRI.
Introduction
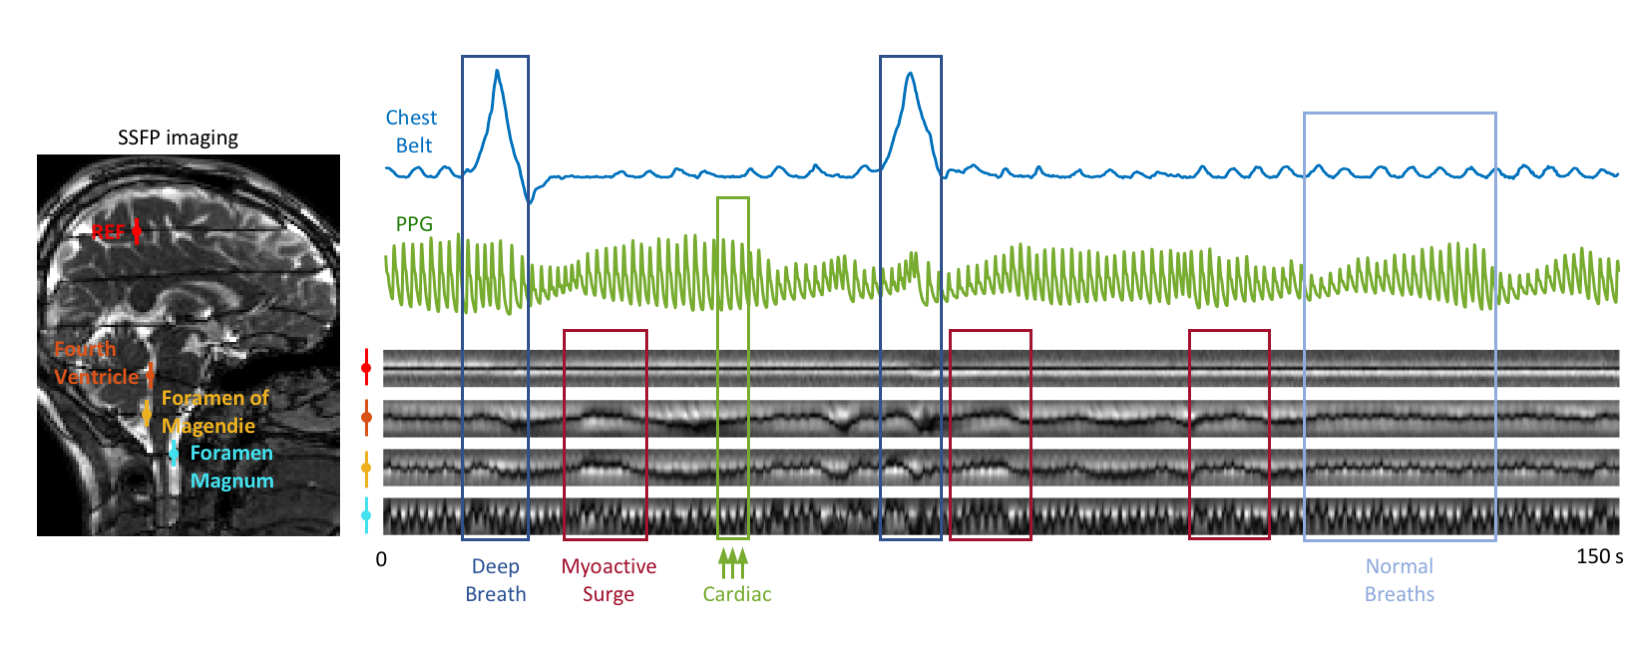
CSF flow dynamics are thought to be driven by cerebral blood flow (CBF) changes resulting from arterial and venous blood pressure changes with cardiac and respiratory cycles (1–5), herein referred to as “barogenic flow”. Recent studies report low-frequency (0.01~0.1 Hz) oscillations of CSF flow during resting-state fMRI (6,7) and their increases in intensity during light sleep (8). We demonstrated that the low-frequency CSF flow is associated with CBF autoregulation (9), effectuated by a myoactive mechanism, i.e. the action of cerebrovascular smooth muscle cells. However, the relative strength of the myoactive mechanism compared to the barogenic effects has not yet been established.To study those various contributions to CSF flow, we implemented a recently proposed tagging method that combines steady-state-free-precession (SSFP) with a background magnetic field gradient (10). We observed that following deep inspirations, the bands manifested not only barogenic but also myoactive flow at delays consistent with CBF autoregulation (11–13) (Figure 1). We developed a dictionary-based method to translate the observed band change patterns to CSF flow velocities, and quantified the different flow effects for each physiological mechanism.
Methods
MRI 12 healthy volunteers were scanned in a 3 T Prisma using a 64-channel receive array (Siemens Healthineers, Erlangen, Germany). Single slice SSFP was acquired covering the mid-sagittal plane, combined with a background z-gradient creating equidistant dark bands ~23 mm apart. SSFP parameters: TR 6 ms, TE 3 ms, FA 45°, SENSE 3, FOV 240×204 mm2, resolution 1.3×1.7 mm2, slice TR 246 ms. BOLD EPI was also acquired on a stack of 25 axial slices parallel to the AC-PC line using TR 2 s, TE 35 ms, FA 70°, slice thickness 2.5 mm, FOV 240×180 mm2, isotropic in-plane resolution of 1.5 mm. EPI data from two subjects were excluded from the analysis due to excessive motion or incompliance to task. 3D T1-MPRAGE was acquired as an anatomical reference.Experimental paradigm Subjects were instructed to take a deep breath every 50 s, skipping every 3rd one. The deep breaths were visually guided to have 4 s inspiration and 4 s expiration. The entire run was 7.5 min (6 deep breaths). The respiration signal and photoplethysmography (PPG) were recorded using a chest belt and a finger pulse oximeter respectively, sampled at 2 kHz (Biopac, Goleta, CA, USA).
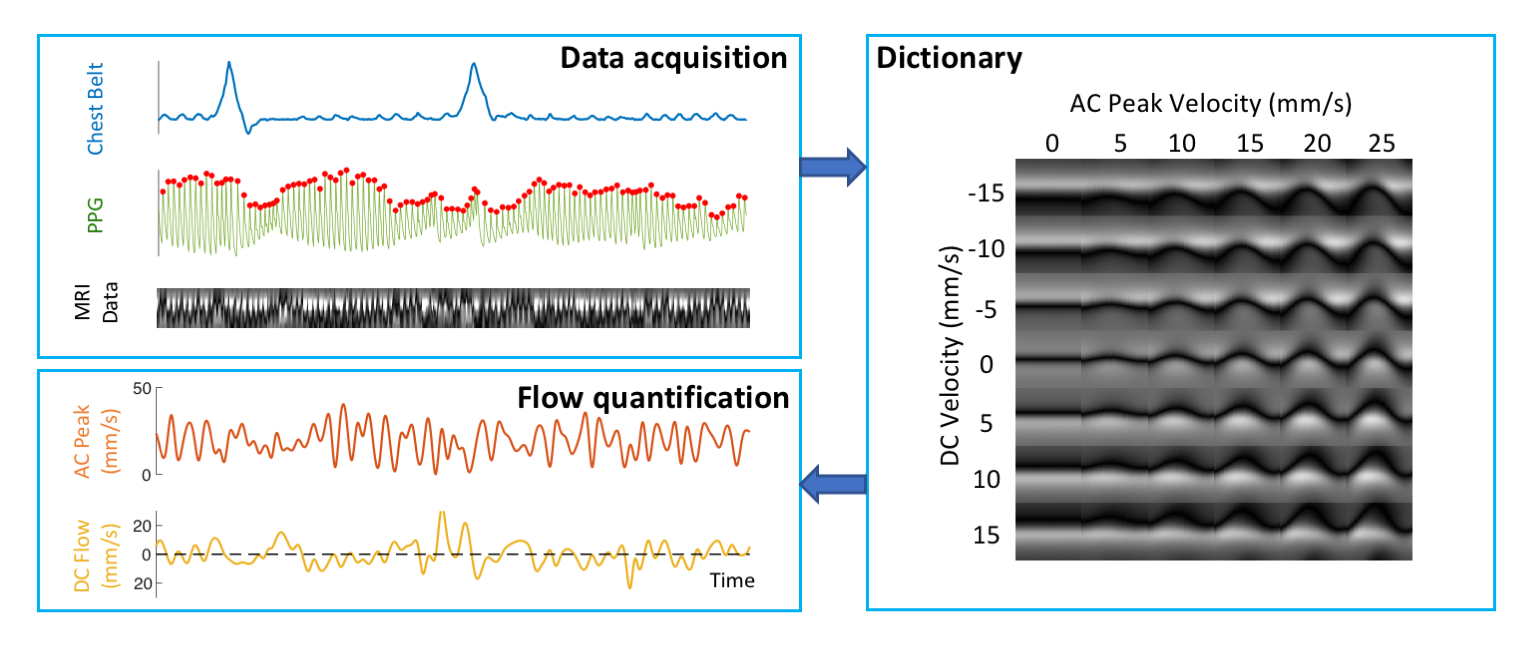
Data pre-processing A dictionary-based method was used to translate the observed spatial-temporal CSF patterns to quantitative velocities (Figure 2). For each cardiac interval, this approach separately estimates the velocities of cardiac flow and other flow of lower frequencies, referred to as “AC” and “DC”, analogous to electrical circuits. BOLD EPI data were pre-processed using AFNI to produce brain images of temporal percent signal changes in Talairach space. CSF voxels from the bottom 4 – 6 slices (in/near the fourth ventricle) were averaged as a qualitative measure of inflow to the cranium (8). All results and physiological signals were interpolated to 0.1 s resolution for further analysis.
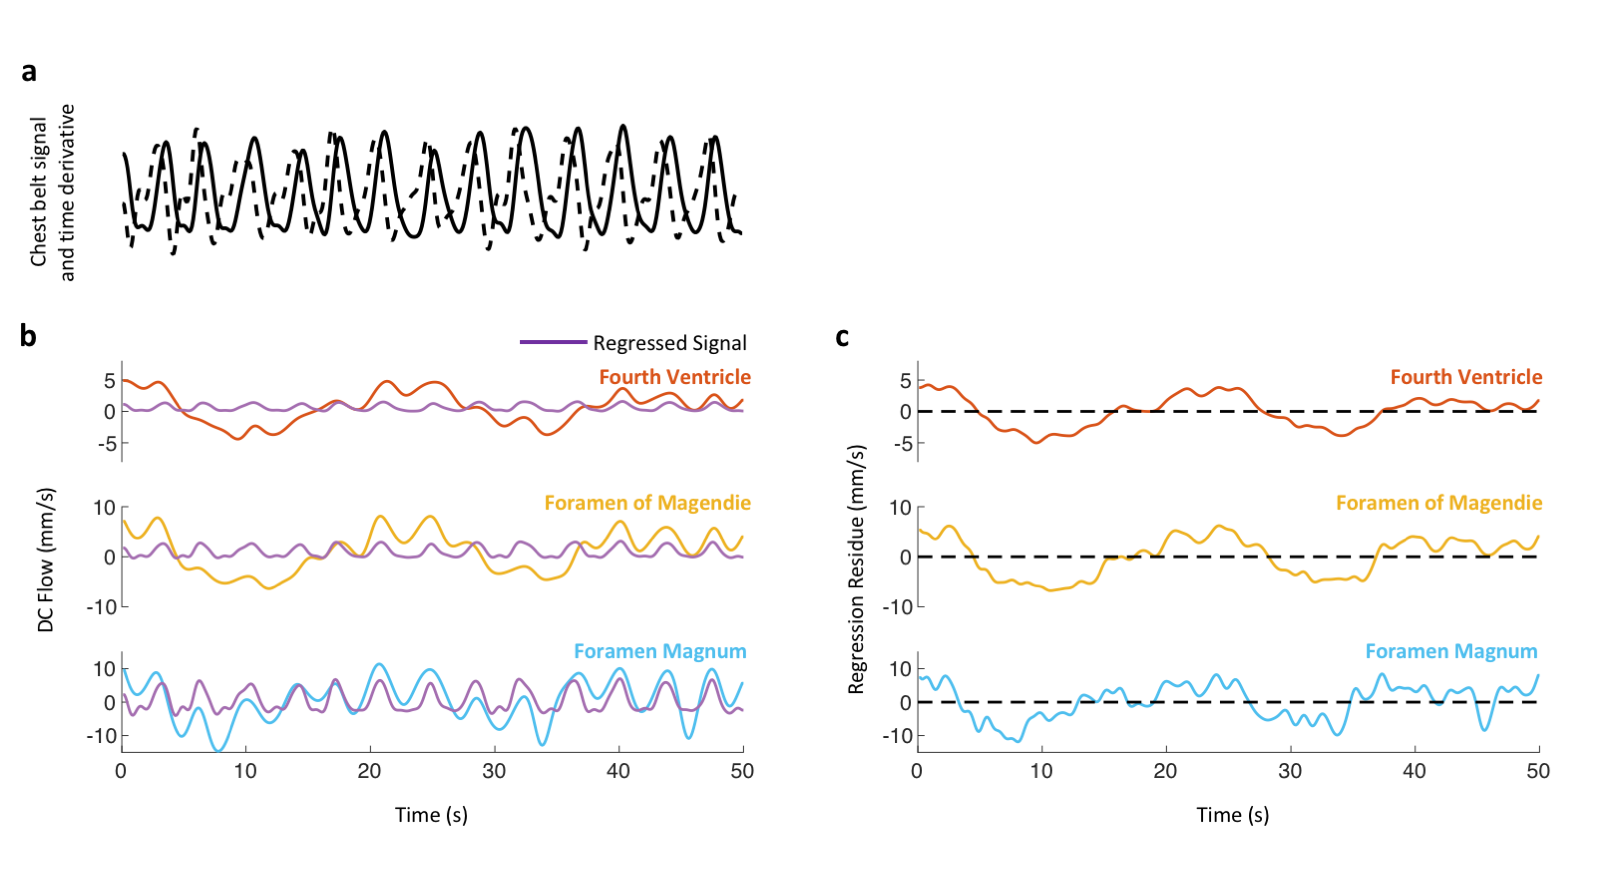
Data analysis Peak velocities of CSF flow associated deep inspiration and myoactive effects were determined by the maximum of DC flow in the intervals of -3 – -1 s and 6 – 16 s respectively, taking the end of inspiration as time 0. Respiratory cycle related flow values was estimated outside deep breaths by regression of resting-state DC data using the chest belt signal and its derivative (Figure 3). Similarly, cardiac flow values were derived from these data segments by averaging the AC data. Correction factors were applied to the velocities to account for laminar flow profiles (0.5 for circular and 0.67 for annular cross-sections), yielding “effective velocities” as shown in Figure 4. Displaced volumes were calculated by integrating the effective velocities assuming sinusoid pulsations (with varied periods for different flow types) and multiplied by the corresponding CSF area measured from T1-MPRAGE.
Results
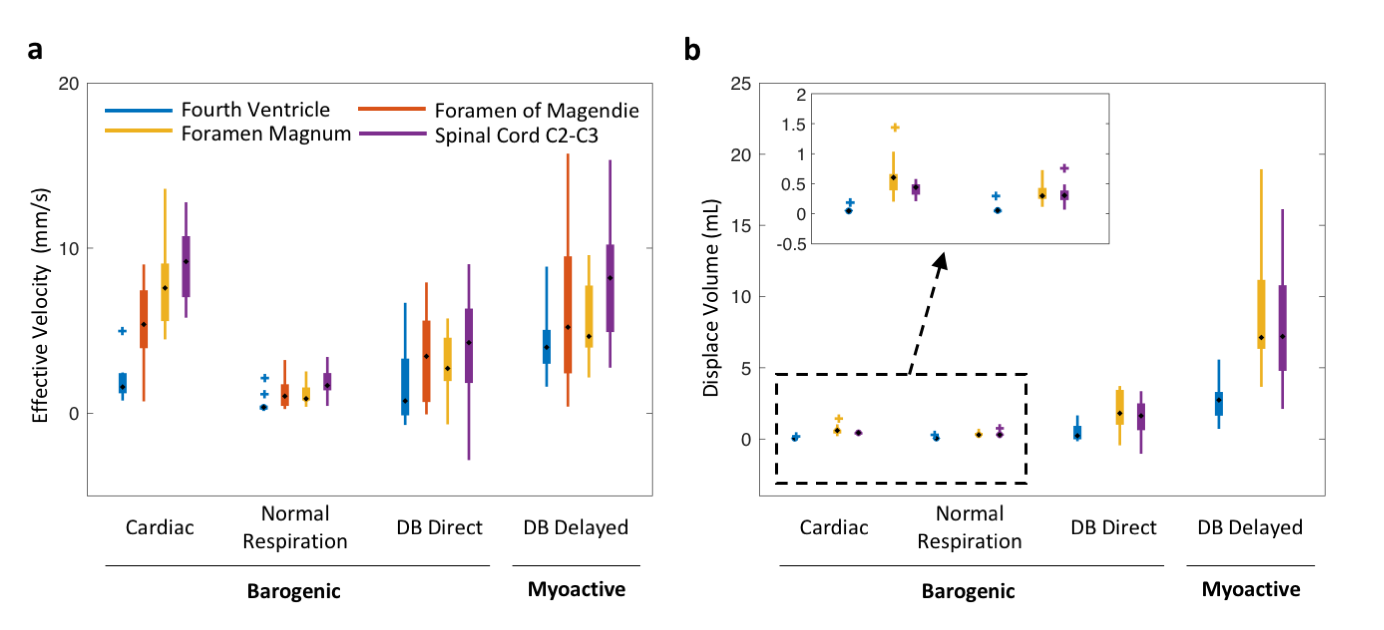
At four locations in the cranium and neck, barogenic flow associated with deep breaths was observed around time 0, and was followed by myoactive flow peaking at around 11 s (range 7.4 – 14.7 s) after the end of the deep inspiration (Figure 4b). This delay was consistent with the CSF inflow signal in EPI (Figure 4c) as well as our previous findings (9). The timing similarity between the myoactive CSF surge and the negative time derivative of the BOLD global signal confirmed its close association with CBF autoregulation (8,9). The myoactive flow exhibited velocities comparable to the cardio-respiratory (barogenic) effects, albeit with less location dependence along the CSF canal (Figure 5a). In contrast, the displaced volume was an order of magnitude larger for the myoactive effect (Figure 5b).Conclusion
Using a novel quantitative MRI measurement approach, we demonstrate that cerebral blood flow autoregulation is a major contributor to CSF flow dynamics with the displaced volume per cycle close to an order of magnitude larger than those of cardio-respiratory effects. While less frequent, the large displacement may be more effective for mixing of the CSF compartments and therefore more relevant for glymphatic waste clearance. Since CBF fluctuations induced by autoregulation are common during wakefulness, and accentuated by arousal punctuations during light sleep, they may be an important mechanism behind the CSF oscillations observed in previous resting-state fMRI studies.Acknowledgements
This study was supported by the intramural program of NINDS, NIH.References
1. Alperin N, Vikingstad EM, Gomez‐Anson B, Levin DN. Hemodynamically independent analysis of cerebrospinal fluid and brain motion observed with dynamic phase contrast MRI. Magn. Reson. Med. 1996;35:741–754.
2. Balédent O, Gondry-Jouet C, Meyer M-E, et al. Relationship Between Cerebrospinal Fluid and Blood Dynamics in Healthy Volunteers and Patients with Communicating Hydrocephalus. Invest. Radiol. 2004;39:45–55.
3. Chen L, Beckett A, Verma A, Feinberg DA. Dynamics of respiratory and cardiac CSF motion revealed with real-time simultaneous multi-slice EPI velocity phase contrast imaging. NeuroImage 2015;122:281–287.
4. Dreha-Kulaczewski S, Joseph AA, Merboldt K-D, Ludwig H-C, Gärtner J, Frahm J. Inspiration Is the Major Regulator of Human CSF Flow. J. Neurosci. 2015;35:2485–2491.
5. Yildiz S, Thyagaraj S, Jin N, et al. Quantifying the influence of respiration and cardiac pulsations on cerebrospinal fluid dynamics using real-time phase-contrast MRI. J. Magn. Reson. Imaging 2017;46:431–439.
6. Attarpour A, Ward J, Chen JJ. Vascular origins of low-frequency oscillations in the cerebrospinal fluid signal in resting-state fMRI: Interpretation using photoplethysmography. Hum. Brain Mapp. 2021;42:2606–2622.
7. Yang H-C (Shawn), Inglis B, Talavage T, et al. Coupling brain cerebrovascular oscillations and CSF flow during wakefulness: An fMRI study. bioRxiv 2021:2021.03.29.437406.
8. Fultz NE, Bonmassar G, Setsompop K, et al. Coupled electrophysiological, hemodynamic, and cerebrospinal fluid oscillations in human sleep. Science 2019;366:628–631.
9. Picchioni D, Özbay PS, Mandelkow H, et al. Autonomic arousals contribute to brain fluid pulsations during sleep. bioRxiv 2021:2021.05.04.442672.
10. Oshio K, Yui M, Shimizu S, Yamada S. Continuously visualizing slow flow using SSFP. In: Proc. Intl. Soc. Mag. Reson. Med. 27, Montréal, 2019, p. 2974. ; 2019.
11. Birn RM, Smith MA, Jones TB, Bandettini PA. The respiration response function: The temporal dynamics of fMRI signal fluctuations related to changes in respiration. NeuroImage 2008;40:644–654.
12. Bright MG, Bulte DP, Jezzard P, Duyn JH. Characterization of regional heterogeneity in cerebrovascular reactivity dynamics using novel hypocapnia task and BOLD fMRI. NeuroImage 2009;48:166–175.
13. Özbay PS, Chang C, Picchioni D, et al. Sympathetic activity contributes to the fMRI signal. Commun. Biol. 2019;2:421.
Figures