4365
Baseline Correction of 1H MRS for Cerebral Glucose Quantification via Detecting H1-α-Glucose Peak at 7 T
Hideto Kuribayashi1, Yuta Urushibata1, Thuy Ha Duy Dinh2, Hirohiko Imai3, Sinyeob Ahn4, Ravi Teja Seethamraju5, Tadashi Isa2, and Tomohisa Okada2
1Siemens Healthcare K.K., Tokyo, Japan, 2Human Brain Research Center, Kyoto University Graduate School of Medicine, Kyoto, Japan, 3Kyoto University Graduate School of Informatics, Kyoto, Japan, 4Siemens Medical Solutions, Berkeley, CA, United States, 5Siemens Medical Solutions, Boston, MA, United States
1Siemens Healthcare K.K., Tokyo, Japan, 2Human Brain Research Center, Kyoto University Graduate School of Medicine, Kyoto, Japan, 3Kyoto University Graduate School of Informatics, Kyoto, Japan, 4Siemens Medical Solutions, Berkeley, CA, United States, 5Siemens Medical Solutions, Boston, MA, United States
Synopsis
Glucose concentrations at posterior cingulate cortex in 20 young healthy subjects were quantitated via detecting H1-α-glucose peak at 5.23 ppm in 1H MRS at 7T. The spectra were analyzed using LCModel with data excluding a range of the residual water peak using PPMGAP parameter, which simply corrected baselines around the H1-α-glucose peak distorted from the tail of the residual water peak. The mean glucose concentration was estimated to be 1.0 mM via both sequences. Cramer-Rao lower bounds of fitting H1-α-glucose peak were significantly smaller in the semi-LASER (mean: 33.1 %) than those in the short-TE STEAM (49.8 %).
INTRODUCTION
Cerebral glucose has been measured using 1H MRS. The glucose peaks in the range of 3-4 ppm are analyzed using spectral analysis software like LCModel. To fit such weak peaks overlapped with other high-concentrated metabolite peaks, the prior knowledge about an intensity ratio to others (e.g., three big methyl peaks) is usually required. Even if the glucose peaks are fitted, it is difficult for glucose and taurine to quantitate separately due to the spectral pattern similarity.1H1-α-glucose peak at 5.23 ppm has also been measured at 4T2-3 and 7T4-5 which overcome the low sensitivity. Because the H1-α-glucose peak is free of spectral overlap, the detection of the H1-α-glucose has a potential of the accurate quantification of cerebral glucose concentration. However, if the water signal is poorly suppressed, the H1-α-glucose peak and surrounding baselines would be overlapped with the residual water peak. Hence, a proper baseline correction is important to fit the low-SNR H1-α-glucose peak. In this study, the H1-α-glucose peak was analyzed using LCModel with data excluding a range of the residual water peak, and the effects into the baseline around the H1-α-glucose peak were observed.
METHODS
This study was approved by an institutional review board, and written informed consent was obtained from subjects. The 20 healthy subjects (aged 20-24 years) were scanned on an investigational whole-body 7T scanner (MAGNETOM 7T, Siemens Healthcare, Erlangen, Germany). A single-channel transmit, and 32-channel receive head coil (Nova Medical, MA, USA) was used. Siemens investigational prototype sequence of MPRAGE for T1 anatomical imaging was utilized to position an MRS voxel at the posterior cingulate cortex (27 mL) in the mid-sagittal plane on the images. B0 shimming was achieved using FASTESTMAP6 (Siemens investigational prototype sequence). B1 amplitude was adjusted for the MRS voxels.MR spectra were acquired using Siemens investigational prototype sequences of semi-LASER (TR/TE = 6500-8000/32 ms, signal average = 96, scan time = 11-13 min) and short-TE STEAM (TR/TE/TM = 5700-7280/5/45 ms, signal average = 128, scan time = 12-15.5 min) with VAPOR water suppression7 and outer volume suppression. Identical MRS parameters were RF transmitter offset = 4.2 ppm, spectral width = 6 kHz, data points = 2048. The TRs were determined as the shortest values under SAR limitation. Water spectra in the MRS voxels were acquired too.
Spectra were analyzed using LCModel (version 6.3-1L). A semi-LASER basis set was developed in-house. Basis sets only for the doublet of the H1-α-glucose were generated to quantitate glucose concentration via the peak. Eddy current correction8 and water-scaling for quantification9 were performed using the water spectra. The analysis window was 0.2-6.0 ppm with the gaps of 4.20-5.00 ppm and 4.47-5.00 ppm in the semi-LASER and the short-TE STEAM, respectively, to exclude the residual water peak from the analysis using PPMGAP parameter. Baseline correction for glucose quantification via the H1-α-glucose peaks was evaluated using residuals (the acquired spectrum minus the fit) in 5.03-5.43 ppm. The precision of quantification was evaluated using Cramer-Rao lower bounds (CRLB, %SD). The SNR was calculated with the fit peak height divided by the SD of the residuals (i.e., baseline-corrected noises) in 0.2-0.6 ppm. The spectra with the SNR of the H1-α-glucose higher than 3, which is an acceptable value for estimating a detection limit in analytical chemistry guideline,10 were evaluated for glucose quantification. Statistical analysis was conducted, and a P < 0.05 was considered to be statistically significant.
RESULTS
Figure 1 shows the spectra acquired from one representative subject and analyzed using PPMGAP. The insets of the figure 1 shows that the H1-α-glucose peaks are fitted using the generated basis-sets. Figure 2 shows the spectra in the range of 4.0-6.0 ppm analyzed with and without PPMGAP. The insets of the figure 2 shows averages and SDs of the residuals around the H1-α-glucose peak analyzed with (blue) and without (black) PPMGAP. Evaluating with the averaged residuals, the errors of baseline fitting in the right-hand side near the water peak are reduced with PPMGAP to the level of those of fitting the H1-α-glucose peak. Evaluating with the SDs of the residuals, the errors of baseline fitting among the subjects are reduced in the semi-LASER with PPMGAP.Results from the spectral analysis are shown in Table 1. The mean and detection limit of glucose concentrations were estimated to be 1.0 mM and 0.6 mM, respectively, via both sequences. The CRLBs of fitting the H1-α-glucose peak were significantly smaller in the semi-LASER (33.1 %) than those in the short-TE STEAM (49.8 %). The water peaks were significantly better suppressed in the short-TE STEAM than those in the semi-LASER.
DISCUSSION
Inadequate water suppression distorted the baseline around the H1-α-glucose peak. The distortions were severe in the semi-LASER due to poor water suppression. The averaged residuals in the semi-LASER had a peak at 5.08 ppm, which would be formed with the sum of multiple components including the tail of the residual water peak. Excluding data of the residual water peak with PPMGAP corrected the baseline distortion and reduced the variation among the subjects. The post-processing approach will simplify the scanning operation without the optimization of water suppression and improve the quantification of cerebral glucose concentration via the H1-α-glucose peak detection.Acknowledgements
The authors thank Dr. Lana G Kaiser (University of California, Berkeley) to provide the semi-LASER basis set, Dr. Gerald R Moran (Siemens Healthcare Canada) to provide the prototype FASTESTMAP sequence, Dr. Tobias Kober (Siemens Healthcare GmbH) to provide the prototype MPRAGE sequence and Mr. Koji Yasuda (LA Systems) to support LCModel.References
- Joers JM, Deelchand DK, Kumar A, et al. Measurement of hypothalamic glucose under euglycemia and hyperglycemia by MRI at 3T. J Magn Reson Imaging 2017;45:681-691.
- Gruetter R, Garwood M, Ugurbil K, Seaquist ER. Observation of resolved glucose signals in 1H NMR spectra of the human brain at 4T. Magn Reson Med 1996;36:1-6.
- Gruetter R, Ugurbil K, Seaquist ER. Steady-state cerebral glucose concentrations and transport in the human brain. J Neurochem 1998;70:397-408.
- Fichtner ND, Henning A, Zoelch N, Boesch C, Kreis R. Elucidation of the downfield spectrum of human brain at 7 T using multiple inversion recovery delays and echo times. Magn Reson Med 2017;78:11-19.
- Kuribayashi H, Urushibata Y, Dinh THD, et al. Comparison of semi-LASER and short-TE STEAM pulse sequences for cerebral glucose quantification via detecting H1-α-glucose peak in 1H MRS at 7T. In: Proc Annual Meeting ISMRM, 2021, p. 2222.
- Gruetter R, Tkac I. Field mapping without reference scan using symmetric echo-planar technique. Magn Reson Med 2000;43:319-323.
- Tkac I, Starcuk Z, Choi I-Y, Gruetter R. In vivo 1H NMR spectroscopy of rat brain at 1 ms echo time. Magn Reson Med 1999; 41:649-656.
- Klose U. In vivo proton spectroscopy in presence of eddy currents. Magn Reson Med 1990;14:26–30.
- Gasparovic C, Song T, Devier D, et al. Use of tissue water as a concentration reference for proton spectroscopic imaging. Magn Reson Med 2006;55:1219–1226.
- Guidance for industry. Q2B Validation of analytical procedures: Methodology. International council for harmonization of technical requirements for pharmaceuticals for human use. (1996) https://www.fda.gov/media/71725/download
Figures
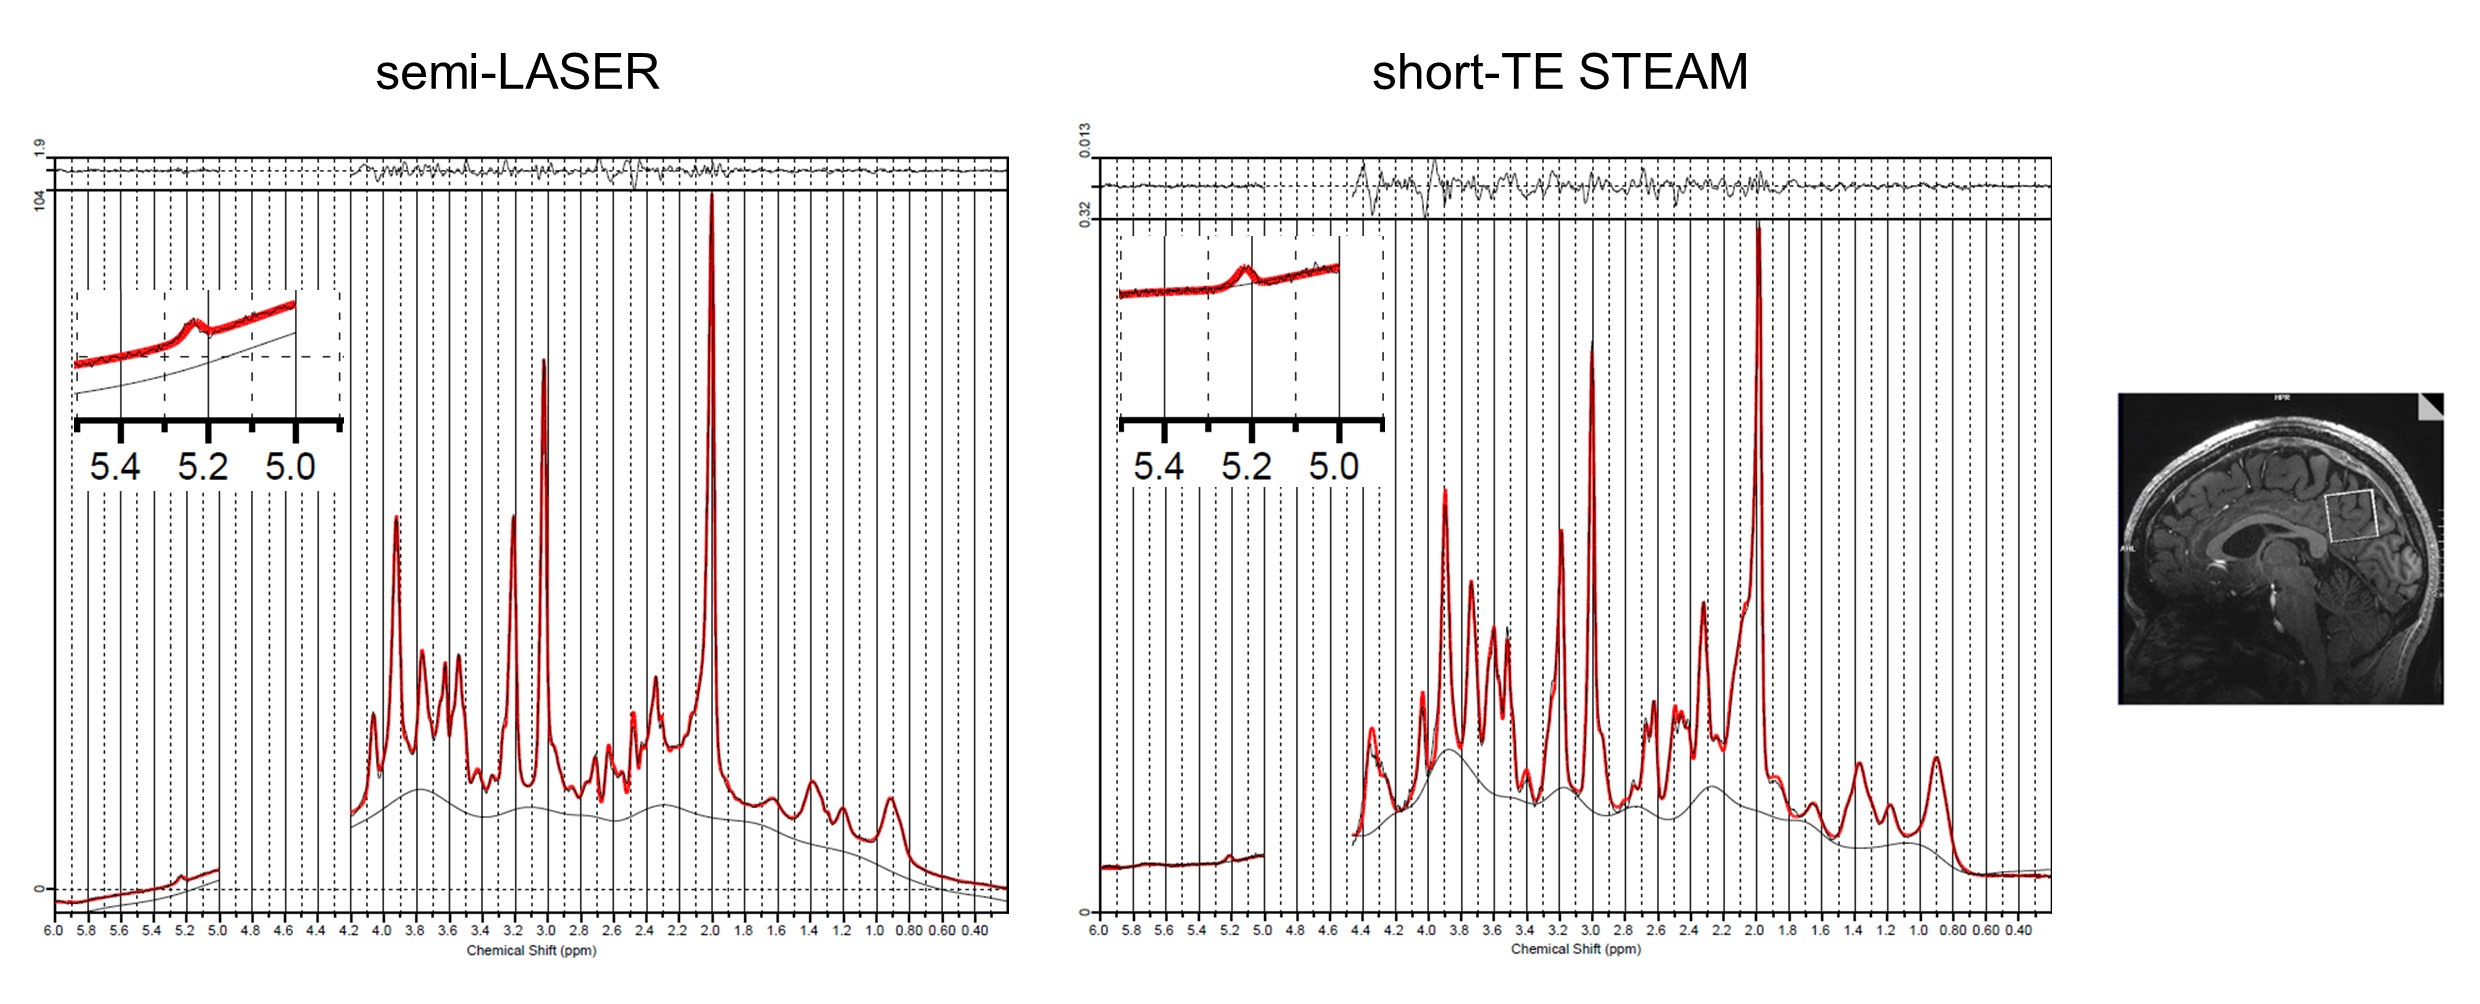
FIGURE
1. Representative semi-LASER
(left)
and
short-TE STEAM (right) spectra from the posterior cingulate cortex in a subject
acquired
at 7T.
The spectra were analyzed using LCModel contained basis sets of H1-α-glucose peak with the gaps covering the residual water peaks. The insets show H1-α-glucose peaks. Glucose
concentrations quantitated (1.07 and 1.09 mM) are close to those averages
in this study (Table. 1). SNRs of H1-α-glucose peak
are 8.2 and 7.6.
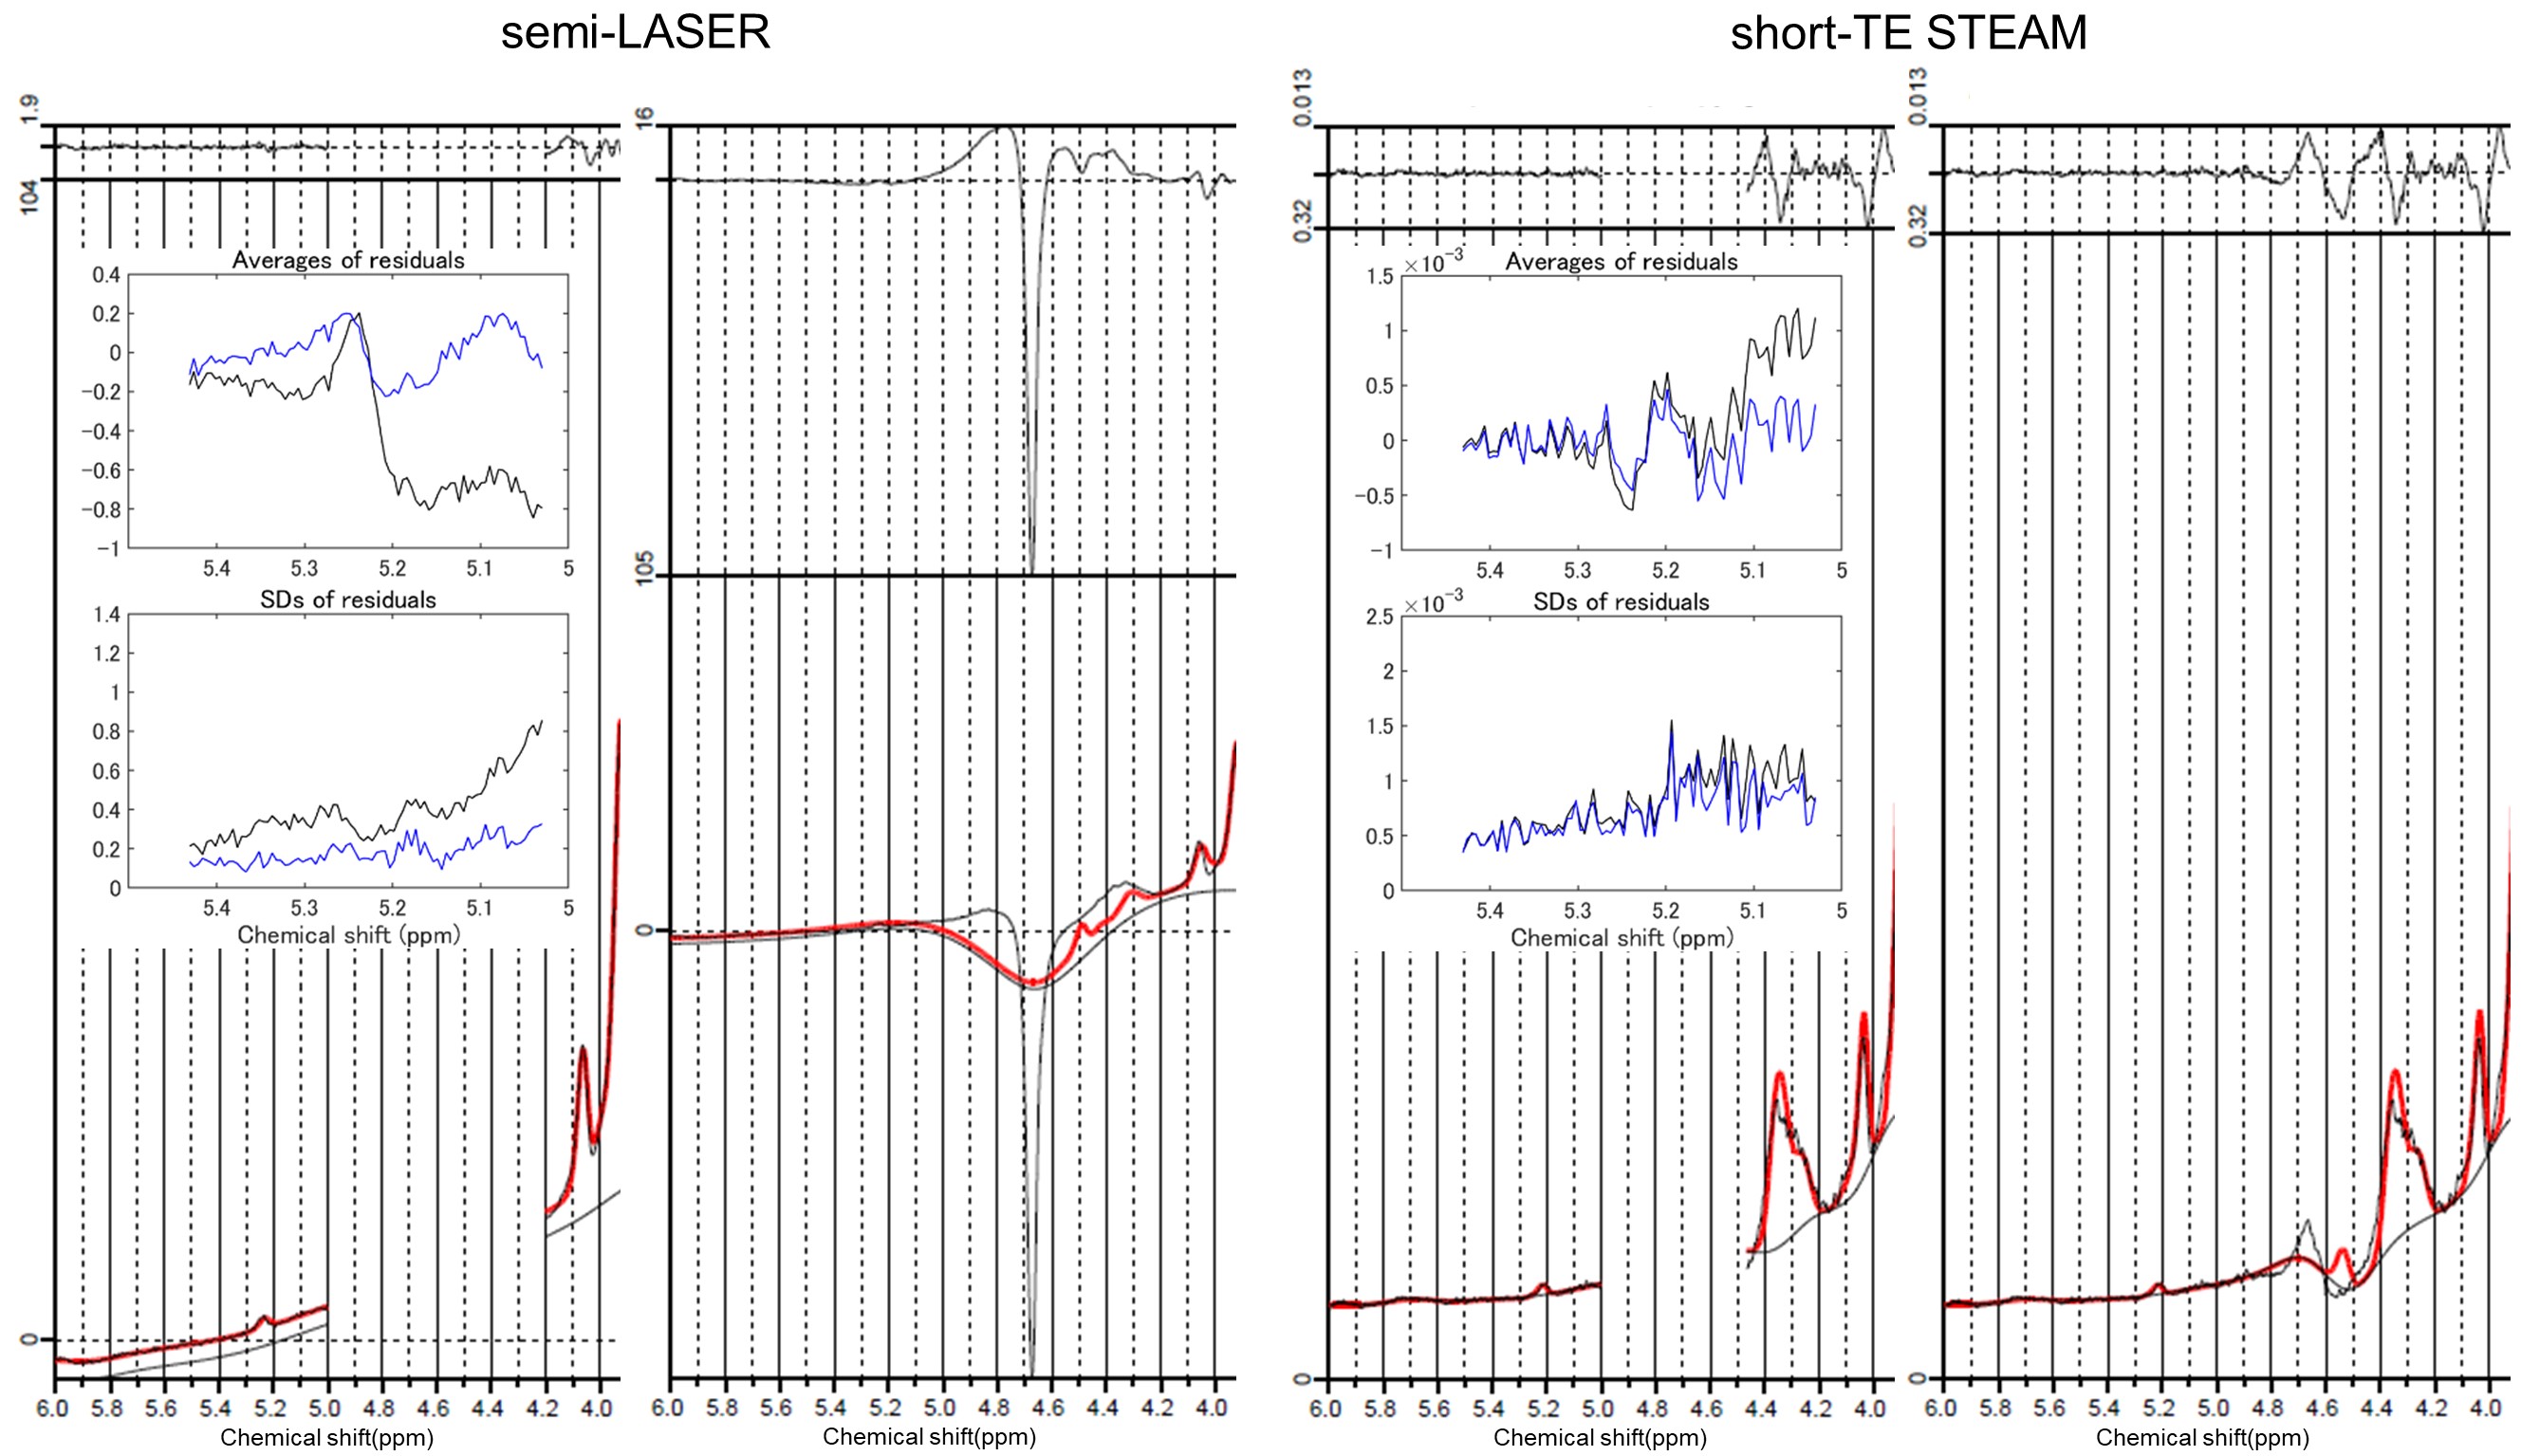
FIGURE
2. Semi-LASER
(left)
and
short-TE STEAM (right) spectra analyzed with
and without PPMGAP from the subject
shown in Figure 1.
The upper part of the figures represents the residual signal after fitting. The insets show the averages (top) and the SDs
(bottom) of the residuals (the acquired spectrum minus the fit) among the
subjects with (blue) and without (black) PPMGAP.
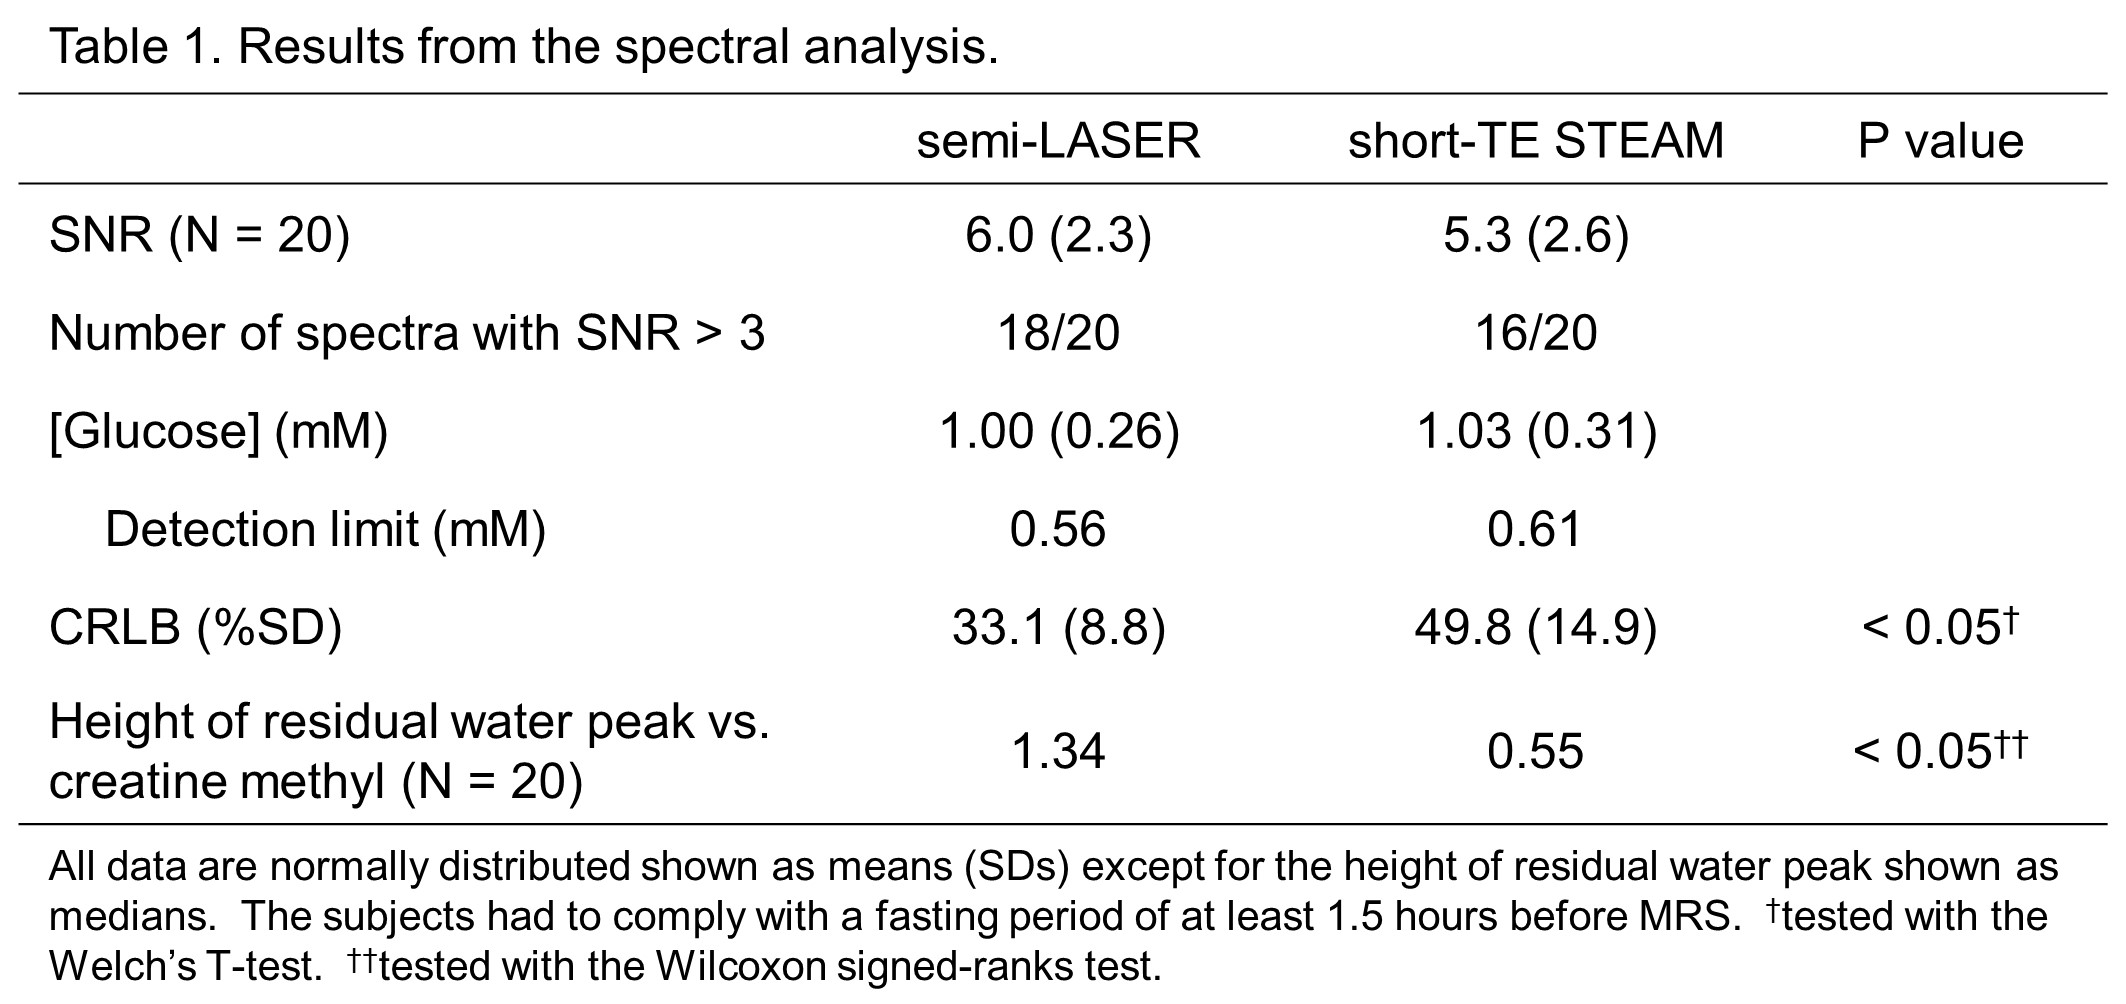
Table
1. Results from the spectral analysis.
DOI: https://doi.org/10.58530/2022/4365