4363
Development of measurement method of metabolite concentration in 1H MRS under B1 inhomogeneity at high magnetic field1Health and environmental risk division, National Institute for Environmental Studies, Tsukuba, Japan
Synopsis
The method for measurement of metabolite concentrations in 1H MRS in a human brain at high B0 field was proposed. A water phantom as a reference and a human brain area measured separately. The ratio of the reception sensitivities between uniform areas in the phantom and in the human brain can be computed from measured B1+s. The ratio between the VOI and the uniform area in the human brain can be computed by our previously reported ratio map method. Then, metabolite concentrations in the VOI can be calculated. Our method was demonstrated in the phantom experiments using metabolite mixtures.
Introduction
High field 1H MR spectroscopy in human brain has advantages in high sensitivity and spectral resolution. This feature can lead to accurate measurement of metabolite concentrations. In this method, tissue water is widely used as an internal concentration reference [1]. Water content in a volume of interest (VOI) is estimated from fractions of gray matter (GM), white matter (WM) and cerebrospinal fluid (CSF) with literature data. Then, a metabolite concentration is calculated using the relationship between the water content and the peak area (PA) of water in the VOI. Since water contents differ among these regions, that relationship is not correct when B1 inhomogeneity exists in the VOI, and accurate quantitation cannot be done. In addition, pathological changes of water content will cause quantitation error using the internal water reference method. One of important findings of B1 that transmission RF field, B1+ and reception sensitivity, B1- differ even when a transceiver RF coil is used [2]. While B1+ can be measured, B1- map cannot be measured in human brains because it is always associated with signal intensities. We have reported that linear relationship exists between B1+ and B1- around a uniform area even at high B0 field [3]. Our proposed method using this relationship is useful for water content mapping of human brain at 4.7T MRI. In this work, we will apply this finding to measurement of metabolite concentration in 1H MRS at high B0 field and will demonstrate measurement of concentration in experiments using a metabolite phantom.Methods
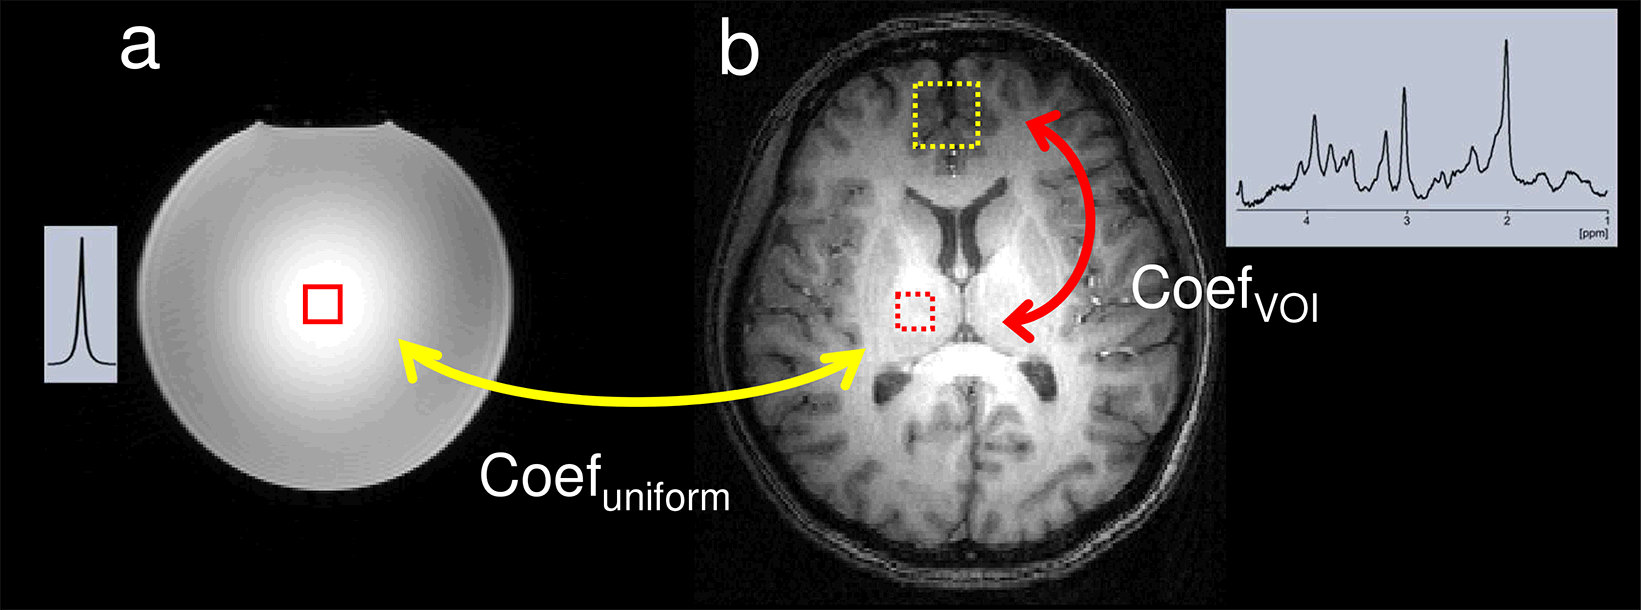
Proposed absolute quantitation method: In our proposed method, water phantom as a reference and a human brain are measured separately (Fig. 1). The following measurements are required to obtain B1- in the VOI of a human brain; B1+ maps both in the phantom and in the human brain, and localized water signal in a uniform area in the phantom. The ratio of B1-s, denoted as Coefuniform can be expressed by measured B1+s using the relationship between B1+ and B1- around a uniform area [3].\begin{align}Coef_{uniform}&=\frac{\frac{\int_{}^{} B_{1\ \ brain.uniform}^{-} dV}{Vol_{brain.uniform}}}{\frac{\int_{}^{} B_{1\ \ ref.uniform}^{-} dV}{Vol_{ref.uniform}}}\\ &=\frac{\frac{\int_{}^{} B_{1\ \ brain.uniform}^{+} dV}{Vol_{brain.uniform}}}{\frac{\int_{}^{} B_{1\ \ ref.uniform}^{+} dV}{Vol_{ref.uniform}}}\tag{1}\end{align}
where B1-brain.uniform denotes B1- in the uniform area inside the human brain and ref denotes the reference phantom. B1 is integrated inside the voxel. Volbrain.uniform denotes volume of the B1-uniform region in the human brain. Next, B1-s are compared between the VOI and the uniform area in the human brain using the ratio map method [4].
\begin{align}Coef_{VOI}=\frac{\frac{\int_{}^{} B_{1\ \ braintissue.VOI}^{-} dV}{Vol_{braintissue.VOI}}}{\frac{\int_{}^{} B_{1\ \ brain.uniform}^{-} dV}{Vol_{brain.uniform}}}\tag{2}\end{align}
From these equations, B1-s can be compared between the region of brain tissue (GM, WM) in the VOI in the human brain and the uniform area in the reference phantom. When a peak area of water is expressed as PA, concentration of water in the phantom is measured as Coef*PA in the brain tissue in the VOI in the human brain.
\begin{align}Coef&=Coef_{VOI}\times Coef_{uniform}\\ &=\frac{\frac{\int_{}^{} B_{1\ \ braintissue.VOI}^{-} dV}{Vol_{braintissue.VOI}}}{\frac{\int_{}^{} B_{1\ \ ref.uniform}^{-} dV}{Vol_{ref.uniform}}}\tag{3}\end{align}
Then, concentration of the metabolite in the VOI in the human brain denoted as Concmetab can be computed by
\begin{align} Conc_{metab}=Conc_{ref}\times \frac{\frac{PA_{braintissue.VOI.metab}}{Vol_{braintissue.VOI}}}{\frac{Coef\times PA_{ref.uniform}}{Vol_{ref.uniform}}}\\\tag{4} \end{align}
where Concref and PAref.uniform denote the concentration of water that is 55.5 M and PA of water in the uniform area in the reference phantom, and PAbraintissue.VOI.metab denotes PA of a metabolite in the localized 1H spectrum of the human brain. The B1- inhomogeneity in the VOI in the human brain can be considered for the absolute quantitation using this proposed method.
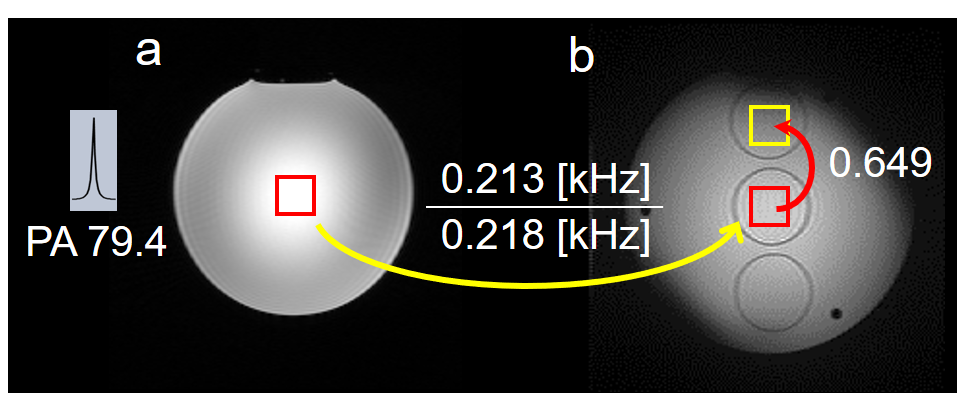
Experiments: All experiments were performed using a 4.7T whole-body MR system (INOVA, Agilent) by using a volume TEM coil both for transmission and reception. To demonstrate the proposed method, we performed experiments with a spherical saline phantom with 130-mm diameter for a reference and a 50-ml bottle of metabolite mixtures of NAA and Cr both of 10 mM inside a cylinder phantom of water with 150-mm diameter and 170-mm length for measuring (Fig. 2). Absolute B1+ maps were measured by the phase method [5] using the same conditions of RF power in the both phantoms. A B1- map in the cylinder phantom (Fig. 2b) was measured by an adiabatic spin echo sequence to avoid B1+ inhomogeneity. Localized STEAM signals both in the uniform area in the reference phantom (Fig. 2a) and in the VOI in the phantom for measuring (a yellow square in Fig. 2b) were measured by the STEAM sequence. The voxel volumes were 8ml.
Results & Discussion
Amplitudes of B1+ in the uniform areas are 0.218 [KHz] in the reference phantom and 0.213 [KHz] in the phantom for measuring, respectively. The ratio of the VOI to the uniform area calculated from measured B1- map was 0.649 (Fig. 2). By multiplying PAref.uniform measured as 79.4 by Coef = 0.213/0.218*0.649, then the chemical substance of 55.5 M is measured as PA of 50.3 in the VOI. Using this relationship and PAs of metabolites, concentrations were calculated as 10.7 [mM] for NAA and 11.1 [mM] for Cr. These values are both close to the metabolite concentrations.Conclusions
Our proposed method using the relationship in uniform areas is useful for absolute quantitation of human brain in 1H MRS at high B0 field.Acknowledgements
No acknowledgement found.References
1. Barker PB., Soher BJ., Blackband SJ., Chatham JC., Mathews VP., Bryan RN., Quantitation of proton NMR spectra of the human brain using tissue water as an internal concentration reference. NMR Biomed. 1993;6:89-94.
2. Hoult DI., The principle of reciprocity in signal strength calculations – a mathematical guide. Concepts Magn. Reson. 2000;12:173-187.
3. Watanabe H., Takaya N., Mitsumori F., Development of quantitative water content mapping in human brain at high magnetic field. Proc. Intl. Soc. Mag. Reson. Med. 2019;27:4406.
4. Watanabe H., Takaya N., Mitsumori F. Non-uniformity correction of human brain at high field by RF field mapping of B1+ and B1-. J. Magn. Reson. 2011;212(2):426-430.
5. Lee Y., Han Y., Park H.W., Watanabe H., Garwood M., Park J.Y. New phase-based B1 mapping method using two-dimensional spin-echo imaging with hyperbolic secant pulses. Magn Reson Med 2015;73(1):170-181.
Figures