4360
Effect of GABA and Glx Levels on the Medication Overuse Headache
Xiaoyan Bai1,2, Zhangxuan Hu3, Wei Wang4, Xueyan Zhang5, Zhiye Li1, Yonggang Wang4, and Binbin Sui2
1Department of Radiology, Beijing Tiantan Hospital, Capital Medical University, Beijing Neurosurgical Institute, Beijing, China, Beijing, China, 2Tiantan Neuroimaging Center of Excellence, China National Clinical Research Center for Neurological Diseases, Beijing, China, Beijing, China, 3GE Healthcare, Beijing, China, Beijing, China, 4Department of Neurology, Beijing Tiantan Hospital, Capital Medical University, Beijing, China; Headache Center, China National Clinical Research Center for Neurological Diseases, Beijing, China, Beijing, China, 5Department of Neurology, The First Affiliated Hospital of Zhengzhou University, Zhengzhou, China, Zhengzhou, China
1Department of Radiology, Beijing Tiantan Hospital, Capital Medical University, Beijing Neurosurgical Institute, Beijing, China, Beijing, China, 2Tiantan Neuroimaging Center of Excellence, China National Clinical Research Center for Neurological Diseases, Beijing, China, Beijing, China, 3GE Healthcare, Beijing, China, Beijing, China, 4Department of Neurology, Beijing Tiantan Hospital, Capital Medical University, Beijing, China; Headache Center, China National Clinical Research Center for Neurological Diseases, Beijing, China, Beijing, China, 5Department of Neurology, The First Affiliated Hospital of Zhengzhou University, Zhengzhou, China, Zhengzhou, China
Synopsis
Eight medication overuse headache (MOH) patients and eight healthy controls (HCs) were recruited to explore the potential neuroimage biomarkers based on 1H-MRS. The Glx (glutamate and glutamine) and γ-aminobutyric acid (GABA) levels in thalamus and PAG regions were compared between MOH and HC groups. The MOH group had lower GABA+/water and higher Glx/Cr ratios than HC group in the PAG. Also,higher Glx/Cr and Glx/water ratios were found in the left thalamus with MOH group. These results might be better explaining the pathophysiology mechanism of MOH in the trigeminovascular pain pathways, and guiding the clinical targeted drug treatment for MOH patients.
Introduction/Purpose
Migraine is a common, chronic and disabling disorder, which has the dysfunction and abnormal energy metabolism of subcortical structures.1,2 Medication overuse headache (MOH) is the patient who has regularly overused one or more drugs that can be taken for acute treatment of headache.3 The underlying pathophysiology mechanisms of MOH remain incompletely understood, but most likely involve complex mechanisms of the peripheral and central nervous system.4 Magnetic resonance spectroscopy (MRS) has been used in migraine studies to investigate the excitatory (glutamate) and inhibitory (γ-aminobutyric acid (GABA)) neurotransmitter levels, in which the changes in GABA and glutamate levels in multiple brain regions were reported.5,6 The trigeminovascular pain pathways7 found the thalamus and periaqueductal gray (PAG) are the major centers for the processing of nociceptive inputs. However, there were few studies to investigate the GABA and glutamate levels in the regions of the thalamus and PAG. In this study, we aimed to explore the potential neuroimage biomarkers for MOH patients based on 1H-MRS methods and to provide the basis for the diagnosis and treatment of MOH patients.Methods
Eight MOH patients (MOH group; 7 females, mean ages: 50.57 ± 5.04 years old) and eight healthy controls (HC group; 7 females, mean ages: 31.63 ± 2.12 years old) were recruited from Tiantan Neuroimaging Center of Excellence, Beijing Tiantan Hospital, Capital medical university. Patients were included if they had received a physician diagnosis of MOH, which was confirmed using the ICHD-III beta diagnostic criteria8, with no other accompanying neurological, psychiatric, or systematic disorders. They met the standard Magnetic Resonance Imaging (MRI) safety criteria (eg, no metal implants or devices). Healthy subjects were included if they had no history of migraine or other headache disorder, neurological, psychiatric, or systemic disorders, and standard MRI safety criteria.Scanning was performed on a 3T MR scanner (Signa Premier, GE Healthcare) using a 48-channel head coil. T1w volumetric images were acquired using the MP-RAGE sequence with 1 mm isotropic resolution (sagittal acquisition, FOV = 256 mm, acquisition matrix = 256, slice number = 192, flip angle = 8°, preparation time = 880ms, recovery time = 400 ms, acceleration factor = 2, acquisition time = 4:00). The 20×20×20 mm3 voxels were placed in the left and right thalamus (midline centered) and PAG (Figure 1). The 1H spectrum optimized for detecting GABA was acquired using a MEGA-PRESS sequence with the following parameters: TE/TR=68/2000 ms; number of points = 2048; spectral width = 2000 Hz; number of averages = 160 (scan time = 11:28). MEGA-PRESS data were analyzed using the GABA analysis toolkit (GANNET3.1, http://gabamrs.org)9, which uses a Gaussian baseline model to fit the edited GABA signal and a Lorentz-Gaussian lineshape to fit the unsuppressed water signal. The output GABA and Glx concentrations were expressed in institutional units relative to water (GABA+/water, Glx/water) and as an integral ration relative to Creatine (GABA+/Cr, Glx/Cr).
Comparisons of GABA+/Water, GABA+/Cr, Glx/Water, and Glx/Cr in the bilateral thalamus and PAG regions between MOH and HC groups were performed by the Mann-Whitney U test. A p value < 0.05 was considered statistically significant. All statistical analysis was performed using the SPSS 24.0 statistical software package (SPSS Inc., Chicago, IL, USA).
Results
Comparisons of GABA+/water, GABA+/Cr, Glx/water, and Glx/Cr ratios in the bilateral thalamus and PAG regions between MOH and HC groups are shown in Figure 2. In the PAG, the MOH group had a significantly lower GABA+/water ratios than the HC group (p = 0.043); the MOH group had a significantly higher Glx/Cr ratios than the HC group (p = 0.038). In the left thalamus, the MOH group had significantly higher Glx/water and Glx/Cr ratios than the HC group (p = 0.021 and p = 0.023, respectively). In the right thalamus, no significant difference of the GABA+/water (p = 0.950), GABA+/Cr (p = 0.867), Glx/water (p = 0.662) and Glx/Cr ratios (p = 0.397) between MOH and HC groups.Discussion and Conclusion
In the current study, our results showed that the MOH group had lower GABA+/water and higher Glx/Cr ratios than the HC group in the PAG. Also, higher Glx/Cr and Glx/water ratios were found in the left thalamus with the MOH group. This phenomenon has not been reported in previous studies. Our findings might be better explaining the pathophysiology mechanism of MOH in the trigeminovascular pain pathways, and guiding the clinical targeted drug treatment for MOH patients.Acknowledgements
We sincerely thank the participants in this study.References
- Stovner LJ, Nichols E, Steiner TJ, et al. Global, regional, and national burden of migraine and tension-type headache, 1990–2016: a systematic analysis for the Global Burden of Disease Study 2016. The Lancet Neurology. 2018;17(11):954-976.
- Su M, Yu S. Chronic migraine: A process of dysmodulation and sensitization. Mol Pain. 2018;14:1744806918767697.
- Headache Classification Committee of the International Headache Society (IHS) The International Classification of Headache Disorders, 3rd edition. Cephalalgia. 2018;38(1):1-211.
- Noseda R, Burstein R. Migraine pathophysiology: anatomy of the trigeminovascular pathway and associated neurological symptoms, cortical spreading depression, sensitization, and modulation of pain. Pain. 2013;154 Suppl 1(Supplement 1): S44-53.
- Bridge H, Stagg CJ, Near J, Lau CI, Zisner A, Cader MZ. Altered neurochemical coupling in the occipital cortex in migraine with visual aura. Cephalalgia. 2015;35(11):1025-1030.
- Bell T, Stokoe M, Khaira A, et al. GABA and glutamate in pediatric migraine. Pain. 2021;162(1):300-308.
- Akerman S, Holland PR, Goadsby PJ. Diencephalic and brainstem mechanisms in migraine. Nat Rev Neurosci. 2011;12(10):570-584.
- Headache Classification Committee of the International Headache S. The International Classification of Headache Disorders, 3rd edition (beta version). Cephalalgia. 2013;33(9):629-808.
- Edden RA, Puts NA, Harris AD, Barker PB, Evans CJ. Gannet: A batch-processing tool for the quantitative analysis of gamma-aminobutyric acid-edited MR spectroscopy spectra. J Magn Reson Imaging. 2014;40(6):1445-1452.
Figures
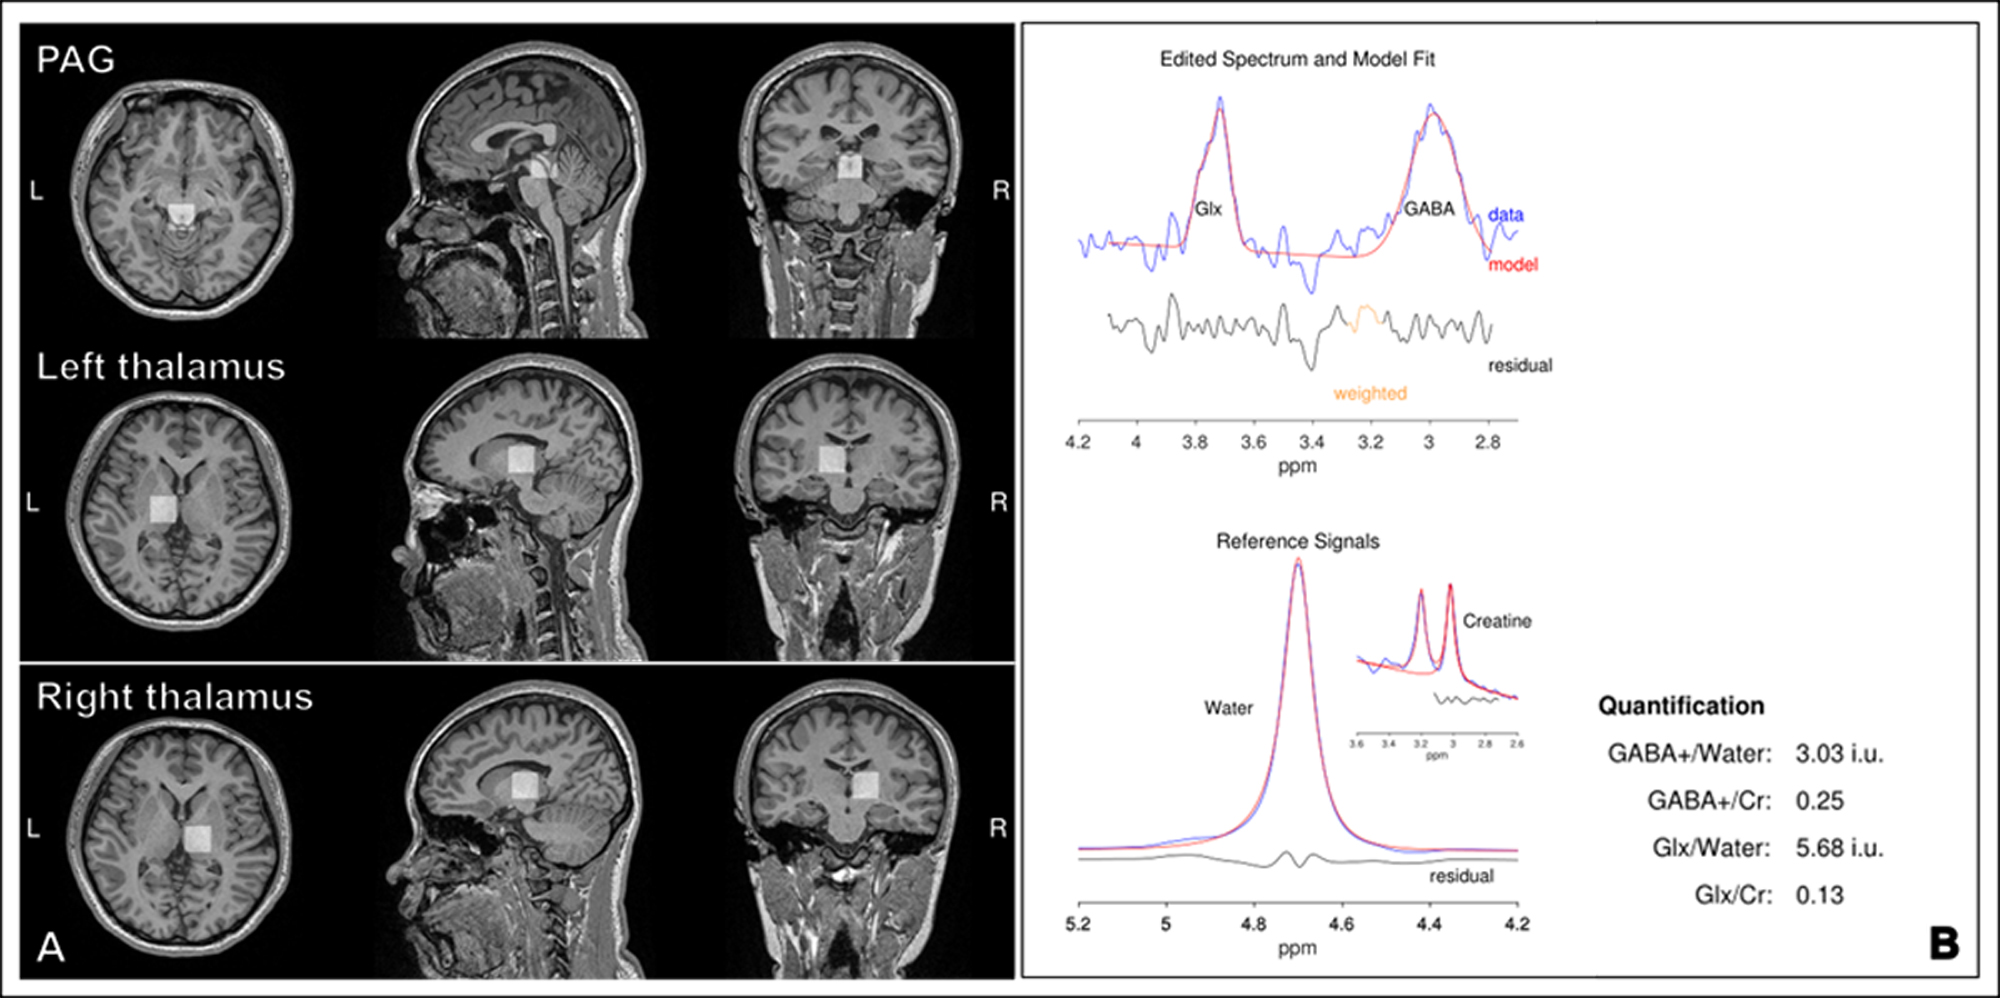
Figure 1. Representative GABA MRS
processing results. (A): The locations of periaqueductal gray (PAG) and
bilateral thalamus in axial, sagittal and coronal planes. (B): The fitting
results of GABA level with GANNET toolbox.
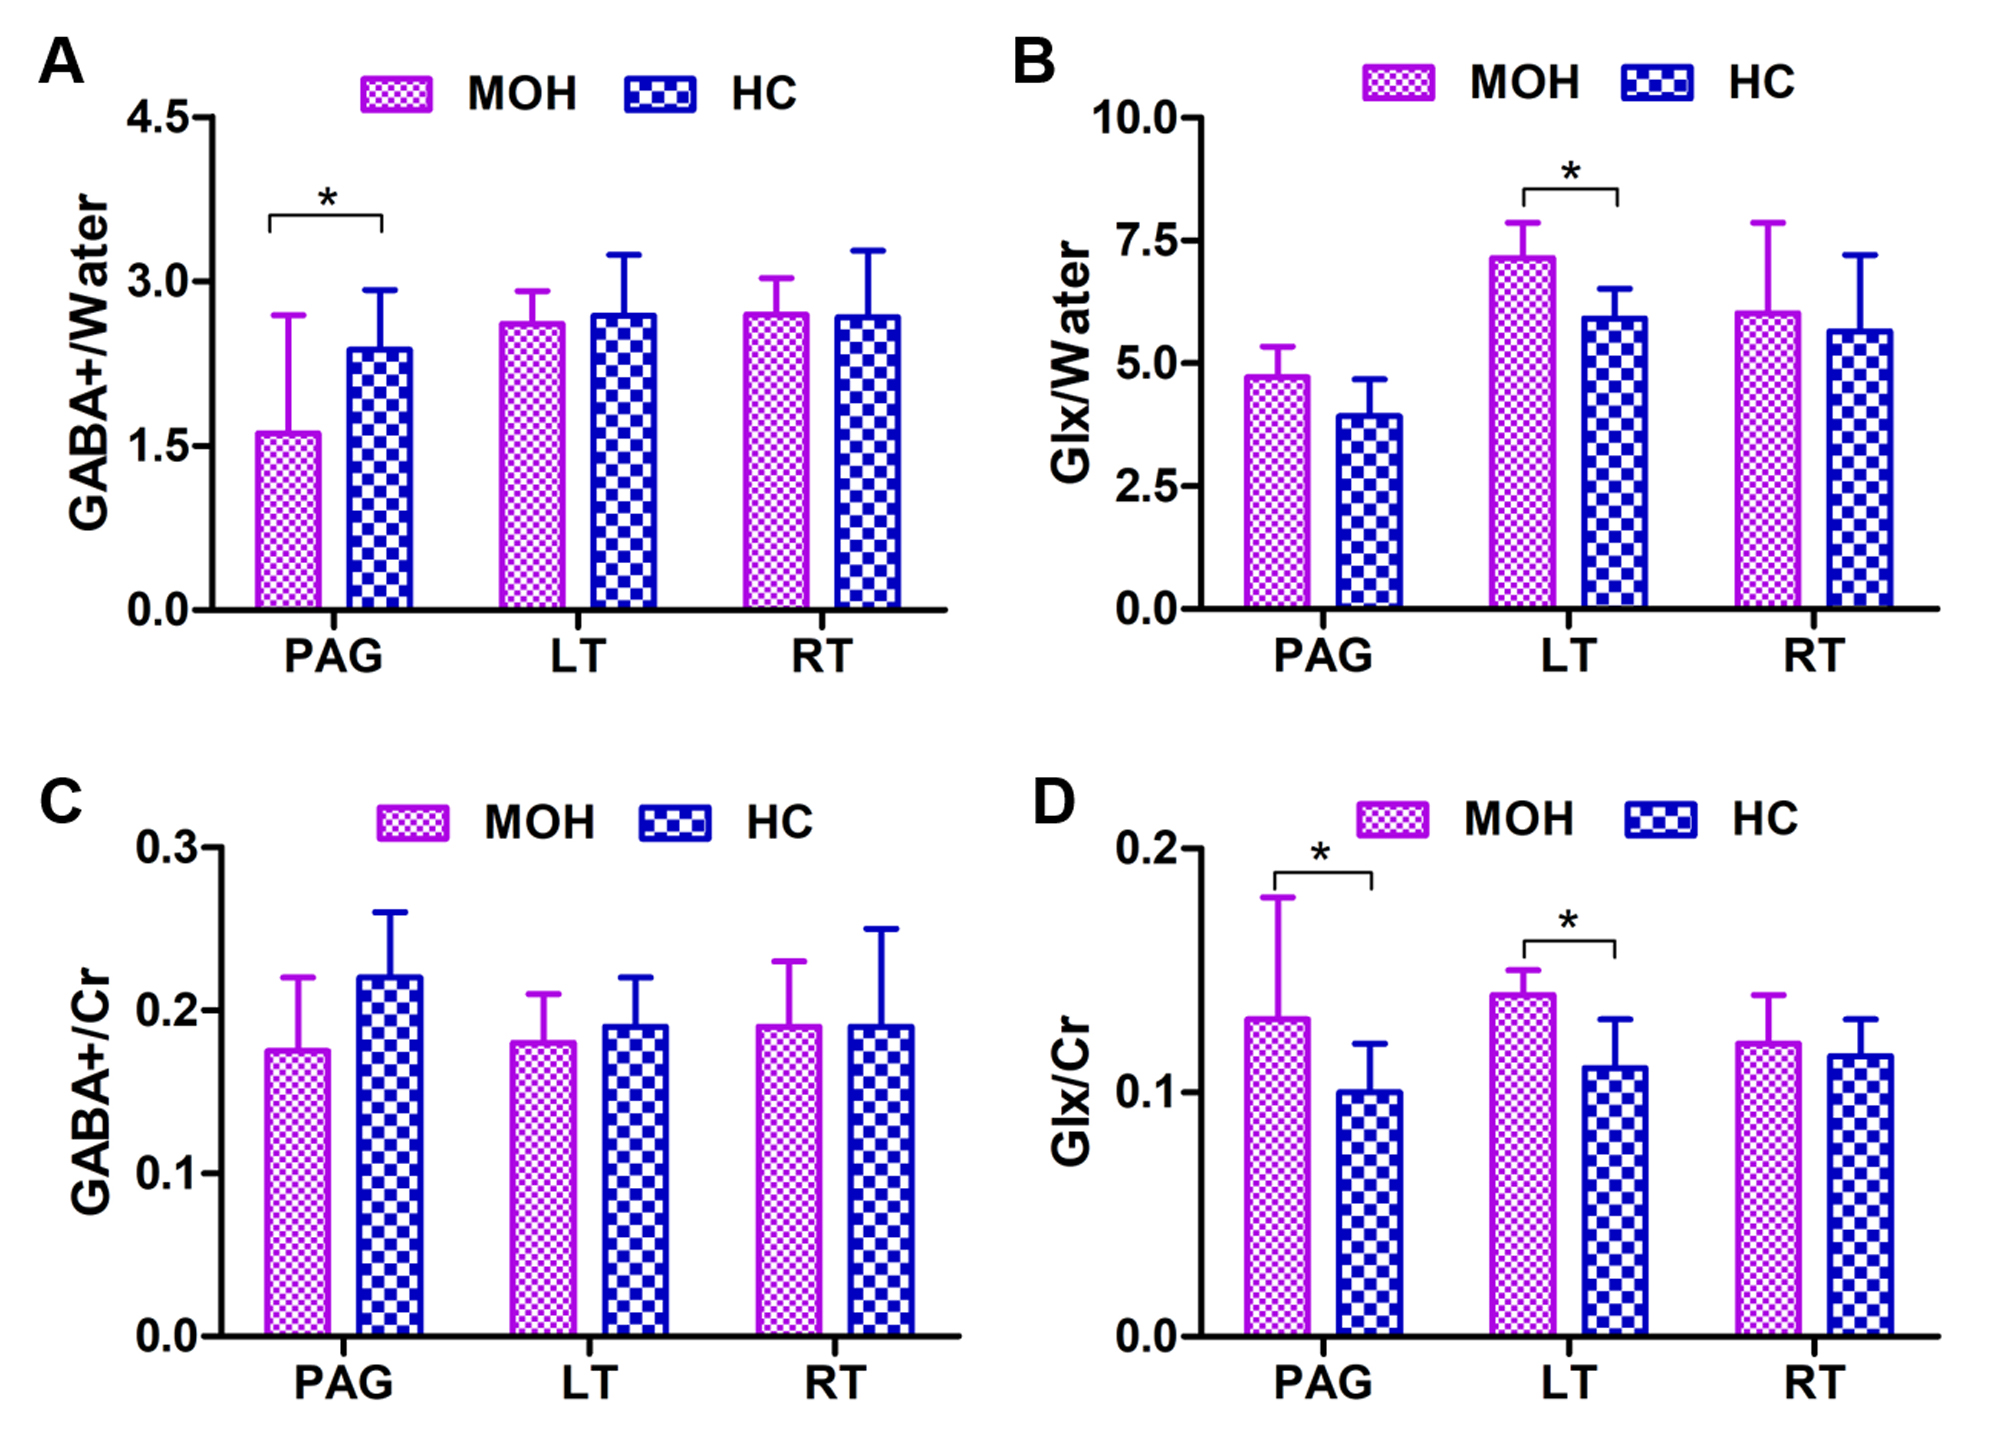
Figure 2. MOH and HC groups comparisons of (A): GABA+/Water
ratios; (B): Glx/Water ratios; (C) GABA/Cr ratios; and (D) Glx/Cr ratios in the
PAG and bilateral thalamus. Single asterisks indicate a significant difference
with P<0.05 between MOH and HC groups.
DOI: https://doi.org/10.58530/2022/4360