4350
7T MRI prediction from 3T MRI via a high frequency generative adversarial network
Yuxiang Dai1, Wei Tang1, Ying-Hua Chu2, Chengyan Wang3, and He Wang1,3
1Institute of Science and Technology for Brain-Inspired Intelligence, Fudan University, Shanghai, China, 2Siemens Healthineers Ltd., Shanghai, China, 3Human Phenome Institute, Fudan University, Shanghai, China
1Institute of Science and Technology for Brain-Inspired Intelligence, Fudan University, Shanghai, China, 2Siemens Healthineers Ltd., Shanghai, China, 3Human Phenome Institute, Fudan University, Shanghai, China
Synopsis
Existing methods often fail to capture sufficient anatomical details which lead to unsatisfactory 7T MRI predictions, especially for 3D prediction. We proposed a 3D prediction model which introduces high frequency information learned from 7T images into generative adversarial network. Specifically, the prediction model can effectively produce 7T-like images with sharper edges, better contrast and higher SNR than 3T images.
Introduction
To predict satisfactory 7T-like images, a few models have been proposed, including sparse learning1-3, random forest4, and deep learning5-7. Specially, sparse learning and random forest learn mapping from low resolution to high resolution images. While effective, these methods rely heavily on predefined features which lead to poor learning capacity. Deep learning techniques, such as WATNet6, have demonstrated state-of-the-art performance in 7T MRI prediction. However, these methods mentioned above still share the following limitations: (1) requiring rigid registration on gray and white matters between 3T and 7T images, which is quite challenging; (2) existing methods often fail to capture sufficient anatomical details. To address those limitations, we propose a high frequency-based generative adversarial network (HF-GAN).Methods
Basically, we utilized the GAN network to improve image contrast. Besides, to embed more detailed information into predictions, a reconstruction network (Recon-net) that learning HF information from 7T MRI was introduced. Then, the learned HF features were fused into encoders and decoders of generator respectively.GAN architecture
In Figure 1, the GAN network contains two components: a generator (generating 7T-like images) and a discriminator (discriminating 7T-like images with real 7T). For the generator, there are six encoders and five decoders, each of which has two 3D convolution layers. Instance normalization (IN), Rectified Linear Unit (Relu) and Max pooling were utilized (bule arrows) after each encoding process. Meanwhile, IN, Relu and Up-convolution (Upconv) were employed (green arrows) after each decoding process. Besides, skip connections were made between encoders and decoders with same feature channels via concatenation (concat). For the discriminator, five 3D convolution layers followed by Leaky Relu (LRelu) and a sigmoid were employed.
High frequency reconstruction
The k-space contains both low frequency (LF) and HF information that can provide anatomical details. The HF information of the k-space resides outside the central areas. In our implementation, two simplest matrices were designed and used to sample images in k-space. Given a source image, we converted it to k-space using Fourier Transformation and then extracted both HF and LF information (Figure 2). It is noticeable that HF images have finer structural information after repeated sampling. As shown in Figure 1, the Recon-net, aiming to learn 7T high-high information, has the same architecture with the generator. However, the input of the Recon-net was produced by combining the 3T high and 3T high-high images through a convolution layer, whereas the generator takes only a 3T image. For each encoder pair of Recon-net and generator, a fusion scheme to enhance features of encoders using HF information was employed:
$$F_{n}=F_{G_{n}}\odot F_{R_{n}}+F_{G_{n}}$$
where $$${\odot}$$$ indicates element-wise multiplication. $$$F_{n}$$$ is the fused feature of n-th encoder. $$$F_{G_{n}}$$$ and $$$F_{R_{n}}$$$ represent features of generator and Recon-net respectively. For decoder pairs, the Recon-net shared the extracted features with generator via concat layers.
Data preprocessing
We used 30 pairs of 3T and 7T cases in our experiments. For 3T MRI, T1 images were acquired on a Siemens Verio scanner, with 0.8mm isotropic resolution, TR = 2500ms, and TE = 3.47ms. For 7T MRI, T1 images were acquired on a Siemens Magnetom 7T scanner, with 0.6mm isotropic resolution, TR = 2500ms, and TE = 2.8ms. After skull removal, 3T images were aligned to the corresponding 7T images in the MNI space9. In consideration of field inhomogeneity, we conducted N4 correction10 on 7T MRI. After that, the intensity of 3T and 7T images was normalized. Furthermore, for network training, 25 pairs of 3T and 7T images were used for training, two pairs for validation, and the remaining three pairs for testing.Results
Figure 3 shows the predicted 7T-like images with respect to 3T and real 7T MRIs in three views. As can be seen in all three testing cases, the 7T-like images captured more fine details than the original 3T images, and resembled greatly to the 7T MRIs. The red boxes in Figure 3 show that our 7T-like images revealed significantly more vessels than the original 3T images by introducing the HF information. Particularly, in coronal view of case #2, the cerebellum has a SNR of 0.68 higher than the corresponding 3T image. This can be attributed to the high learning capability of HF-GAN of HF information. Furthermore, histograms of the intensity demonstrated in Figure 4 showed that the intensity distribution of 7T-like images are significantly closer to that of the 7T images. According to Figure 5, we provided the PSNR/SSIM values computed based on the predicted images with respect to 7T images for basic GAN and HF-GAN with different decoder combinations. HF-GAN performed the best for all three testing cases. Additionally, it’s demonstrated that sharing HF features reconstructed in Recon-net decoders with those of the generator can improve the results significantly.Conclusion
The proposed HF-GAN model is capable to predict 7T-like images based on 3T MRI with satisfactory contrast and SNR.Acknowledgements
This work was supported by the National Natural Science Foundation of China (No. 81971583), National Key R&D Program of China (No. 2018YFC1312900), Shanghai Natural Science Foundation (No. 20ZR1406400), Shanghai Municipal Science and Technology Major Project (No.2017SHZDZX01, No.2018SHZDZX01) and ZJLab.References
- Bahrami K, Shi F, Zong X, et al. Hierarchical reconstruction of 7T-like images from 3T MRI using multi-level CCA and group sparsity. International Conference on Medical Image Computing and Computer-Assisted Intervention. Springer, Cham, 2015: 659-666.
- Bahrami K, Shi F, Zong X, et al. Reconstruction of 7T-like images from 3T MRI. IEEE transactions on medical imaging, 2016, 35(9): 2085-2097.
- Zhang Y, Cheng J Z, Xiang L, et al. Dual-domain cascaded regression for synthesizing 7T from 3T MRI, International Conference on Medical Image Computing and Computer-Assisted Intervention. Springer, Cham, 2018: 410-417.
- Bahrami K, Rekik I, Shi F, et al. 7T-guided learning framework for improving the segmentation of 3T MR images, International Conference on Medical Image Computing and Computer-Assisted Intervention. Springer, Cham, 2016: 572-580.
- Bahrami K, Shi F, Rekik I, et al. Convolutional neural network for reconstruction of 7T-like images from 3T MRI using appearance and anatomical features. Deep Learning and Data Labeling for Medical Applications. Springer, Cham, 2016: 39-47.
- Qu L, Zhang Y, Wang S, et al. Synthesized 7T MRI from 3T MRI via deep learning in spatial and wavelet domains. Medical image analysis, 2020, 62: 101663.
- Qu L, Wang S, Yap P T, et al. Wavelet-based semi-supervised adversarial learning for synthesizing realistic 7T from 3T MRI. International Conference on Medical Image Computing and Computer-Assisted Intervention. Springer, Cham, 2019: 786-794.
- Mezrich R. A perspective on K-space. Radiology, 1995, 195(2): 297-315.
- Holmes J, Hoge R, Collins L, et al. Enhancement of MR images using registration for signal averaging. J Comput Assist Tomogr, 1998, 3(2):324-333.
- Sled J, Zijdenbos A. A nonparametric method for automatic correction of intensity nonuniformity in MRI data. IEEE Transactions on Medical Imaging, 1998, 17(1):87-97.
Figures
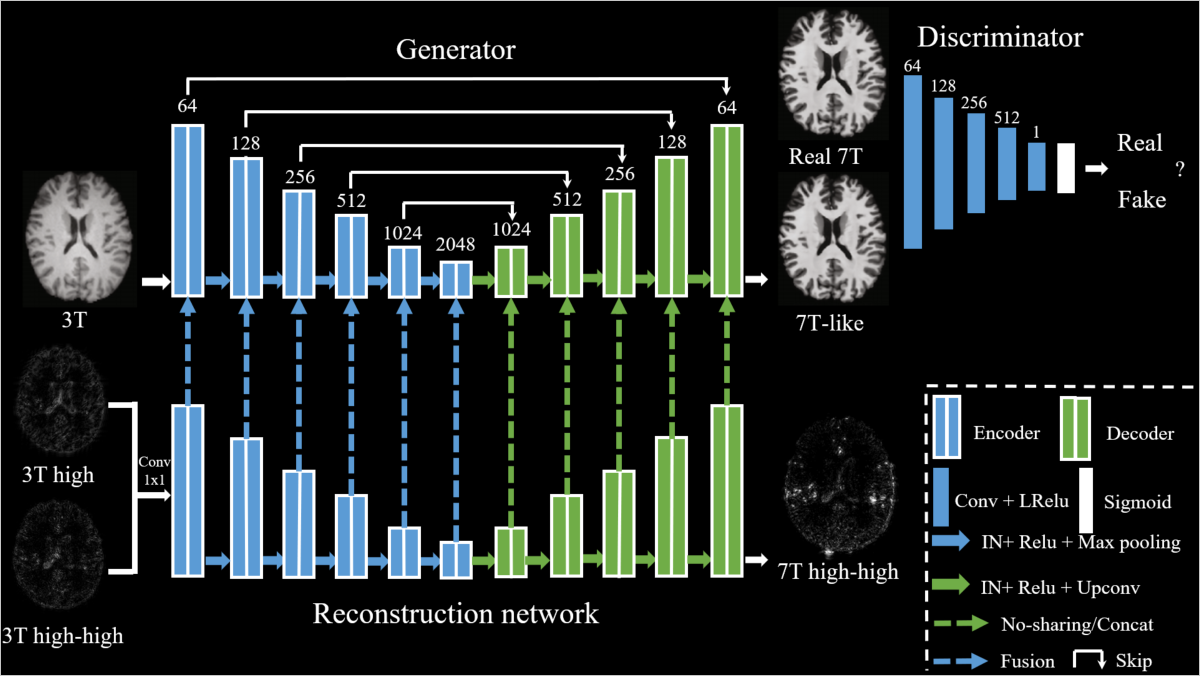
Figure 1. Framework
of proposed HF-GAN network, in which the above network is GAN network which
can improve image contrast and the below network is high frequency
reconstruction network which can introduce learned detailed information into
Generator. The numbers above each colored bar represents the channel number of
each convolution layer.
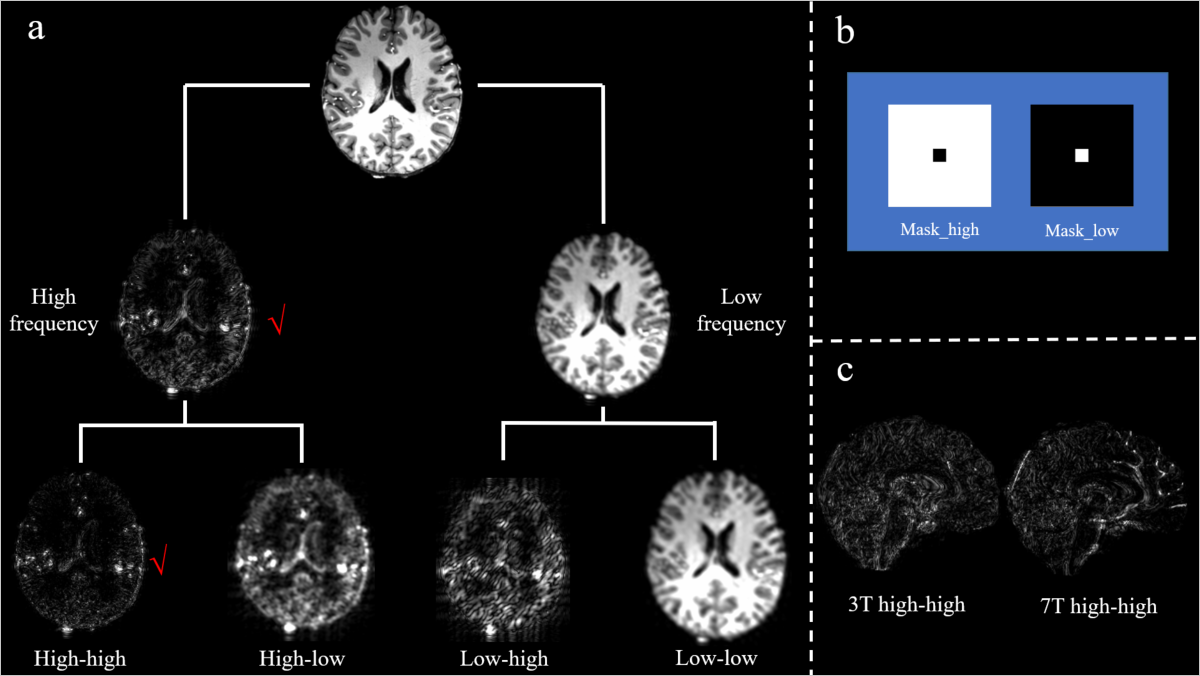
Figure 2. The workflow of extracting high frequency information. “Mask_high” and “Mask_low” matrices were used to sample HF and LF images respectively.
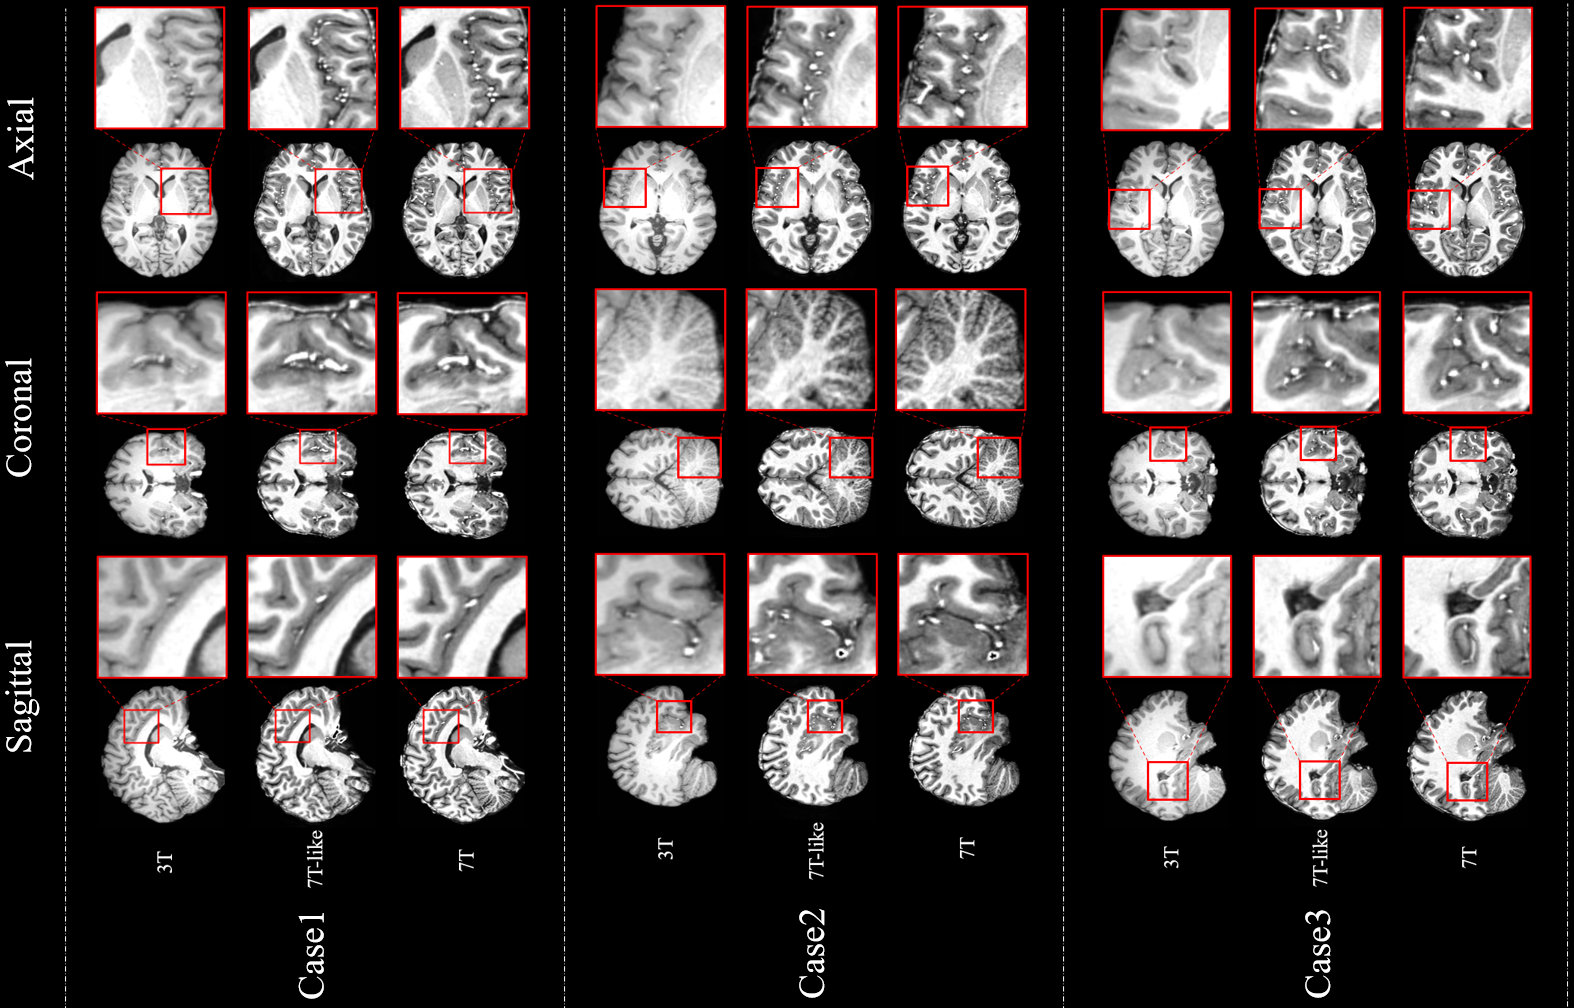
Figure 3. Prediction
results of testing cases shown in three views along with zoomed areas.
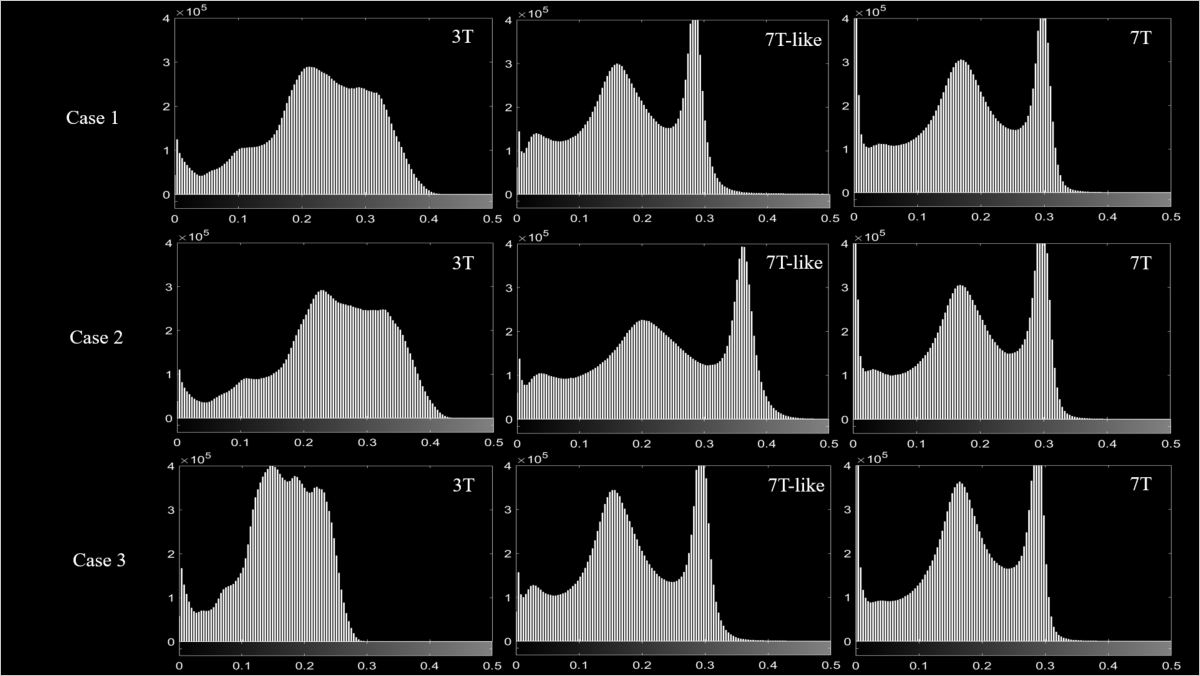
Figure 4. Histograms of 3T, 7T-like
and 7T images for three testing cases. It can be observed that the 7T-like
images reshape the signal distributions to the real 7T images.
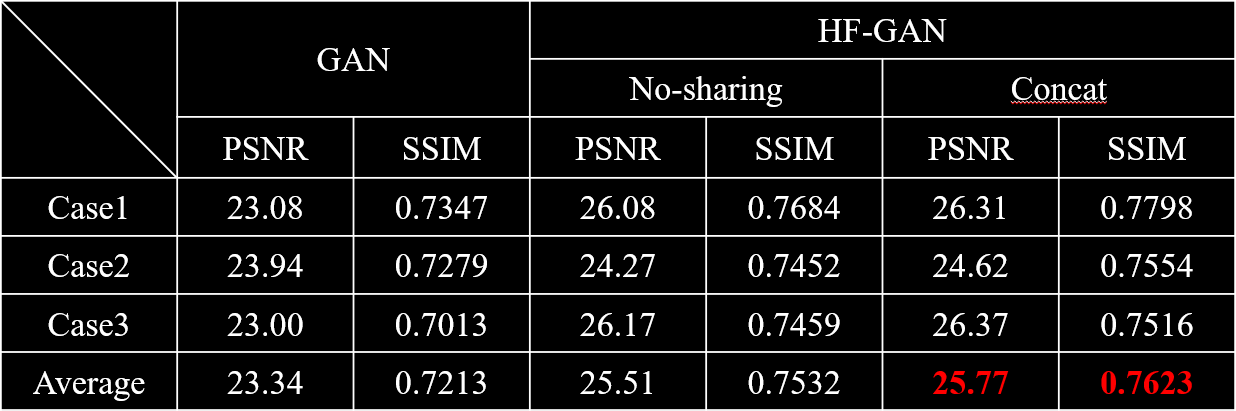
Figure 5. PSNR/SSIM of basic GAN and HF-GAN with different decoder combinations.
DOI: https://doi.org/10.58530/2022/4350