4349
A Deep Learning Approach to Improve 7T MRI Anatomical Image Quality Deterioration Due mainly to B1+ Inhomogeneity1Human Brain Research Center, Kyoto University, Kyoto, Japan, 2Department of Real World Data Research and Development, Kyoto University, Kyoto, Japan, 3Diagnostic Imaging and Nuclear Medicine, Kyoto University, Kyoto, Japan, 4Department of Human Health Sciences, Kyoto University, Kyoto, Japan
Synopsis
The effect of transmit field (B1+) inhomogeneity at 7T remains even after correction using a B1+-map. By a deep learning approach using pix2pix, a neural network was trained to generate 3T-like anatomical images from 7T MP2RAGE images (dataset 1: T1WI and T1-map after B1+ correction and dataset 2: Inversion time [INV]1, INV2 and B1+-map). When the HCP anatomical pipeline was applied and compared, low regressions of original 7T data to 3T data were largely improved by using generated images by pix2pix, especially for dataset 2.
INTRODUCTION
One of the major drawbacks of 7T MR systems is the intrinsic inhomogeneities of transmit RF field (B1+) which inevitably generate signal inhomogeneity or dropout in specific areas of the brain, such as the lower temporal lobe1. MP2RAGE2, which obtains two gradient echo images at two different inversion times (INV1 and INV2) can generate a T1-weighted image (T1WI) and a quantitative T1-map, which is robust to B1+ inhomogeneity. However, only the first-order term of B1+ inhomogeneity can be cancelled out2.When analyzing functional MRI data, robust cerebral cortex parcellation using structural MRI is essential. Nevertheless at 7T, due to B1+ inhomogeneity in T1WI and T2-weighted images (T2WI) , it is customary to utilize 3T structural images of the same patient, despite not being ideal from the workflow standpoint. To complete experiments at 7T only, parcellation using anatomical 7T images needs to correlate well with those from 3T images, but this is not always the case3,4. The T1-map obtained by MP2RAGE can be used as substitute of T2WI assuming that the two images have similar contrast, but do not always yield favorable results.
To address this problem, we adopted a deep learning approach, namely a type of generative adversarial network (GAN) known as pix2pix5. Pix2pix comprises a generator and discriminator network that compete with each other and has recently gained popularity in generating synthetic realistic images. We aimed to synthesize artifact-free images by training 7T images to match co-registered 3T images of the same patient that suffer less from B1+ inhomogeneities. We hypothesized that synthesized 3T-like image using pix2pix yield similar parcellation results to that conducted using 3T images. We assessed the potential of synthesized images by evaluating the outputs of the parcellation by the structural preprocessing portion of the Human Connectome Project (HCP) Pipeline using two pairs of 7T datasets.
METHODS
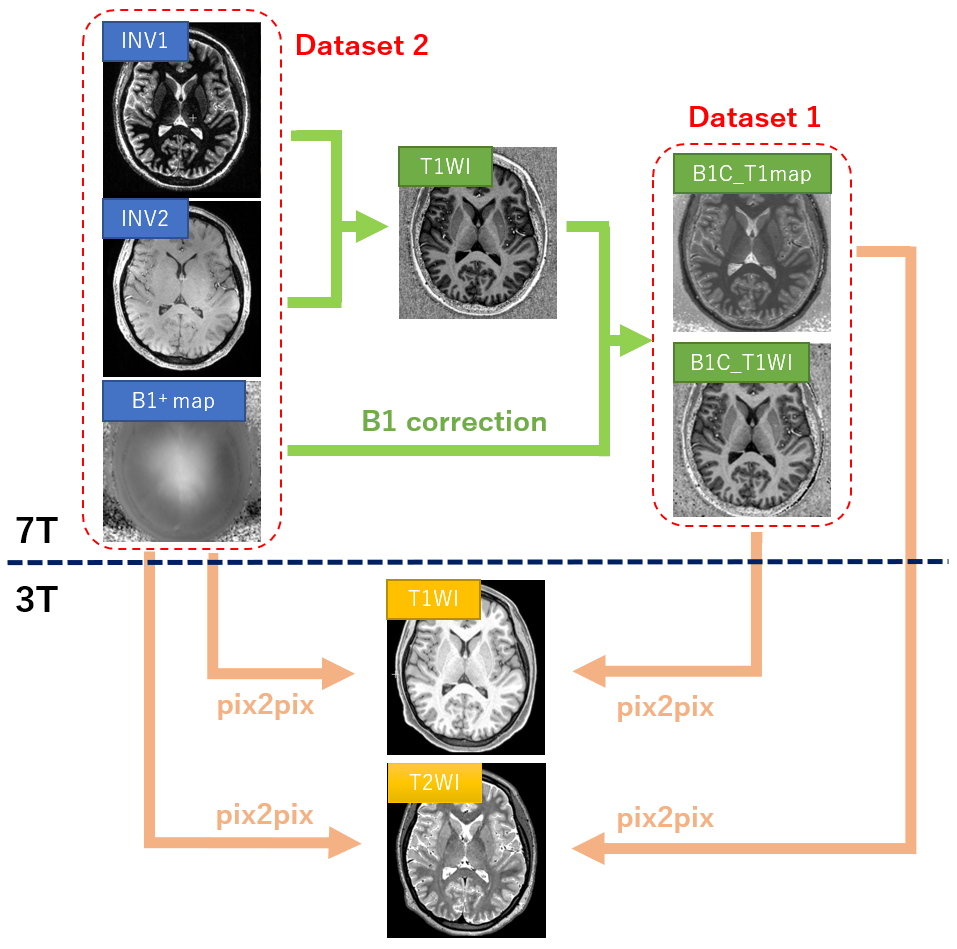
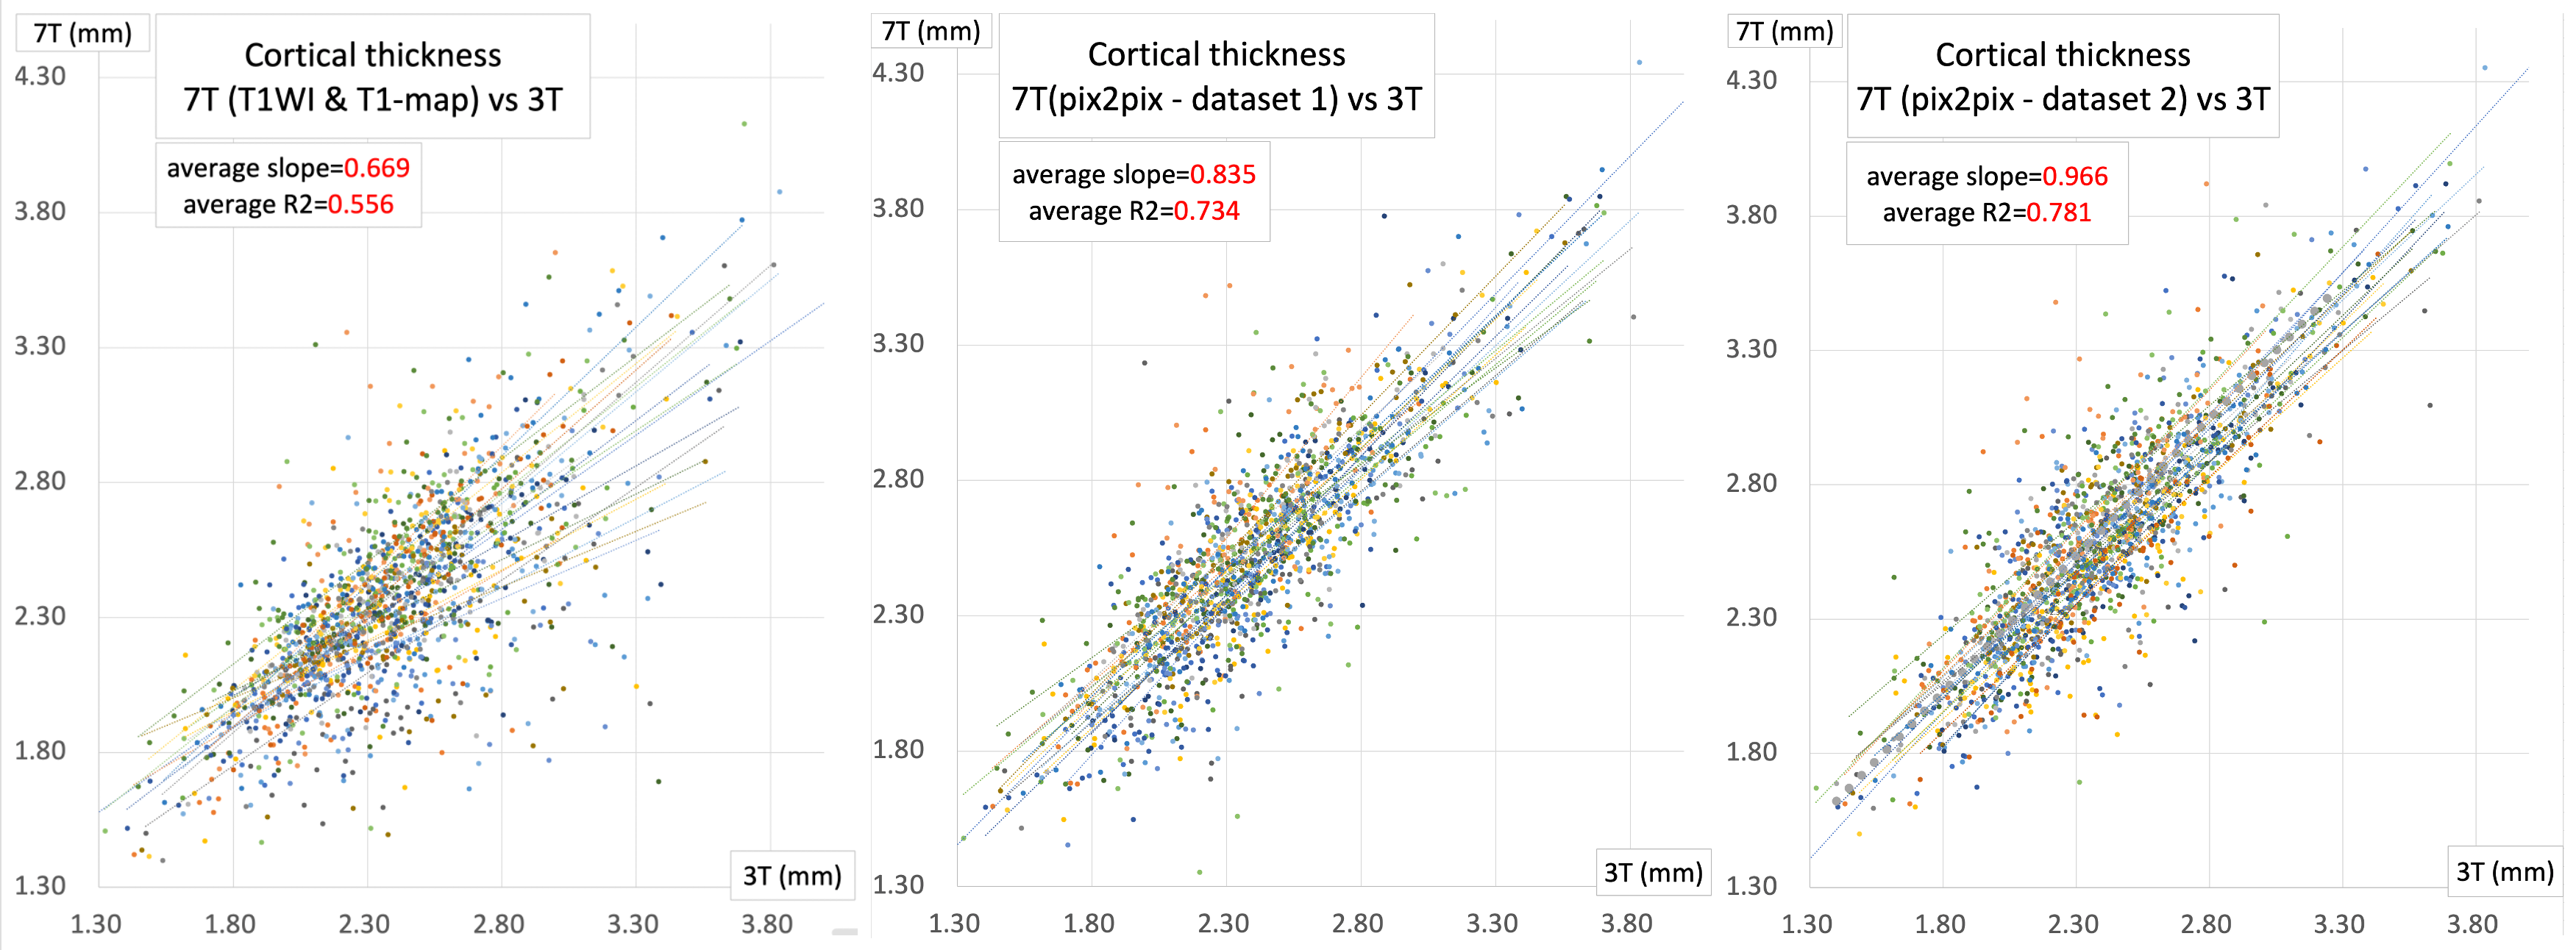
Study protocols were approved by the IRB. Twenty-eight healthy and 12 Parkinson’s disease (PD) patients were recruited for both a 3T and 7T MRI scan. Images from 16 subjects (11 healthy and 5 PD) were used for training and the remaining 24 subjects (17 healthy and 7 PD) were used for testing. For 3T (Skyra; Siemens Healthineers, Erlangen, Germany), 3D-T1WI (MPRAGE: TR/TE/ inversion time [TI] = 2500/2.18/1000ms, FA = 8°, parallel factor [PF] = 2) and 3D-T2WI (SPACE: TR/TE = 3200/564ms, FA = T2 variable, PF = 2) were acquired at 0.8mm isotropic resolution. For 7T (Magnetom7T; research prototype, Siemens Healthineers), MP2RAGE (research sequence; TR/TE/TI1/TI2 = 6000/2.9/2700/800ms, FA1/FA2 = 4°/5°, PF = 3) was used to acquire images of T1WI and T1-map and those at TI1 (INV1) and TI2 (INV2) at 0.7mm isotropic resolution. For B1+-map, Sa2RAGE (research sequence; TR/TE/ TI1/TI2 = 2400ms/0.88ms/50ms/1800ms, FA1/FA2 = 4/10°, PF =3) was used. The 3T images were co-registered and resampled to match 7T images using Statistical Parametric Mapping6.For training with pix2pix, two 7T input datasets were prepared: dataset 1 (T1WI and T1-map after B1+ correction2) and dataset 2 (INV1, INV2 and B1+-map) as input. For each dataset, co-registered 3T T1WI and T2WI were used as output (Figure 1). Both training and inference were performed on axial, coronal and sagittal images separately, for a total of 7099 images. The network architecture used for pix2pix was Res-Net with 9 blocks as generator and Patch-GAN as discriminator. The Adam solver was used with the following parameters; weighting factor for L1 loss (lambda) = 10000, learning rate = 0.0002, momentum parameters β =0.5 and β =0.999. The network was trained for 200 epochs on a NVIDIA RTX 3080Ti GPU, which took approximately 8 hours. The three output volumes for each axis were averaged to obtain the final synthetic inferred volume. The structural preprocessing portion of the HCP Pipeline was executed for the original 7T images (T1WI and T1-map) and the two inferred 7T images from datasets 1 and 2. Cortical thicknesses of each parcellated area of 7T images were plotted against that of 3T images, and linear regression analysis was performed. The average slope and its standard deviation (SD), the coefficient of determination (R2) and its SD, were evaluated.
RESULTS
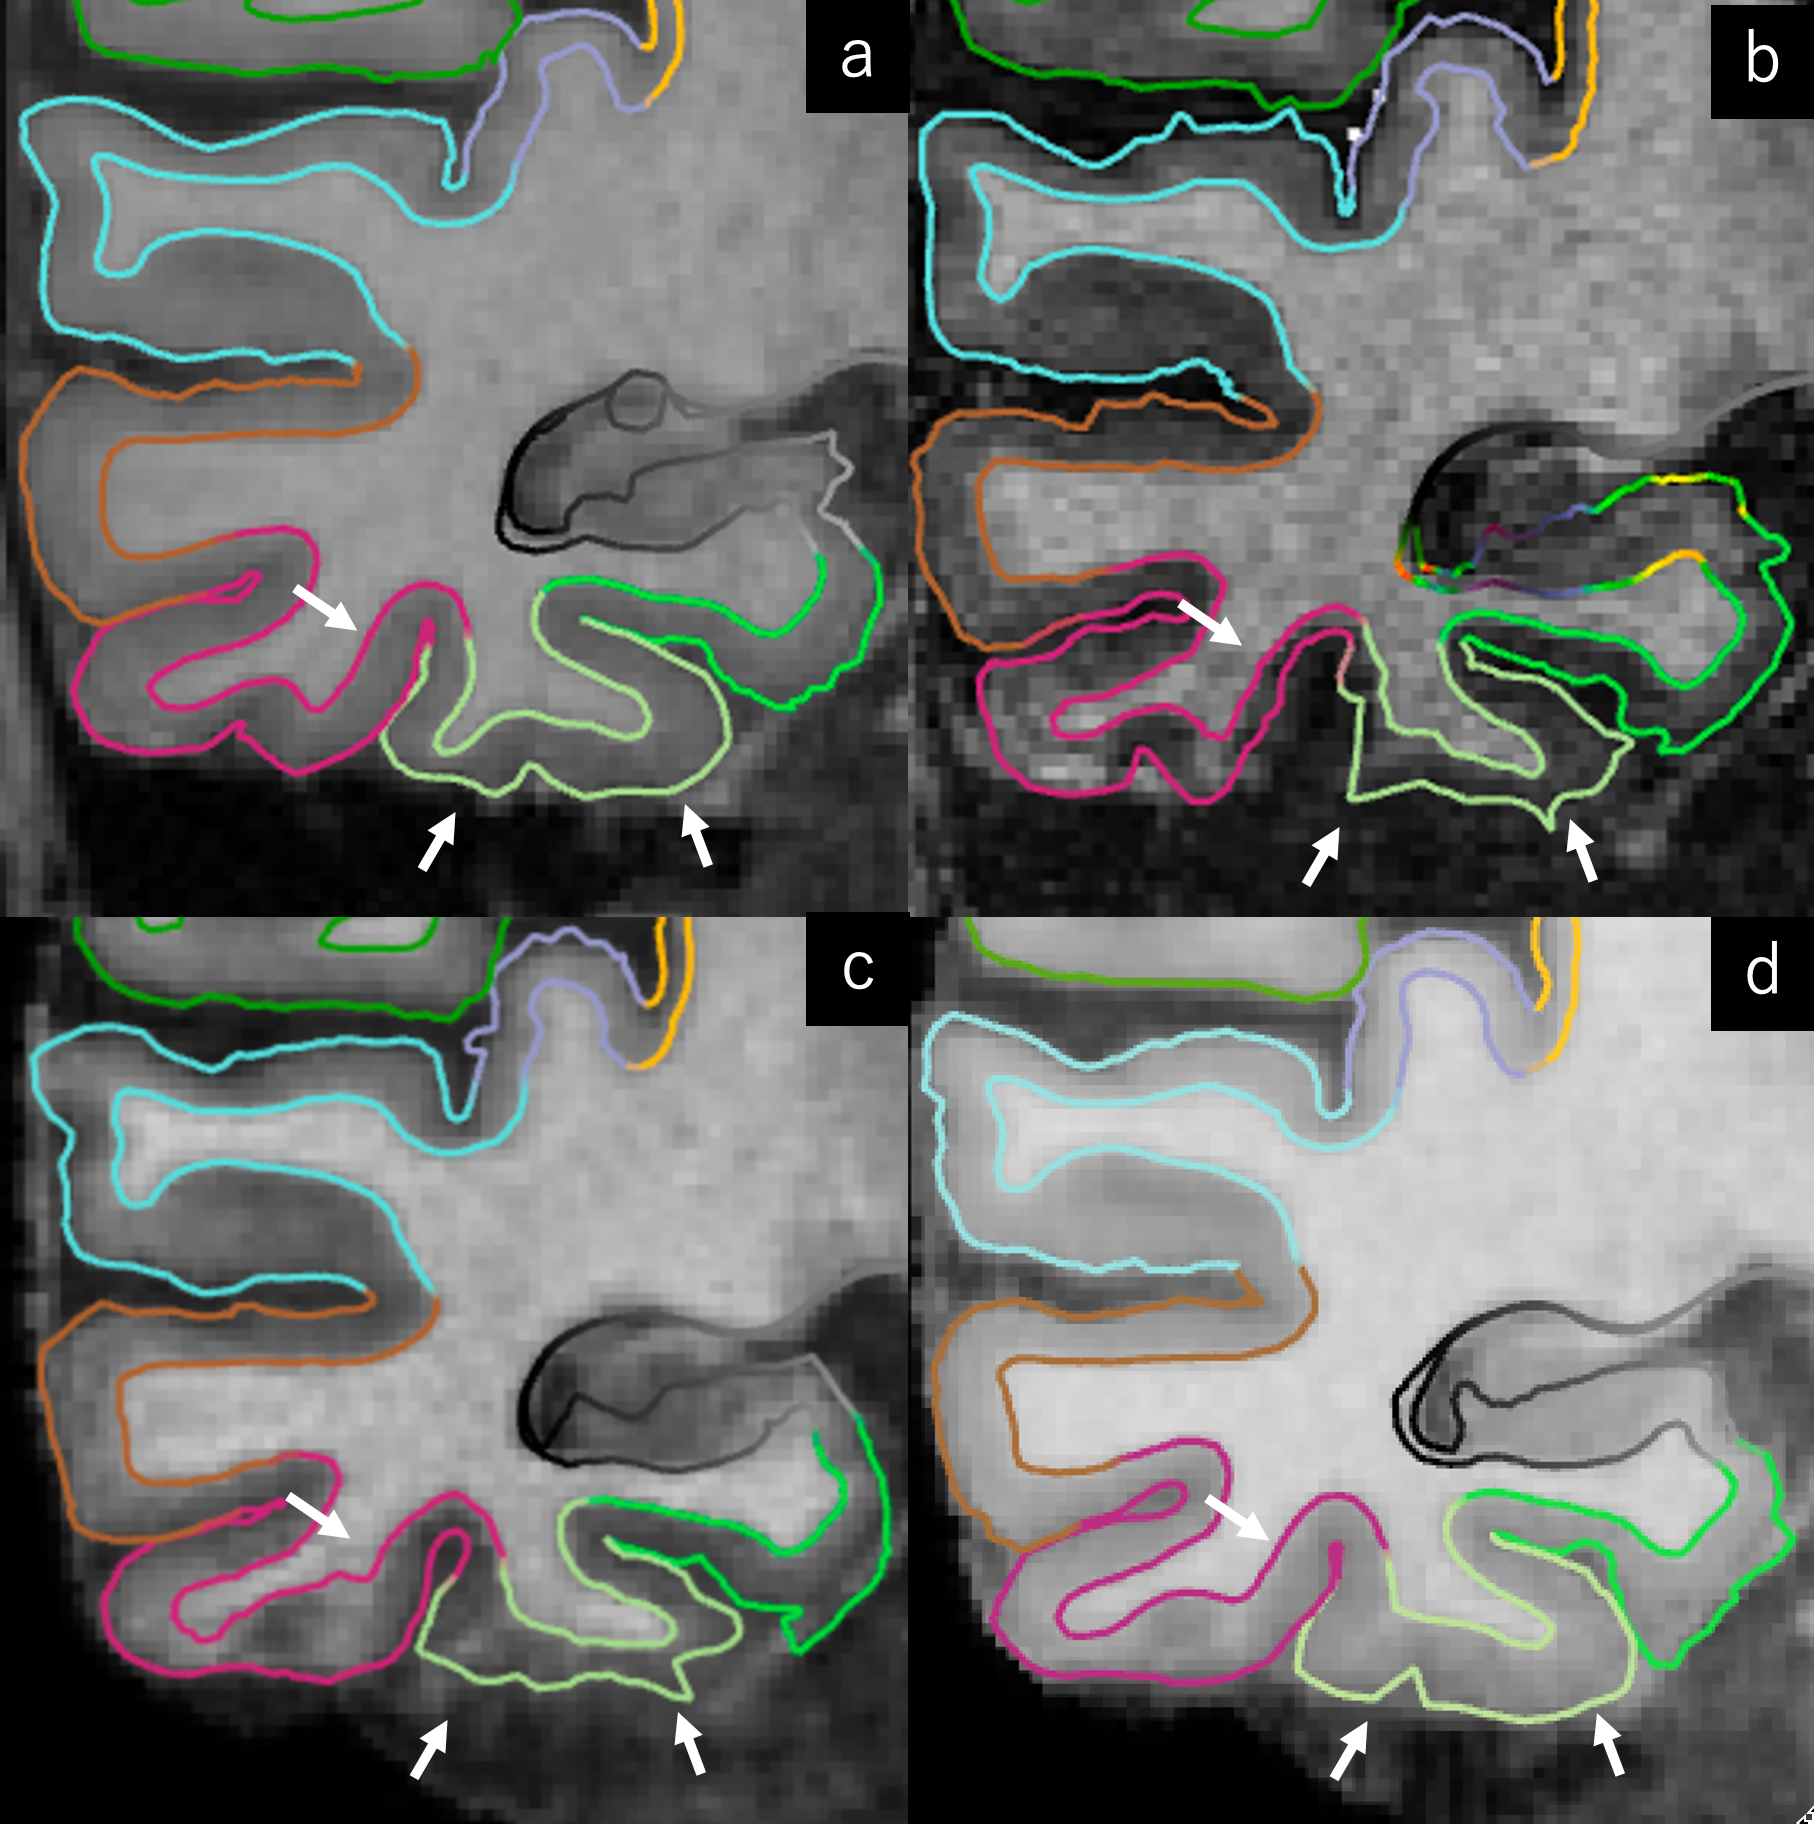
The average slopes (± SD) of the regression lines for original, dataset 1 and dataset 2 were 0.669 ± 0.160, 0.835 ± 0.087 and 0.966 ± 0.079, respectively. The R2 values were 0.556 ± 0.144, 0.734 ± 0.125 and 0.781 ± 0.077, respectively (Figure 2). Representative parcellation results at the left temporal lobe are presented in Figure 3.DISCUSSION
Previous studies show that the estimated cortical thickness with 7T images tend to be a little thinner than that with 3T images7,8. Our results using the original 7T images were in concordance with these results. Cortical thickness using pix2pix-generated images were closer to that of 3T. The better R2 values of generated images indicate that the cortical thickness and parcellation results were more consistent among subjects. The 3T-like images generated from INV1, INV2 and B1+ map, demonstrated the best results.CONCLUSION
Pix2pix-generated images using anatomical 7T images as input showed better parcellation results with the HCP Pipeline. This method may enable researchers to perform experiments on 7T MRI with higher accuracy, without the need of 3T images.Acknowledgements
This work was supported grants from AMED (21dm0307102h0003) and Siemens Healthcare KK, Japan.
References
1. Bottomley, P. A. & Andrew, E. R. RF magnetic field penetration, phase shift and power dissipation in biological tissue: Implications for NMR imaging. Phys. Med. Biol. 23, (1978).
2. Marques, J. P. et al. MP2RAGE, a self bias-field corrected sequence for improved segmentation and T1-mapping at high field. Neuroimage 49, 1271–1281 (2010).
3. Glasser, M. F. et al. A multi-modal parcellation of human cerebral cortex. Nature 536, 171–178 (2016).
4. Destrieux, C., Fischl, B., Dale, A. & Halgren, E. Automatic parcellation of human cortical gyri and sulci using standard anatomical nomenclature. Neuroimage 53, (2010).
5. Isola, P., Zhu, J. Y., Zhou, T. & Efros, A. A. Image-to-image translation with conditional adversarial networks. Proc. - 30th IEEE Conf. Comput. Vis. Pattern Recognition, CVPR 2017 2017-Janua, 5967–5976 (2017).
6. Statistical Parametric Mapping (https://www.fil.ion.ucl.ac.uk/spm/).
7. Fujimoto, K. et al. Quantitative comparison of cortical surface reconstructions from MP2RAGE and multi-echo MPRAGE data at 3 and 7T. Neuroimage 90, 60–73 (2014).
8. Lüsebrink, F., Wollrab, A. & Speck, O. Cortical thickness determination of the human brain using high resolution 3T and 7T MRI data. Neuroimage 70, 122–131 (2013).
Figures