4346
High-quality Reconstruction of Volumetric Diffusion Kurtosis Metrics via Residual Learning Network and Perceptual Loss1Center for Brain Imaging Science and Technology, College of Biomedical Engineering and Instrumental Science, Zhejiang University, HANGZHOU, China, 2Research Center for Healthcare Data Science, Zhejiang Lab, HANGZHOU, China, 3Department of Imaging Sciences, University of Rochester, Rochester, NY, United States
Synopsis
This study proposed a novel 3D residual network to learn end-to-end reconstruction from as few as eight DWIs to volumetric DKI parameters. The weighted loss function combining perceptual loss is utilized, which helps the network capture in-depth feature of DKI parameters. The results show that our method achieves superior performance over state-of-the-art methods for providing accurate DKI parameters as well as preserves rich textural details and improves the visual quality of reconstructions.
Introduction
In diffusion kurtosis imaging (DKI), the accurate estimation of quantitative metrics usually necessitates the acquisition of high-quality diffusion-weighted (DW) images with multiple b-shells distributed at around 30 or more diffusion directions. Furthermore, its data processing is complex and susceptible to imaging imperfections, resulting in significant artifacts1. The application of DKI in routine clinics is thus limited due to the challenges of data acquisition and processing. Recently, there have been attempts using deep-learning based approaches for q-space acceleration and reliable mapping of quantitative metrics in diffusion MRI2-4. The voxel-wise FCN2 is slow and prone to be sensitive to noisy and implausible voxels. The 2D CNN-based networks5,6 to reconstruct some of DTI metrics ignore inter-slice correlation and the crucial 3D spatial context of DWI signals4. The value of deep learning in dMRI was demonstrated by these current techniques, whereas reconstructed quantitative mappings were often over-smoothed and lacked sharp details, such as tissue boundaries. It is also worth noting that the partial loss of small regions usually happens in very deep networks due to the degradation problem.In this work, we proposed a 3D residual network for end-to-end volumetric diffusion kurtosis metrics reconstruction, in which a weighted loss function approach by combining perceptual loss was used to capture in-depth features and refine the visual quality of DKI metrics. Experimental results show that our method outperforms state-of-the-art methods and can reconstruct all DKI measures with sharp details and accurate mapping of complex brain structure using as few as eight DWIs.
Methods
Datasets.Diffusion MRI data consisted of 50 subjects in total were randomly selected from the HCP repository7, among which 40 were used for training, and the other 10 for testing and evaluation. For each dataset, including 18 b0 images and 90 DWIs of b=1000, 2000 s/mm2 respectively (i.e., 196 DWIs), a b0 signal correction1 was employed and a constrained weighted linear least square method was used for best fitting.
Network implementation and training.
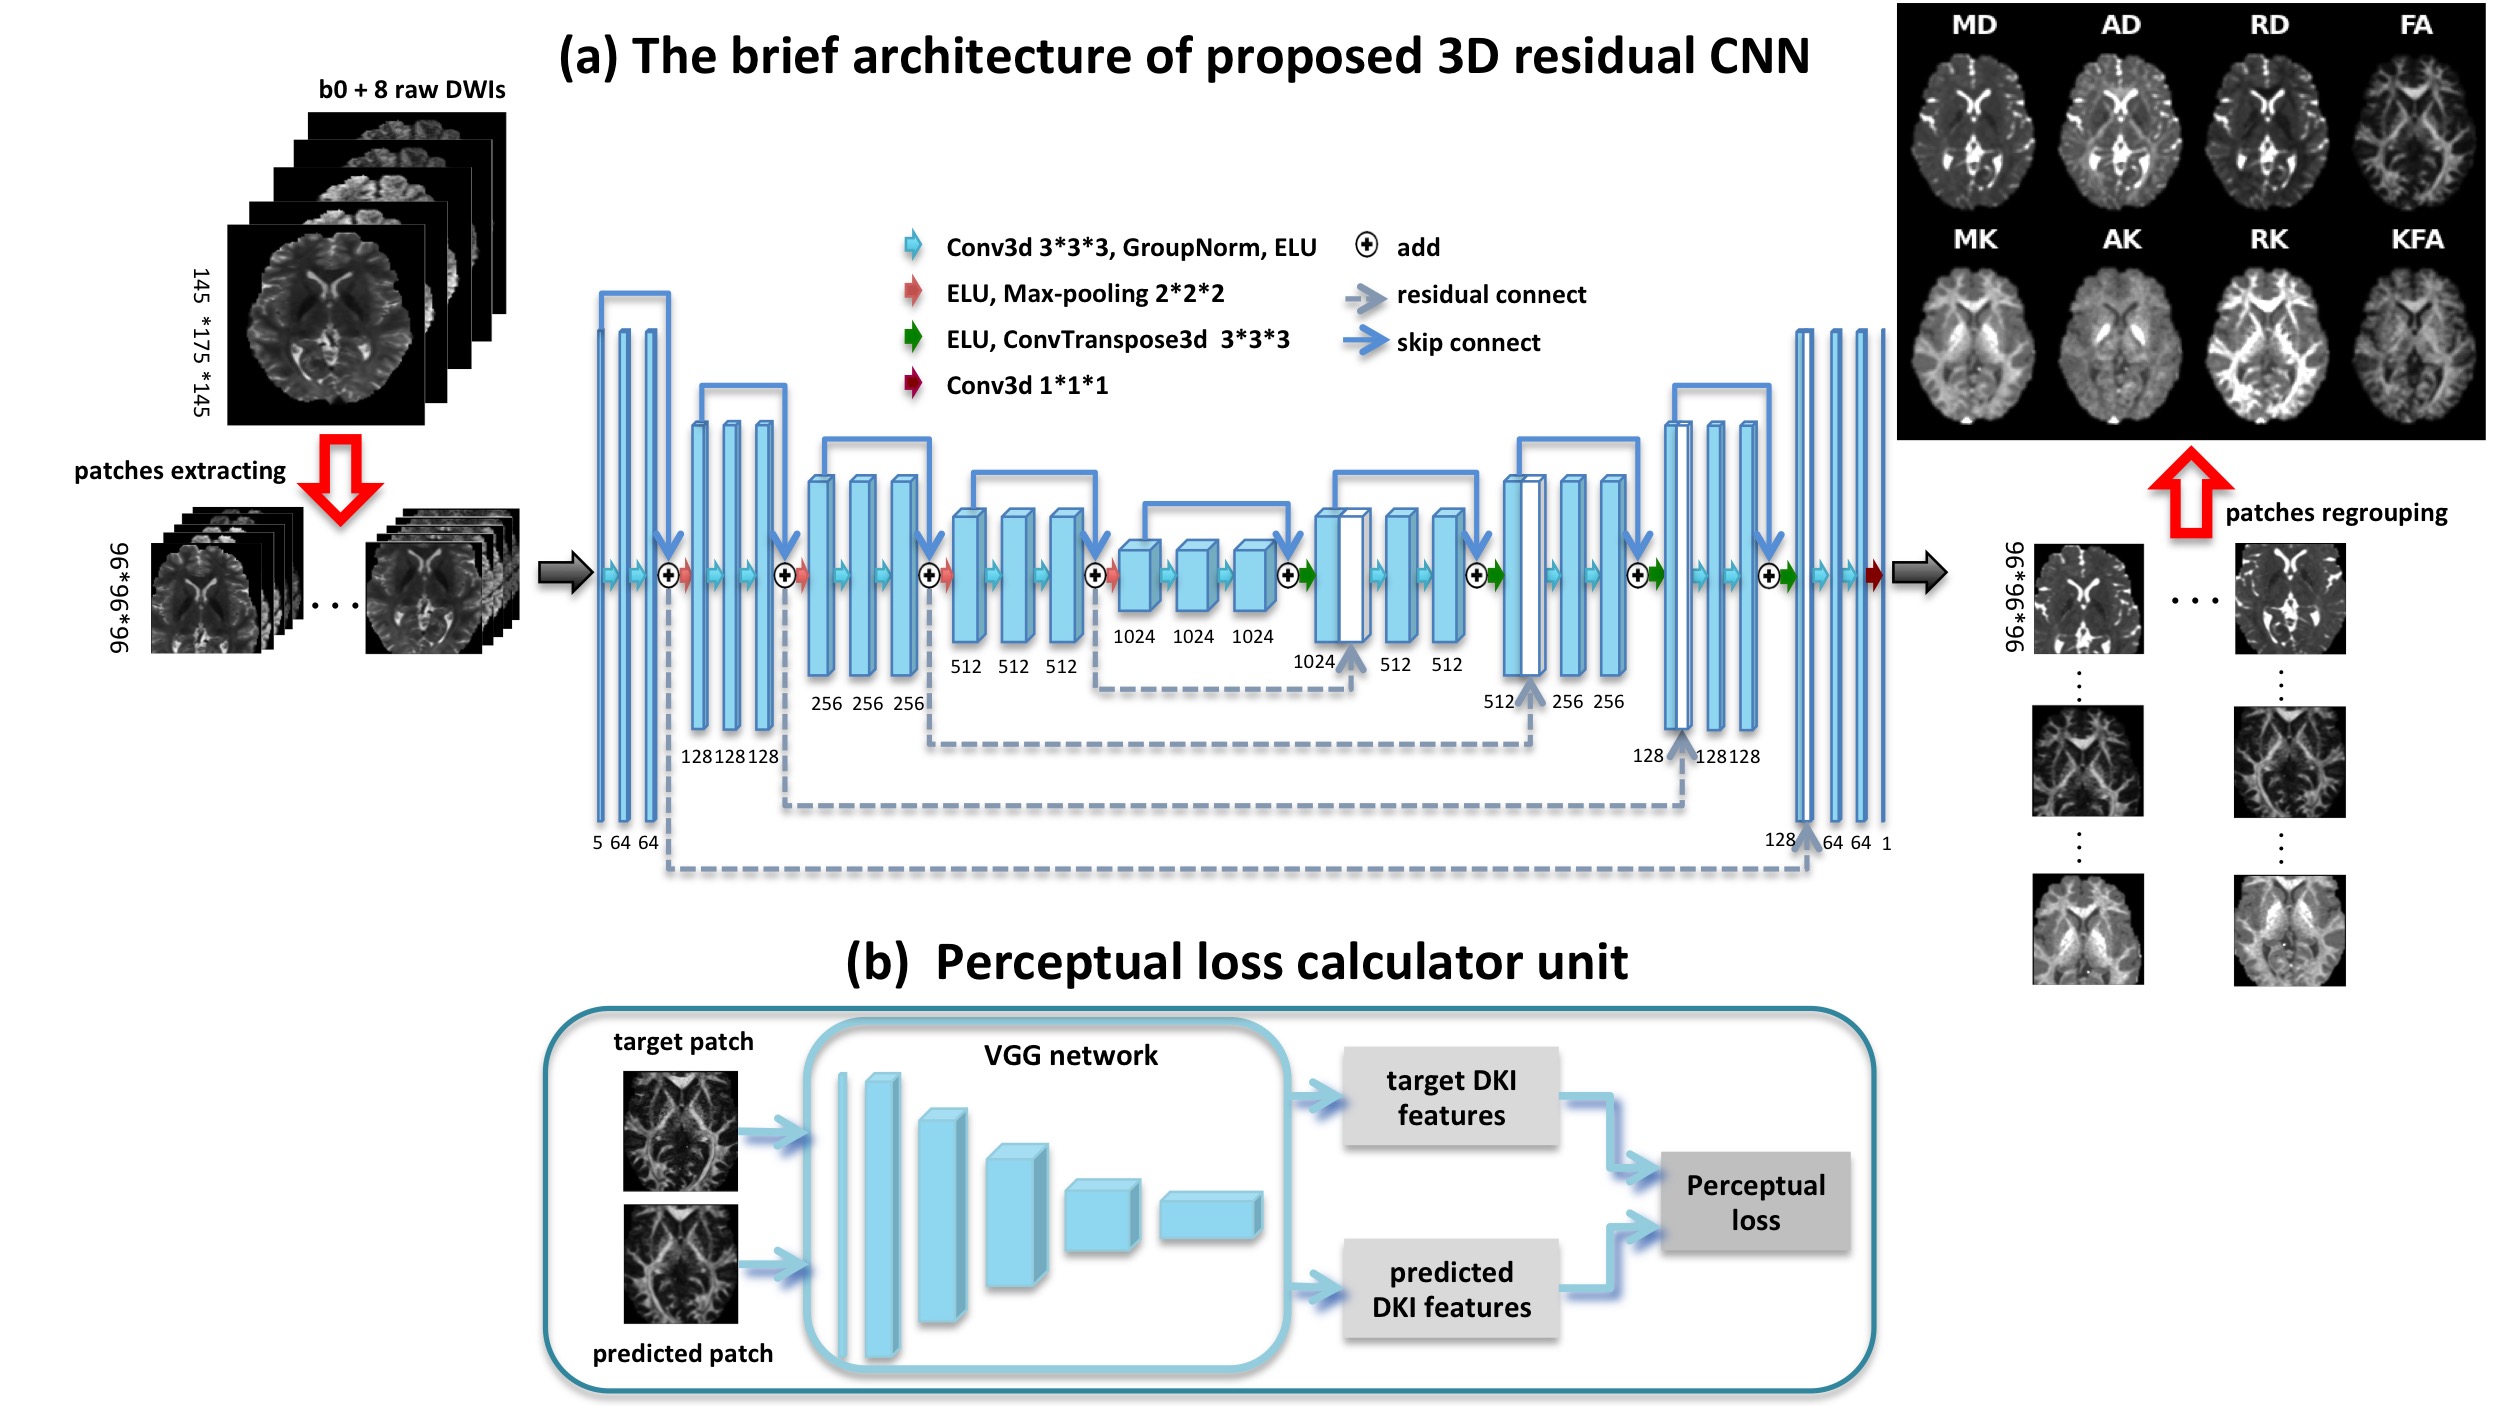
Our network (Figure 1(a)) is a variant of the widely used U-Net. While beyond encoder-decoder architecture, we made several significant improvements by adding a residual skip connection to each module8, thus making every path from the network’s input to its output a residual sub-network. Since training deep learning model on volumetric images pose memory issues, a patch-based approach was used in this study9.
A weighted loss function was adopted to optimize the metrics of the proposed network. We used the weighted MSE loss to minimize the loss between the predicted DKI metric and the ground truth; moreover, the weighted perceptual loss (VGG loss)10 was added to minimize the distance to the target in some feature space as to refine the network output. The loss function can be formulated as:
$$\mathcal{L}=\alpha \mathcal{L}_{M S E}+\beta \mathcal{L}_{V G G} \tag{eq. 1}$$$$\mathcal{L}_{M S E}=\frac{1}{2 N} \sum_{i=1}^{N}\left\|x_{i}^{G T}-x_{i}^{\text{pred}}\right\|^{2} \tag{eq. 2}$$$$\mathcal{L}_{V G G}=\frac{1}{2 N}\left\|f_{V G G}\left(x_{i}^{G T}\right)-f_{V G G}\left(X_{i}^{\text{pred}}\right)\right\|\tag{eq. 3}$$
where $$${x_{i}}^{GT}$$$ and $$${x_{i}}^{pred}$$$ are the ground truth and predicted patches, respectively, and $$$f_{VGG}$$$ denotes VGG feature maps. The perceptual loss calculator unit has been showed in Figure 1(b).
All experiments were implemented in Python 3.8.7 using Pytorch 1.7.1. Patch size 96x96x96 was performed with the balance of the memory limitation and training time. Data augmentation was done on-the-fly. We ran 15000 training iterations on an NVIDIA V100 GPU.
Network evaluation.
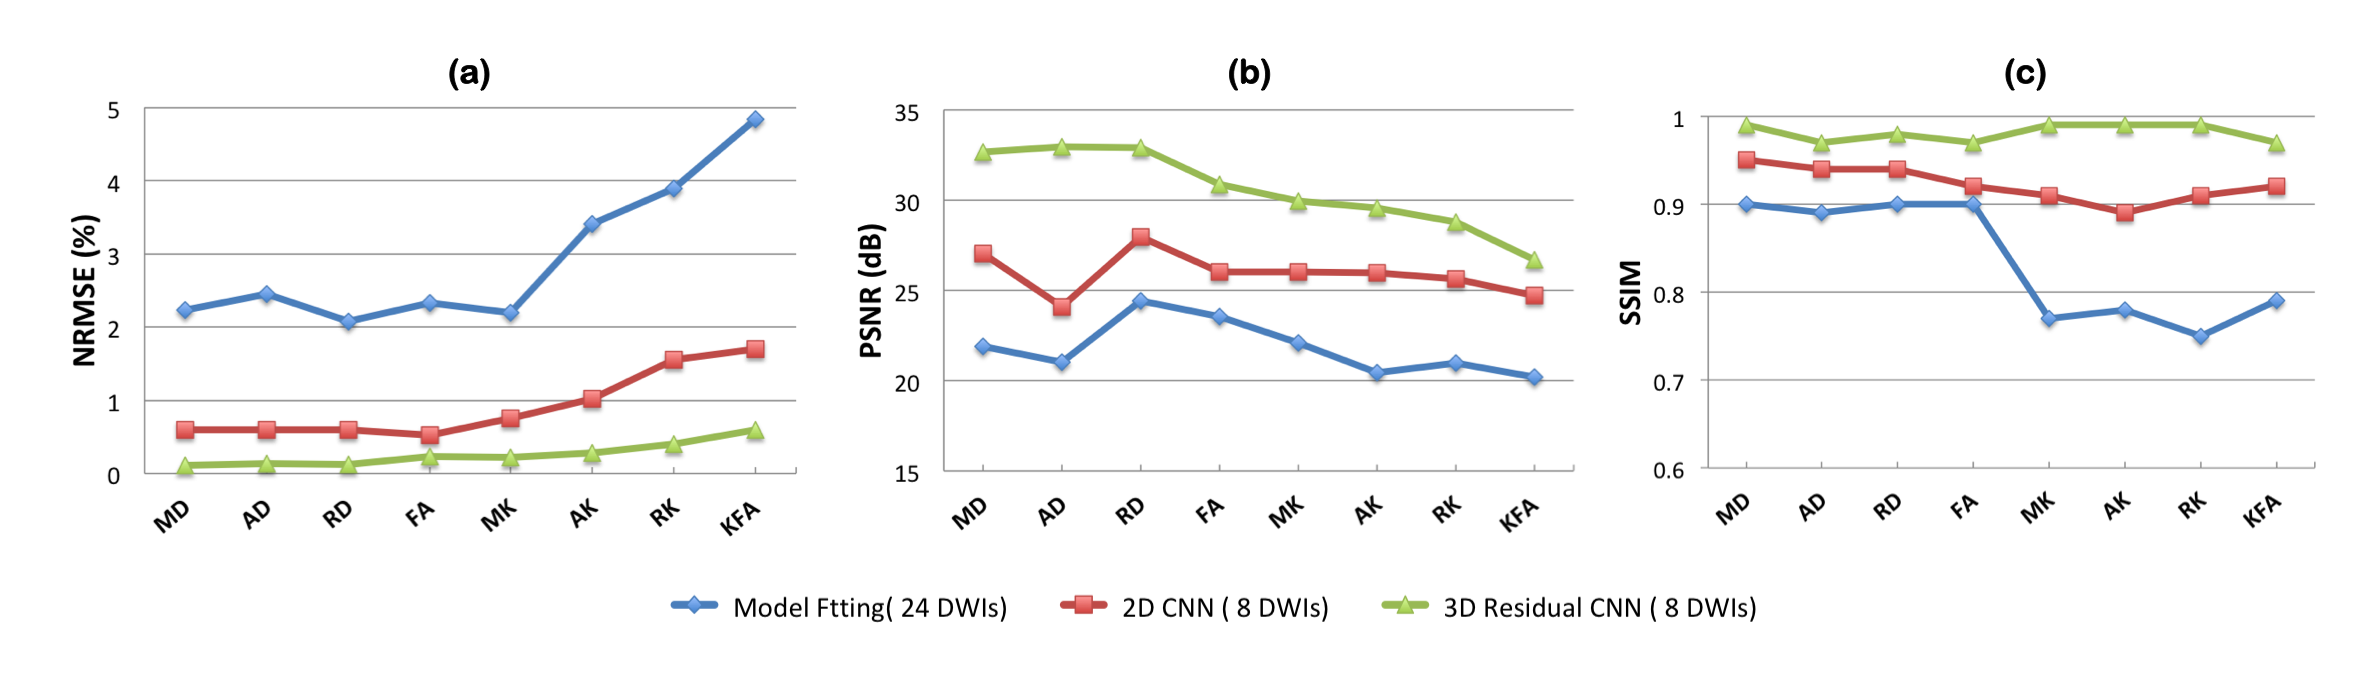
For evaluation of the resultant maps, the normalized root mean squared error (NRMSE), peak signal to noise ratio (PSNR) and structural similarity (SSIM) within the entire brain mask were computed.
Results and Discussion
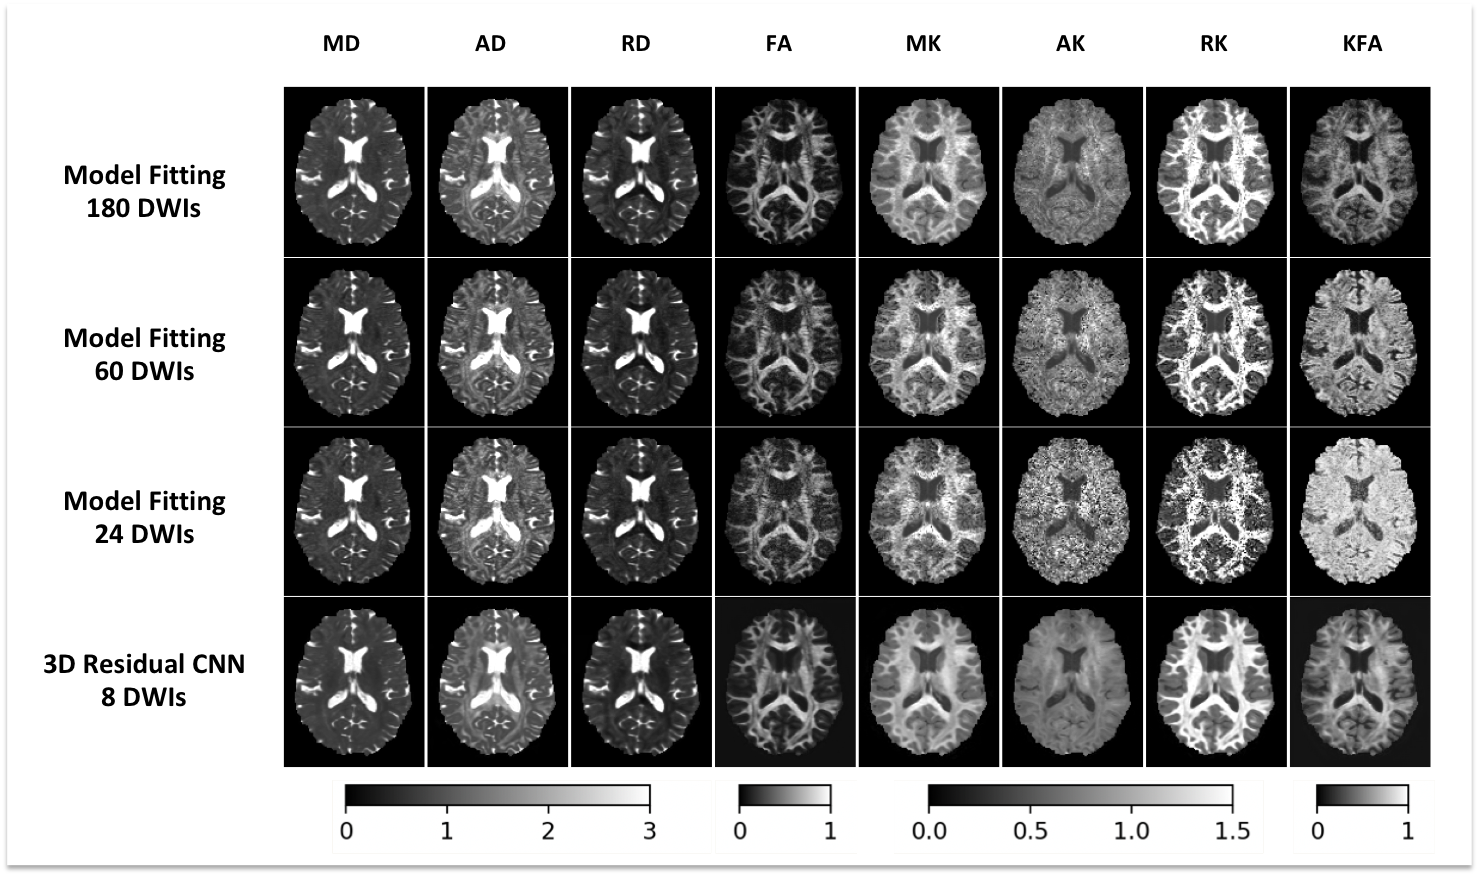
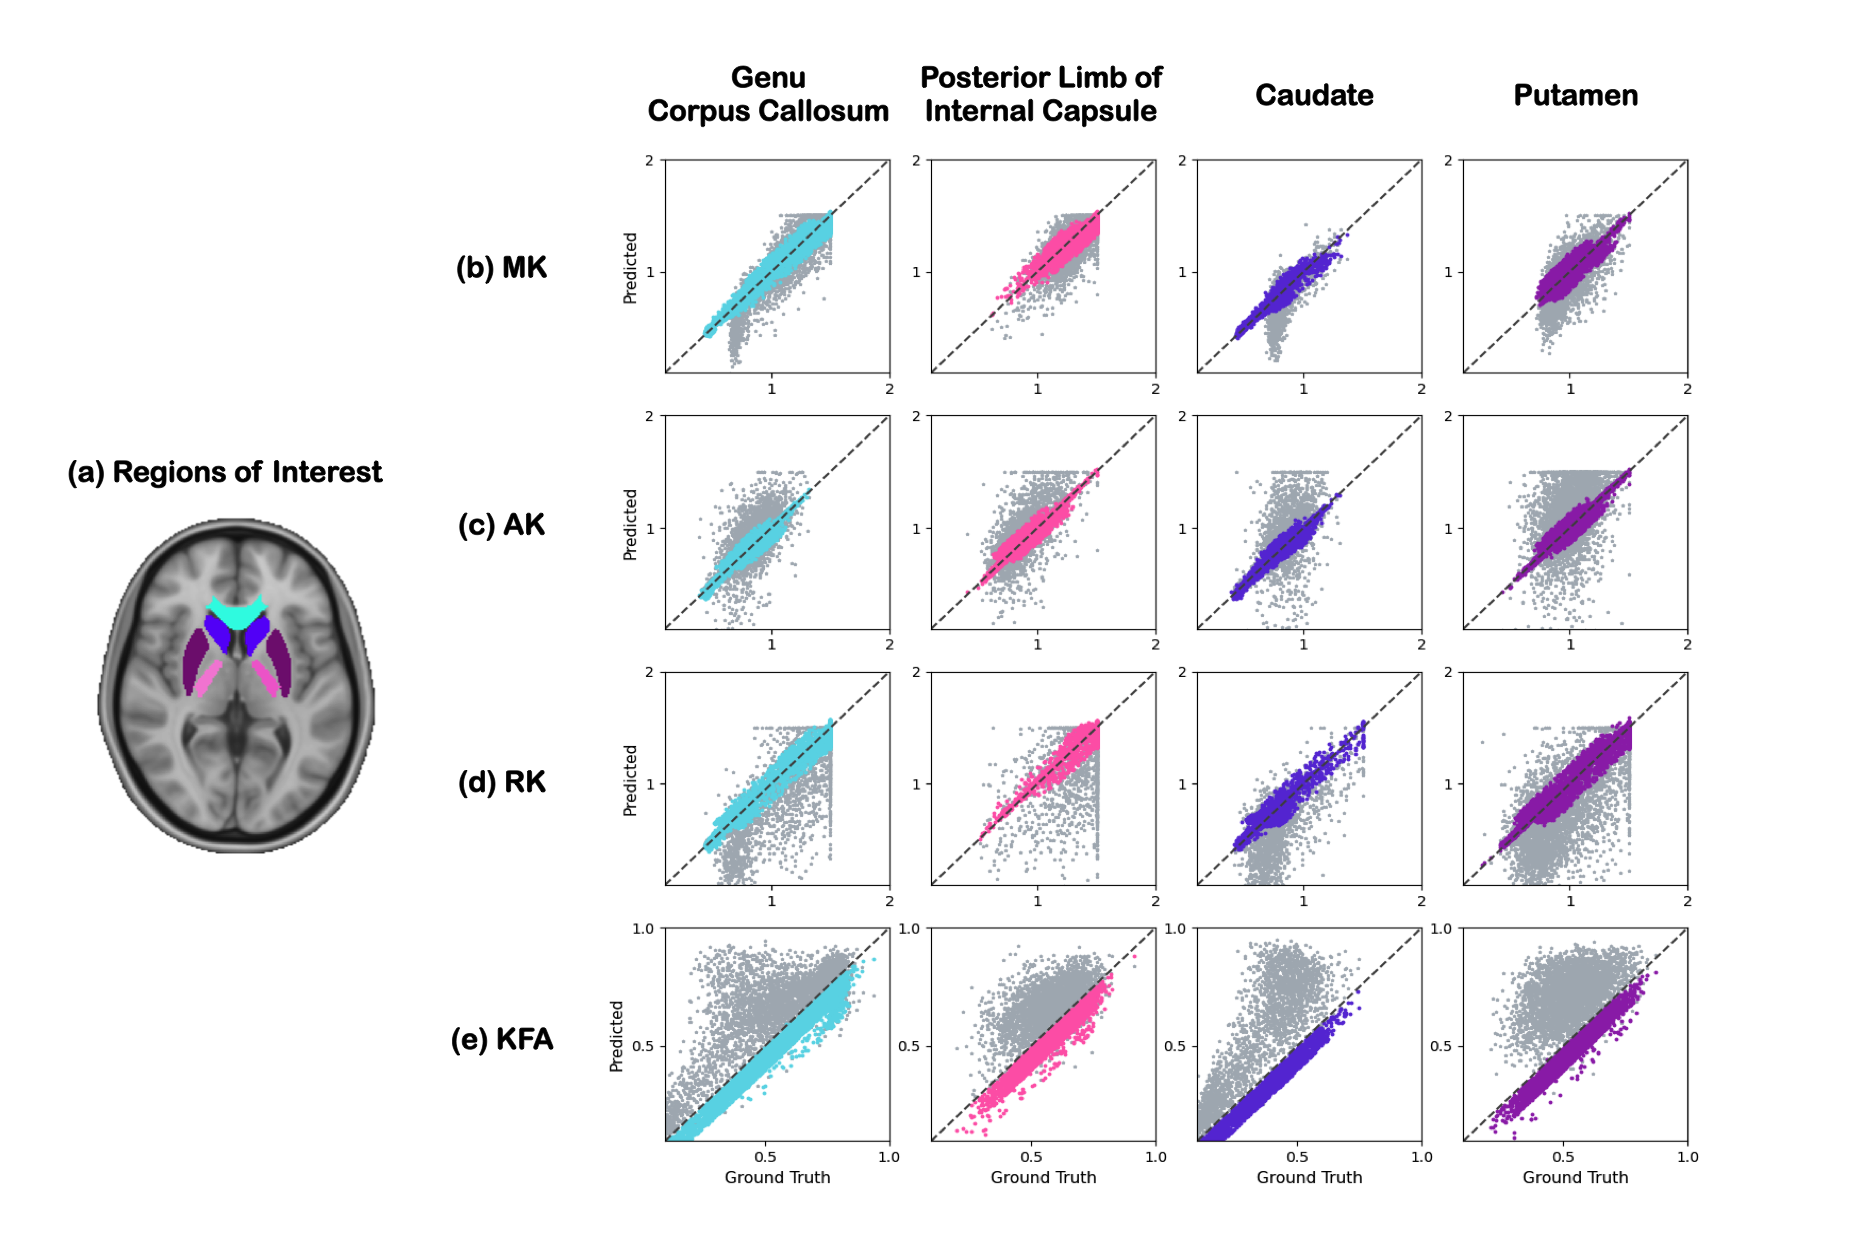
Compared to MFit, the proposed method with 8 DWIs provides similar mapping quality to the ground truth derived by MFit with 180 DWIs. More importantly, it significantly outperforms MFit with 60 DWIs and 24 DWIs (figure 2).Figure 3 shows voxel-wise comparisons of high-order kurtosis indices in both WM regions and GM regions from a representative subject. Our proposed method produces accurate mapping values (in color) that are highly correlated with ground truth derived from MFit with 180 DWIs. In contrast, the results of MFit with 48 DWIs are shown in gray color and deviate from the expected values.
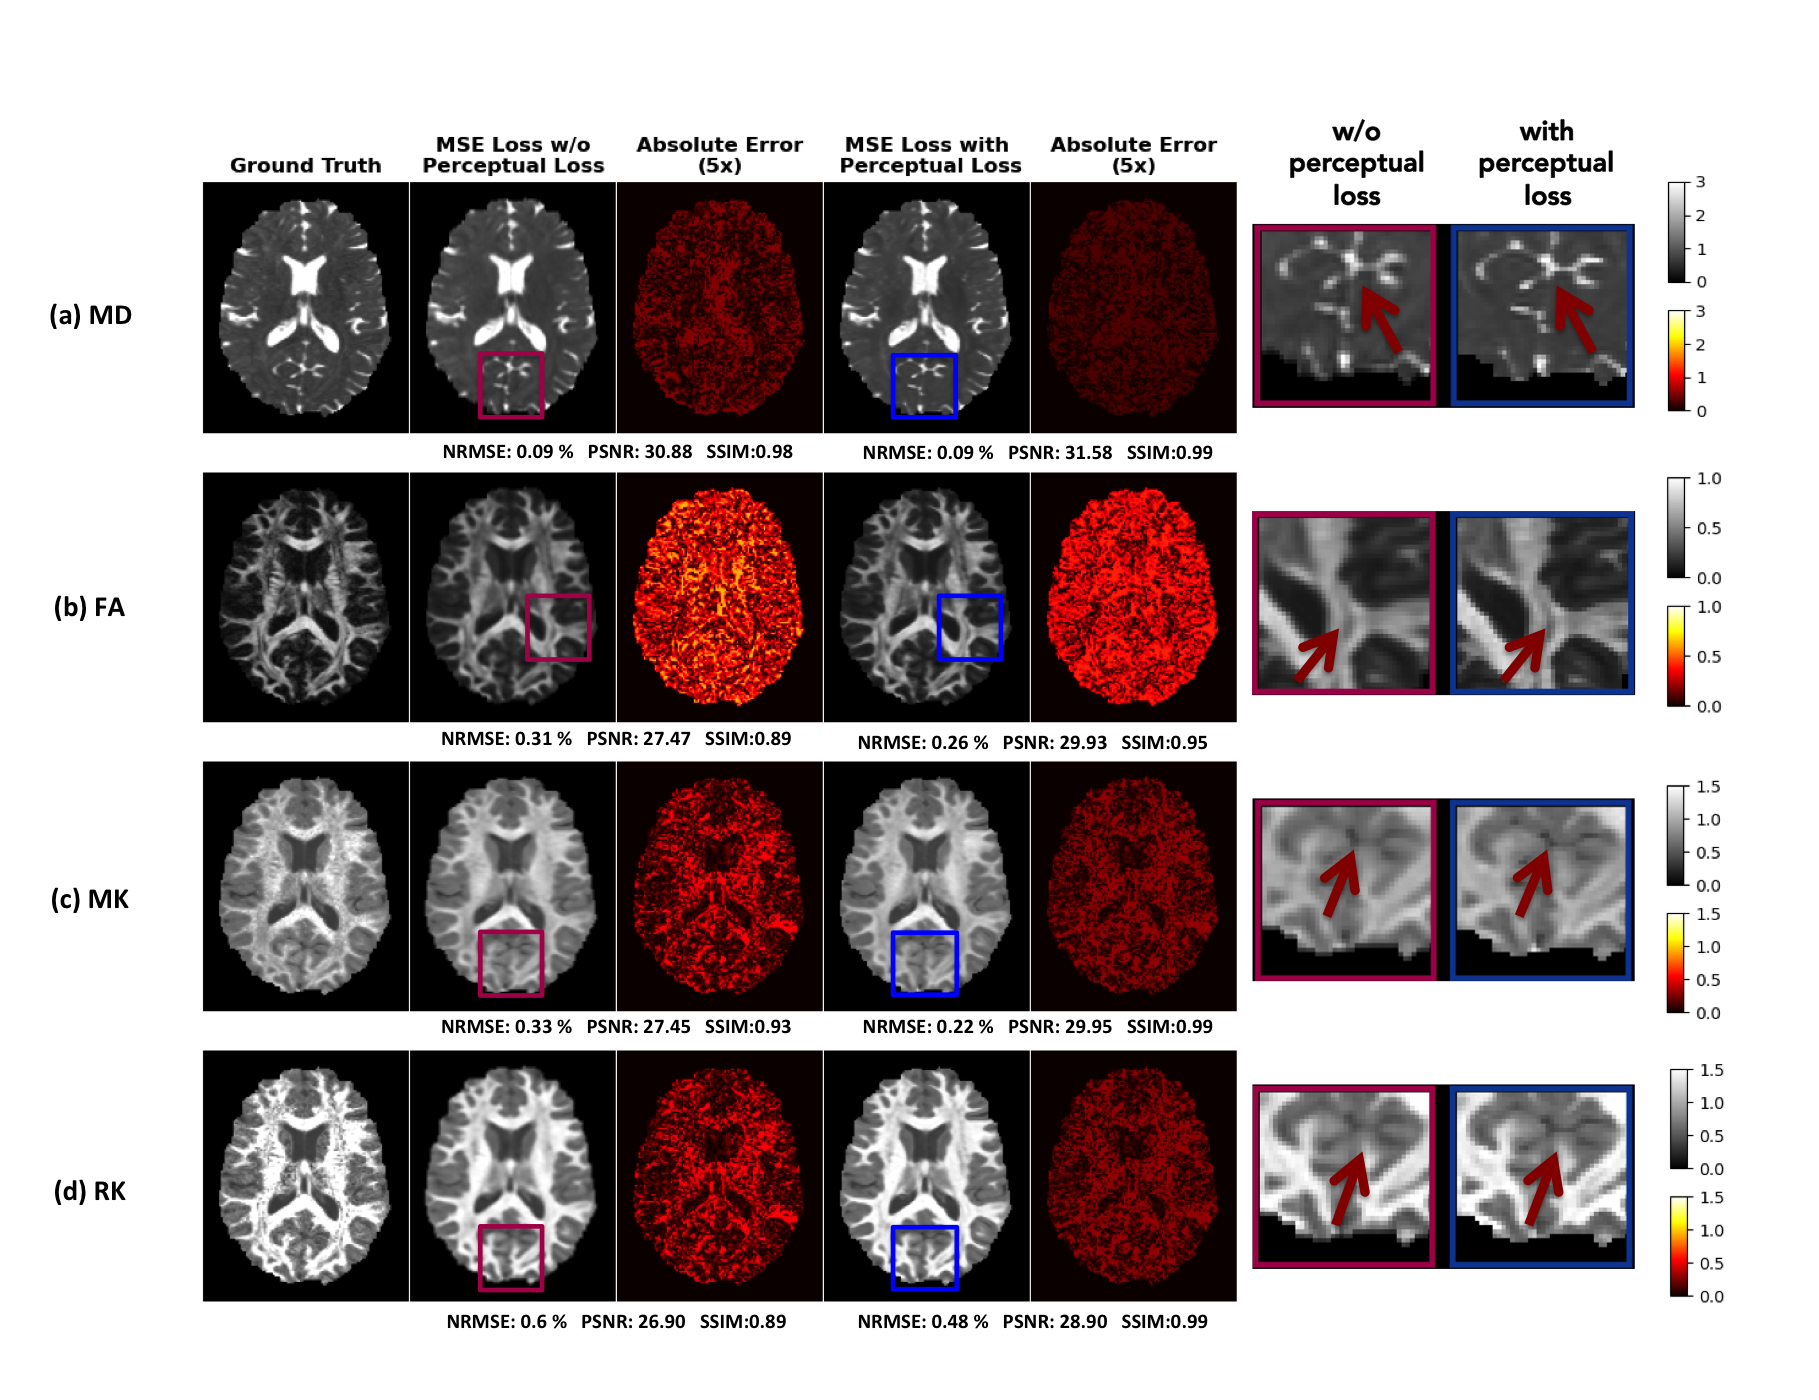
Figure 4 shows the reconstructions by a weighted loss function, combining MSE loss with perceptual loss, appear sharper with better contrast and achieve significantly higher PSNR and SSIM than conventional MSE loss without perceptual loss while still maintaining low NRMSE, which indicate that the details are clearly visible in the reconstructions.
Figure 5 shows the quantitative evaluation for all DKI metrics of the test cohort. Compared to MFit with 24 DWIs, 2D CNN with 8 DWIs, we have performed the lowest NRMSE and best in terms of PSNR, SSIM.
Conclusion
This work proposed a novel 3D residual learning network using the MSE loss function with perceptual loss function for fully volumetric end-to-end DKI reconstruction from as few as 8 DWIs. The results show that DKI metrics reconstructed by our method can provide the best evaluation score among all compared methods. Meanwhile, the method can improve the visual quality of DKI reconstructions with sharp details and provide accurate quantitative mapping for complex structures, such as internal capsule and subcortical regions.Acknowledgements
This work was supported by the National Key R&D Program of China (2020AAA0109500), the National Natural Science Foundation of China (81871428) and the Fundamental Research Funds for the Central Universities (2021FZZX002-19).References
[1] F. Zhang, L. Ning, L. J. O’Donnell, and O. Pasternak, “MK-curve - Characterizing the relation between mean kurtosis and alterations in the diffusion MRI signal,” Neuroimage, vol. 196, no. June 2018, pp. 68–80, 2019.
[2] V. Golkov et al., “q-Space Deep Learning: Twelve-Fold Shorter and Model-Free Diffusion MRI Scans,” IEEE Trans. Med. Imaging, vol. 35, no. 5, pp. 1344–1351, 2016.
[3] Z. Lin et al., “Fast learning of fiber orientation distribution function for MR tractography using convolutional neural network,” Med. Phys., vol. 46, no. 7, pp. 3101–3116, 2019.
[4] Z. Li et al., “Fast and Robust Diffusion Kurtosis Parametric Mapping Using a Three-Dimensional Convolutional Neural Network,” IEEE Access, vol. 7, pp. 71398–71411, 2019.
[5] H. Li et al., “SuperDTI: Ultrafast DTI and fiber tractography with deep learning,” Magn. Reson. Med., no. March, pp. 1–14, 2021.
[6] E. Aliotta, H. Nourzadeh, and S. H. Patel, “Extracting diffusion tensor fractional anisotropy and mean diffusivity from 3-direction DWI scans using deep learning,” Magn. Reson. Med., vol. 85, no. 2, pp. 845–854, 2021.
[7] D. C. Van Essen, S. M. Smith, D. M. Barch, T. E. J. Behrens, E. Yacoub, and K. Ugurbil, “The WU-Minn Human Connectome Project: An overview,” Neuroimage, vol. 80, pp. 62–79, 2013.
[8] K. Lee, J. Zung, P. Li, and H. S. Seung, “Superhuman Accuracy on the SNEMI3D Connectomics Challenge arXiv : 1706 . 00120v1 [ cs . CV ] 31 May 2017,” no. Nips, pp. 1–11, 2017.
[9] K. Ghimire, Q. Chen, and X. Feng, “Patch-Based 3D UNet for Head and Neck Tumor Segmentation with an Ensemble of Conventional and Dilated Convolutions,” in Head and Neck Tumor Segmentation, 2021, pp. 78–84.
[10] M. Seitzer et al., “Adversarial and perceptual refinement for compressed sensing MRI reconstruction,” Lect. Notes Comput. Sci. (including Subser. Lect. Notes Artif. Intell. Lect. Notes Bioinformatics), vol. 11070 LNCS, pp. 232–240, 2018.
Figures