4341
Differentiation between glioblastoma and solitary brain metastasis using mean apparent propagator-MRI: a Radiomics analysis
Xiaoyue Ma1, Guohua Zhao1, Eryuan Gao1, Jinbo Qi1, Kai Zhao1, Ankang Gao1, Jie Bai1, Huiting Zhang2, Xu Yan2, Guang Yang3, and Jingliang Cheng1
1The Department of Magnetic Resonance Imaging, The First Affiliated Hospital of Zhengzhou University, Zhengzhou, China, 2MR Scientific Marketing, Siemens Healthineers, Shanghai, China, 3Shanghai Key Laboratory of Magnetic Resonance, East China Normal University, Shanghai, China
1The Department of Magnetic Resonance Imaging, The First Affiliated Hospital of Zhengzhou University, Zhengzhou, China, 2MR Scientific Marketing, Siemens Healthineers, Shanghai, China, 3Shanghai Key Laboratory of Magnetic Resonance, East China Normal University, Shanghai, China
Synopsis
Preoperative differentiation of glioblastomas and solitary brain metastases may contribute to more appropriate treatment plans and follow-up. However, routine MRI has a very limited ability to distinguish between the two. Mean apparent propagator (MAP)-MRI, as a representative of diffusion MRI technology, is effective in evaluating the complexity and inhomogeneity of the brain microstructure. We developed a series of radiomics models of MAP-MRI parametric maps, routine MRI, combined routine MRI, and combined MAP-MRI parametric maps to compare their performance in the identification of two tumors. Finally, a good performance with the combined MAP-MRI radiomics model was obtained.
Introduction
In brain tumors, glioblastomas (GBMs) and solitary brain metastases (SBMs) are the most common in adults. The distinction between GBMs and SBMs is crucial, given the different treatment strategies available. Although magnetic resonance imaging (MRI) is the preferred method for evaluating patients with brain tumors, the distinction between GBMs and SBMs is extremely challenging due to their similar radiological appearance on MRI [1]. Previous studies have shown that the identification of GBMs and SBMs can benefit from investigating the differences among SBMs from different primary sites, but it is difficult to obtain enough research subjects [2]. Another way is to use advanced imaging modalities, such as mean apparent propagator (MAP)-MRI [3]. As a representative of diffusion MRI technology, MAP-MRI is effective in evaluating the complexity and inhomogeneity of the brain microstructure. Recently, studies have shown that radiomics has great potential in identifying GBMs and SBMs on routine MRI [4]. Integrated radiomics analysis has become an effective tool for tumor identification. However, it remains unknown whether MAP-MRI radiomics is superior to routine MRI radiomics in distinguishing GBMs and SBMs. The purpose of this research is to explore the performance of MAP-MRI radiomics analysis in distinguishing the two.Materials and Methods
The institutional review board approved this prospective study, and informed consent was obtained from all patients. The patients were recruited between November 2015 and April 2021. The inclusion criteria were as follows: (1) pathologically confirmed as having GBMs and (2) pathologically confirmed as having SBMs or follow-up confirmation of SBMs (3) T2WI, FLAIR, CE-T1WI, diffusion weighted imaging (DWI) sequences included. The exclusion criteria were as follows: (1) lack of necessary MRI scans and (2) MRI scans with severe motion or susceptibility artifacts. All patients underwent DWI and routine MRI examinations on a 3T MR scanner (MAGNETOM Prisma; Siemens Healthcare, Erlangen, Germany) with a 64-channel head–neck coil. Finally, one hundred and one patients (GBMs: 50, SBMs: 51) was included. For radiomics analysis, eighty-one cases were randomly selected as the training cohort, while the remaining twenty cases were used as the testing cohort. DWI data were acquired using 6b values (0, 500, 1000, 1500, 2000, and 2500 s/mm2), and every non-zero b value was performed at 30 encoding directions. The MAP-MRI parameters were calculated frow DWI data by an in-house-developed post-processing software, named NeuDilab, based on DIPY (http://nipy.org/dipy). The MAP-MRI parameters included mean squared displacement (MSD), non-Gaussianity (NG), non-Gaussianity axis (NGAx), non-Gaussianity radius (NGRad), return-to-the-origin probability (RTOP), return-to-the-plane probability (RTPP), return-to-the-axis probability (RTAP), and Qspace inverse variance (QIV). Figure 1 shows the pipeline of data processing. Regions of interest was manually segmented using ITK-SNAP (http://www.itksnap.org) software. The maximum abnormal signal area was delineated on the axial FLAIR image. Routine MRI images and all MAP-MRI parameter maps were spatially registered to FLAIR images. The key steps of radiomics, such as feature extraction, feature selection and model construction, are processed by FAE software [5]. A total of 851 radiomics features, including 18 first-order statistical features, 14 shape-based, 75 texture features of original and wavelet transformed images, were extracted from each case. Two feature selection methods and three classifiers were utilized to construct radiomics prediction models on individual map from routine MRI and MAP-MRI parameter maps. At the same time, a combined routine MRI model and a combined MAP-MRI model were constructed. Fivefold cross-validation was applied to demonstrate the model performance, and the model performance was evaluated using the receiver operating characteristic (ROC) curve, accuracy, area under the ROC curve (AUC), sensitivity, and specificity on the testing cohort.Results
The detailed clinical characteristics are summarized in Table 1. No significant difference was found between two tumors for sex (P = 0.09) and age (P = 0.565). Figure 2 shows the best feature parameters obtained with the combined MAP-MRI model. The model used analysis of variance (ANOVA) for feature selection, and selected 11 key features to serve as the radiomics signature (Table 2). The radiomics signature is used to build a predictive model by adopting the support vector machines (SVM) classifier. Table 3 shows the performance of each parameter and the two combined models of MAP-MRI parametric and routine MRI. The results indicated that the combined MAP-MRI had higher accuracy, AUC, sensitivity, and specificity than those of the combined routine MRI model (MAP-MRI: 86.67%, 0.92%, and 93.33%; routine MRI: 76.67%, 0.73%, and 60.00%, respectively).Discussion
Previous studies have shown that MSD in MAP-MRI performs better than QIV in distinguishing between GBMs and SBMs [3]. We obtained the same conclusion. NGRad, RTAP, RTOP, and RTPP for MAP-MRI achieved optimal identification accuracy and were all higher than those for the routine MRI model. The combined MAP-MRI performed better than the routine MRI model. MAP-MRI provides an assessment of the dispersion distribution of water molecules by measuring the probability density function of spin displacements in complex microstructures of brain tissue [6]. By quantifying the non-Gaussian character of the diffusion process, this method more accurately characterizes diffusion anisotropy. These quantitative information can be easily extracted and used as radiomics features.Conclusion
Compared with routine MRI radiomics, MAP-MRI radiomics analysis has obvious advantages in distinguishing GBMs and SBMs.Acknowledgements
No acknowledgement found.References
[1] Kamimura K, Nakajo M, Yoneyama T, et al. Histogram analysis of amide proton transfer-weighted imaging: comparison of glioblastoma and solitary brain metastasis in enhancing tumors and peritumoral regions. Eur Radiol. 2019;29(8):4133-4140. [2] Artzi M, Bressler I, Ben Bashat D. Differentiation between glioblastoma, brain metastasis and subtypes using radiomics analysis. J Magn Reson Imaging. 2019;50(2):519-528. [3] Mao J, Zeng W, Zhang Q, et al. Differentiation between high-grade gliomas and solitary brain metastases: a comparison of five diffusion-weighted MRI models. BMC Med Imaging. 2020;20(1):124. [4] Han Y, Zhang L, Niu S, et al. Differentiation Between Glioblastoma Multiforme and Metastasis From the Lungs and Other Sites Using Combined Clinical/Routine MRI Radiomics. Front Cell Dev Biol. 2021; 26(9):710461. [5] Song Y, Zhang J, Zhang YD, et al. FeAture Explorer (FAE): A tool for developing and comparing radiomics models. PLoS One. 2020;15(8):e0237587. [6] Ma K, Zhang X, Zhang H, et al. Mean apparent propagator-MRI: A new diffusion model which improves temporal lobe epilepsy lateralization. Eur J Radiol. 2020;126:108914.Figures
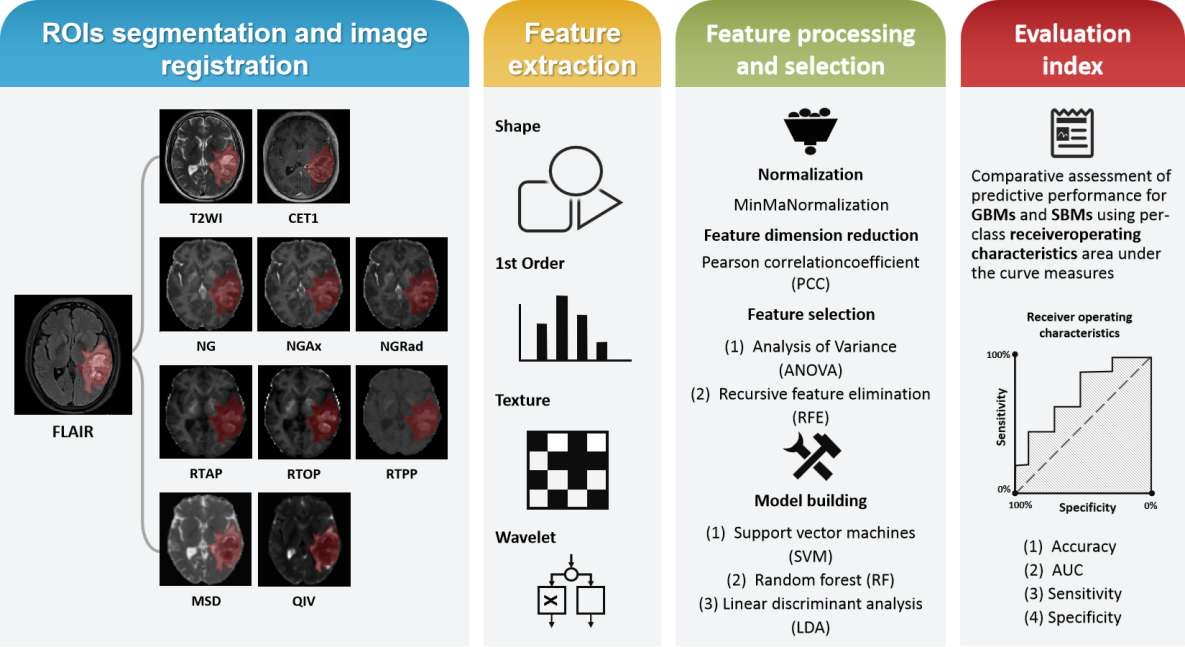
Figure 1. Summary of the modular pipeline
for differentiating GBMs and SBMs by using radiomics.
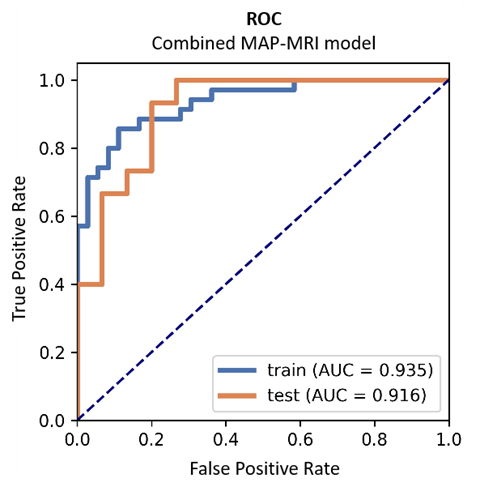
Figure 2 ROC
curve obtained from the best combined MAP-MRI model.
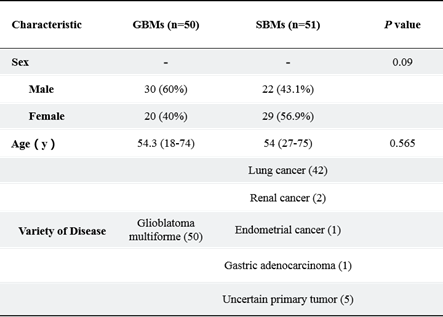
Table 1
Patient Characteristics.
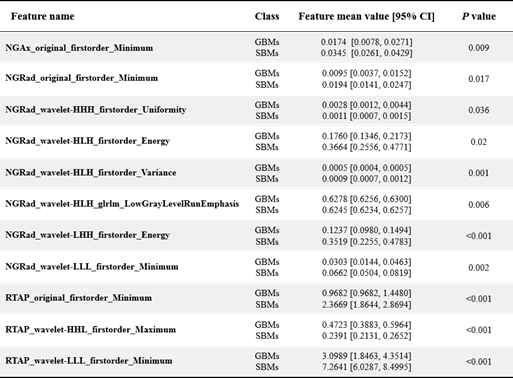
Table 2 Statistics of the 11 selected radiomic
features. All features yielded significant differences in GBMs and SBMs
(independent t-test, p < 0.05).
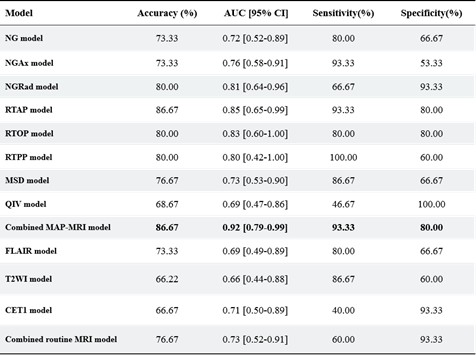
Table 3 Performance of the two combined models:
MAP-MRI parametric and routine MRI.
DOI: https://doi.org/10.58530/2022/4341