4340
Automated classification of intramedullary spinal cord tumors and inflammatory demyelinating lesions using deep learning
Zhizheng Zhuo1, Jie Zhang1, Yunyun Duan1, Xianchang Zhang2, and Yaou Liu1
1Department of Radiology, Beijing Tiantan Hospital, Capital Medical University, Beijing, China, 2MR Collaboration, Siemens Healthineers Ltd, Beijing, China
1Department of Radiology, Beijing Tiantan Hospital, Capital Medical University, Beijing, China, 2MR Collaboration, Siemens Healthineers Ltd, Beijing, China
Synopsis
A DL framework for the segmentation and classification of spinal cord lesions, including tumors (astrocytoma and ependymoma) and demyelinating diseases (MS and NMOSD), were developed and validated, with performance sometimes outperforming radiologists.
Synopsis
A DL framework for the segmentation and classification of spinal cord lesions, including tumors (astrocytoma and ependymoma) and demyelinating diseases (MS and NMOSD), were developed and validated, with performance sometimes outperforming radiologists.Introduction and Purpose
Intramedullary spinal cord tumors and inflammatory demyelinating lesions share several MRI characteristics (e.g., localization, shape, signal intensity and contrast-enhancement)1-3, posing a clinical challenge for accurate diagnosis. It is essential to accurately differentiate spinal cord tumors from demyelinating lesions, as this implies fundamentally different treatment and prognosis. The most common intradural intramedullary tumors include astrocytoma and ependymoma, with different histological characteristics, molecular features, and management1. Spinal cord demyelinating diseases such as multiple sclerosis (MS) and neuromyelitis optica spectrum disorders (NMOSD) also require different clinical management4. Therefore, accurate and robust differentiation of tumors and demyelinating lesions as well as their subtypes would be beneficial for patient management and prognosis evaluation. In this study, we aimed to develop a pipeline for spinal cord lesion segmentation and classification using deep learning (DL) algorithms based on T2-weighted images.Methods
490 patients (118 astrocytoma, 130 ependymoma, 101 multiple sclerosis [MS] and 141 neuromyelitis optica spectrum disorders [NMOSD]) with available sagittal T2-weighted images from Jan 2012 to Dec 2018 in local institute were retrospectively identified for DL model development. An test cohort of 157 patients (34 astrocytoma, 45 ependymoma, 33 MS and 45 NMOSD) from Jan 2019 to Dec 2020 were prospectively recruited for model test. Dice score was used to evaluate the performance of segmentation by two independent radiologists and DL models. Accuracy and area under the curve (AUC) were determined to evaluate the performance of DL model for lesion classification.Results
In the test cohort, the segmentation of spinal cord lesions showed Dice scores of 0.77, 0.80, 0.50 and 0.58 against manual labels for astrocytoma, ependymoma, MS and NMOSD, respectively. The classification of tumor vs. demyelinating lesion, astrocytoma vs. ependymoma, and MS vs. NMOSD showed accuracies of 96% (AUC=0.99), 83% (AUC=0.90) and 79% (AUC=0.85) in the test set. In a subset of radiologically difficult cases, the classifier still reached an accuracy of 79-95% (AUC=0.78-0.97), which are comparable with or superior to experienced neuroradiologists (accuracy of 97%, 72% and 67% for tumor vs. demyelinating lesion, astrocytoma vs. ependymoma, and MS vs. NMOSD, respectively).Discussion and Conclusions
In this study, a DL framework for spinal cord lesion segmentation and patient classification was firstly developed using the most widely available T2w images. Few studies have focused on spinal cord lesion segmentation by DL. The spinal cord tumor segmentation benefits from the relatively high tumor intensity compared to surrounding normal spinal cord tissue5. Our DL model showed a promising segmentation performance (Dice score>0.75), comparable to a previous report with a Dice score of 0.77, which may benefit a preoperative planning. As for MS lesions, DL segmentation achieved a slightly lower performance (Dice score≤0.6) due to the smaller volume of the disseminated lesions, also posing a challenge for manual delineation (average Dice score<0.75). Even though the current automatic segmentation of demyelinating lesions needs manual review and frequent modification (approximately 30%), it may still benefit a surveillance for lesion evolvement. The novelty of our study is the classification of spinal cord tumors and demyelinating cases using DL, a clinically relevant and sometimes challenging task. Our model showed an excellent differentiation (accuracy, 96%) of spinal cord tumors versus demyelinating cases using only T2w images, comparable to that (mean accuracy, 97%) by neuroradiologists, which may benefit from the different intensity contrast and morphological characteristics. In addition, the findings of cysts, necrosis and cavities, which are specific to tumors and typically absent in demyelinating lesions, may also contribute to the final classification1. Even though the differentiation of different brain tumors has been widely reported in previous studies with high accuracies above 80% 6, studies on differentiation of spinal cord tumors are lacking. The differentiation within spinal cord tumors (accuracy, 83%) using DL in the current study was superior to neuroradiologists’ diagnostic performance (mean accuracy<0.75, even with other available spinal cord MRI sequences) and comparable to those in previous brain tumor studies 14, 7. The differentiation of demyelinating lesions (MS vs. NMOSD) using DL yielded with an accuracy of 79%, which was lower than that for spinal cord tumors. The similar MR presentations, including intensity contrast, location and shape, in MS and NMOSD may hamper diagnostic performance. The classification accuracy by the DL model (79%) was still higher than that by neuroradiologists (mean accuracy<0.7, even with other available spinal cord MRI sequences). In a subset of clinical difficult cases with conflicting radiologist opinions, good to excellent performance (accuracy from 79% to 95%) for differential diagnosis using the DL was still achieved, implying a potential use in solving clinical problems of difficult spinal cord cases. A deep learning pipeline for segmentation and classification of spinal cord lesion showed sufficient diagnostic accuracy, sometimes outperforming experienced neuroradiologists.Acknowledgements
This work was supported by the National Science Foundation of China (Nos. 81870958 and 81571631), the Beijing Municipal Natural Science Foundation for Distinguished Young Scholars (No. JQ20035), the Special Fund of the Pediatric Medical Coordinated Development Center of Beijing Hospitals Authority (No. XTYB201831), and the ECTRIMS-MAGNMIS Fellowship from ECTRIMS (Y.L.).References
1. Abul-Kasim K, Thurnher MM, McKeever P, Sundgren PC. Intradural spinal tumors: current classification and MRI features. Neuroradiology. Apr 2008;50(4):301-14. doi:10.1007/s00234-007-0345-7 2. Karussis D. The diagnosis of multiple sclerosis and the various related demyelinating syndromes: a critical review. J Autoimmun. Feb-Mar 2014;48-49:134-42. doi:10.1016/j.jaut.2014.01.022 3. Kim HJ, Paul F, Lana-Peixoto MA, et al. MRI characteristics of neuromyelitis optica spectrum disorder: an international update. Neurology. Mar 17 2015;84(11):1165-73. doi:10.1212/WNL.0000000000001367 4. Selmaj K, Selmaj I. Novel emerging treatments for NMOSD. Neurol Neurochir Pol. 2019;53(5):317-326. doi:10.5603/PJNNS.a2019.0049 5. Jung JS, Choi YS, Ahn SS, Yi S, Kim SH, Lee SK. Differentiation between spinal cord diffuse midline glioma with histone H3 K27M mutation and wild type: comparative magnetic resonance imaging. Neuroradiology. Mar 2019;61(3):313-322. doi:10.1007/s00234-019-02154-8 6. Shaver MM, Kohanteb PA, Chiou C, et al. Optimizing Neuro-Oncology Imaging: A Review of Deep Learning Approaches for Glioma Imaging. Cancers (Basel). Jun 14 2019;11(6)doi:10.3390/cancers11060829 7. Bi WL, Hosny A, Schabath MB, et al. Artificial intelligence in cancer imaging: Clinical challenges and applications. CA Cancer J Clin. Mar 2019;69(2):127-157. doi:10.3322/caac.21552Figures
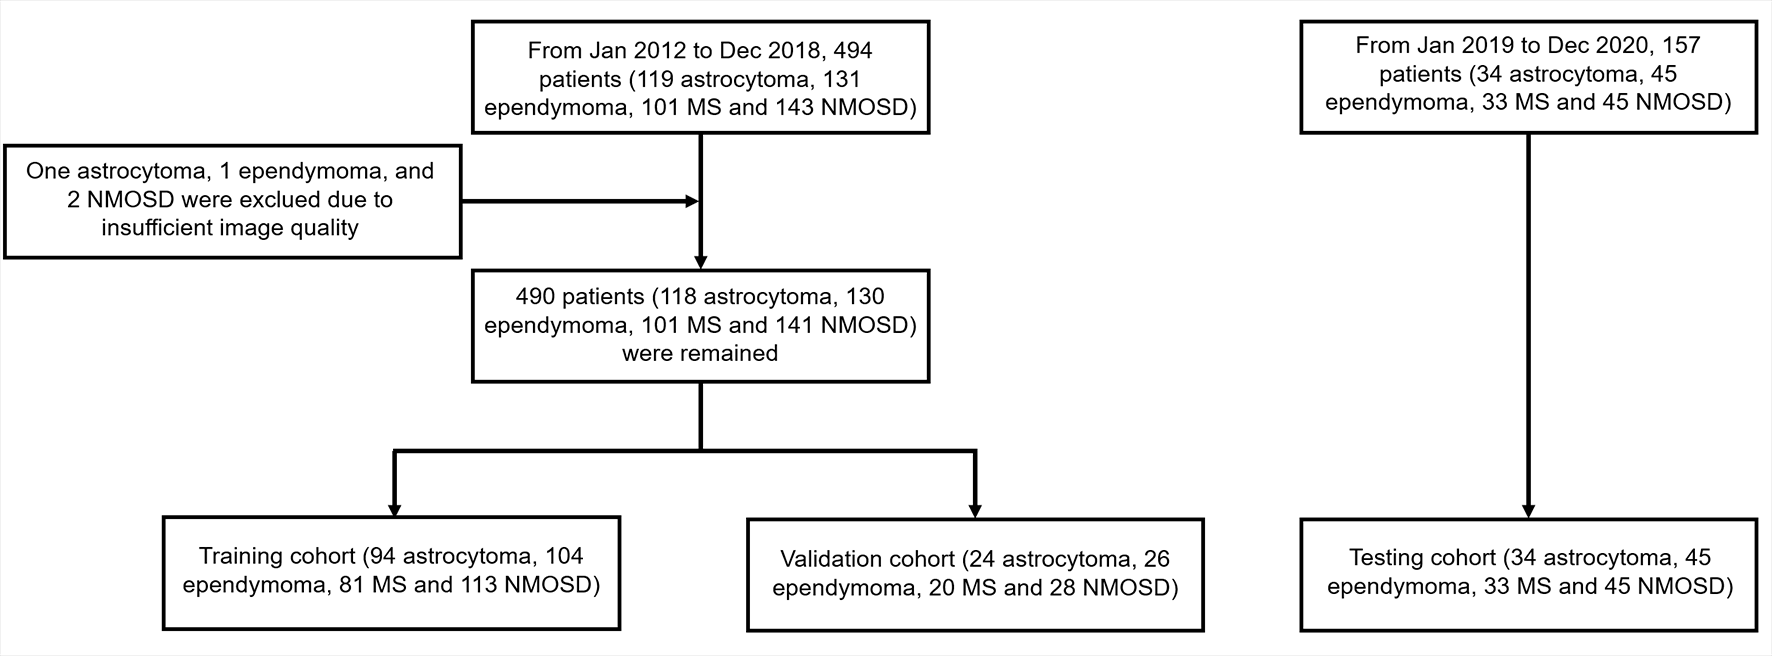
Figure 1. A flowchart of the patient
selection. MS, multiple sclerosis; NMOSD, neuromyelitis optica spectrum
disorders.
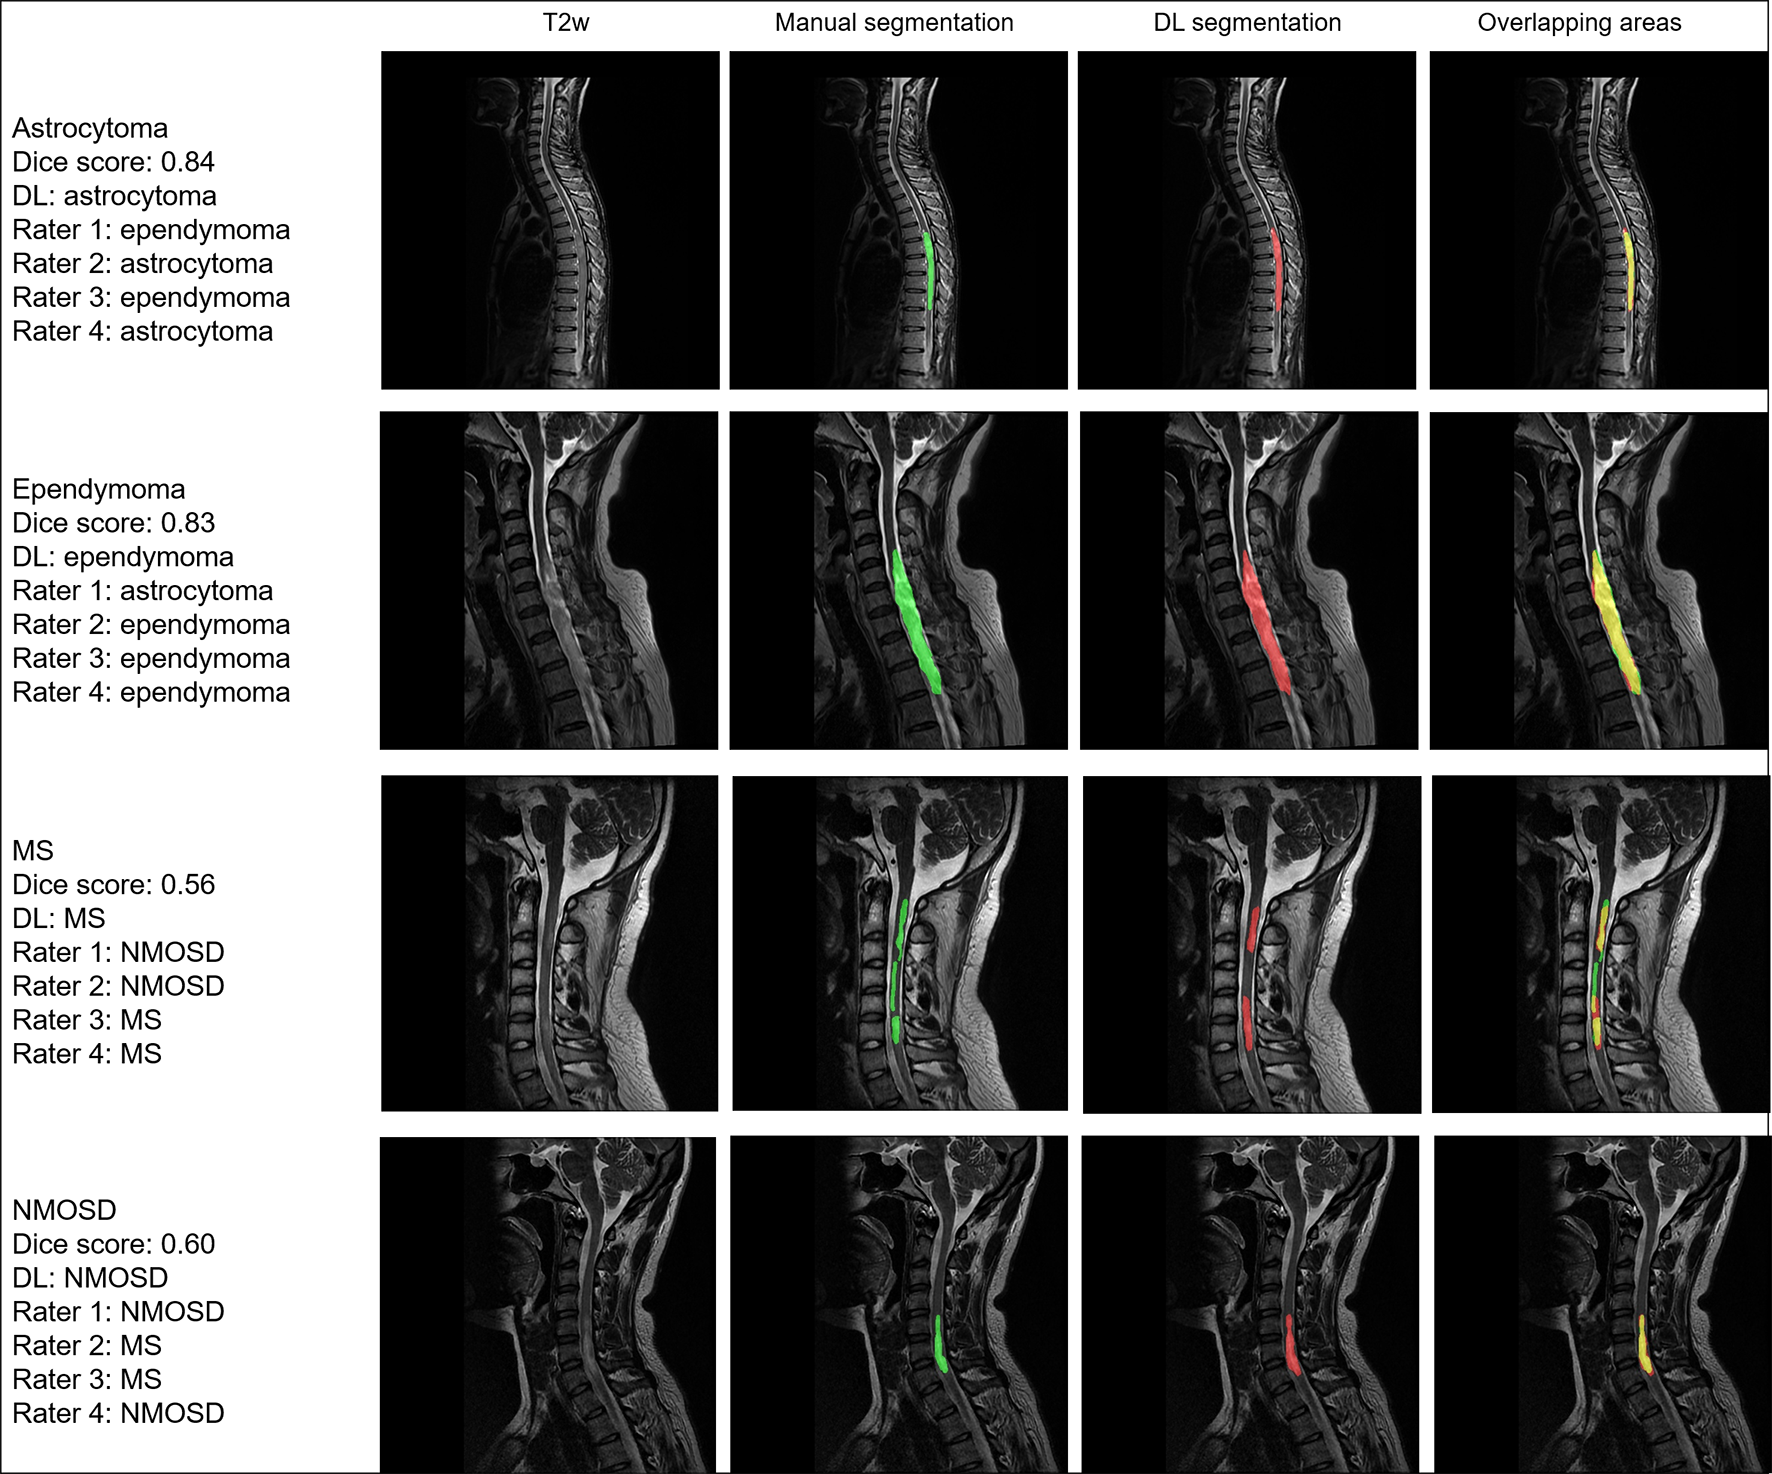
Figure 2. Representative cases of
segmentation and classification for spinal cord tumors and demyelinating
lesions in the test cohort. Diagnosis by DL and four raters (D.C, X.X, C.F and
X.H) were also presented. Red areas indicated the deep learning segmentation. DL,
deep learning; MS, multiple sclerosis; NMOSD, neuromyelitis optica spectrum
disorders.
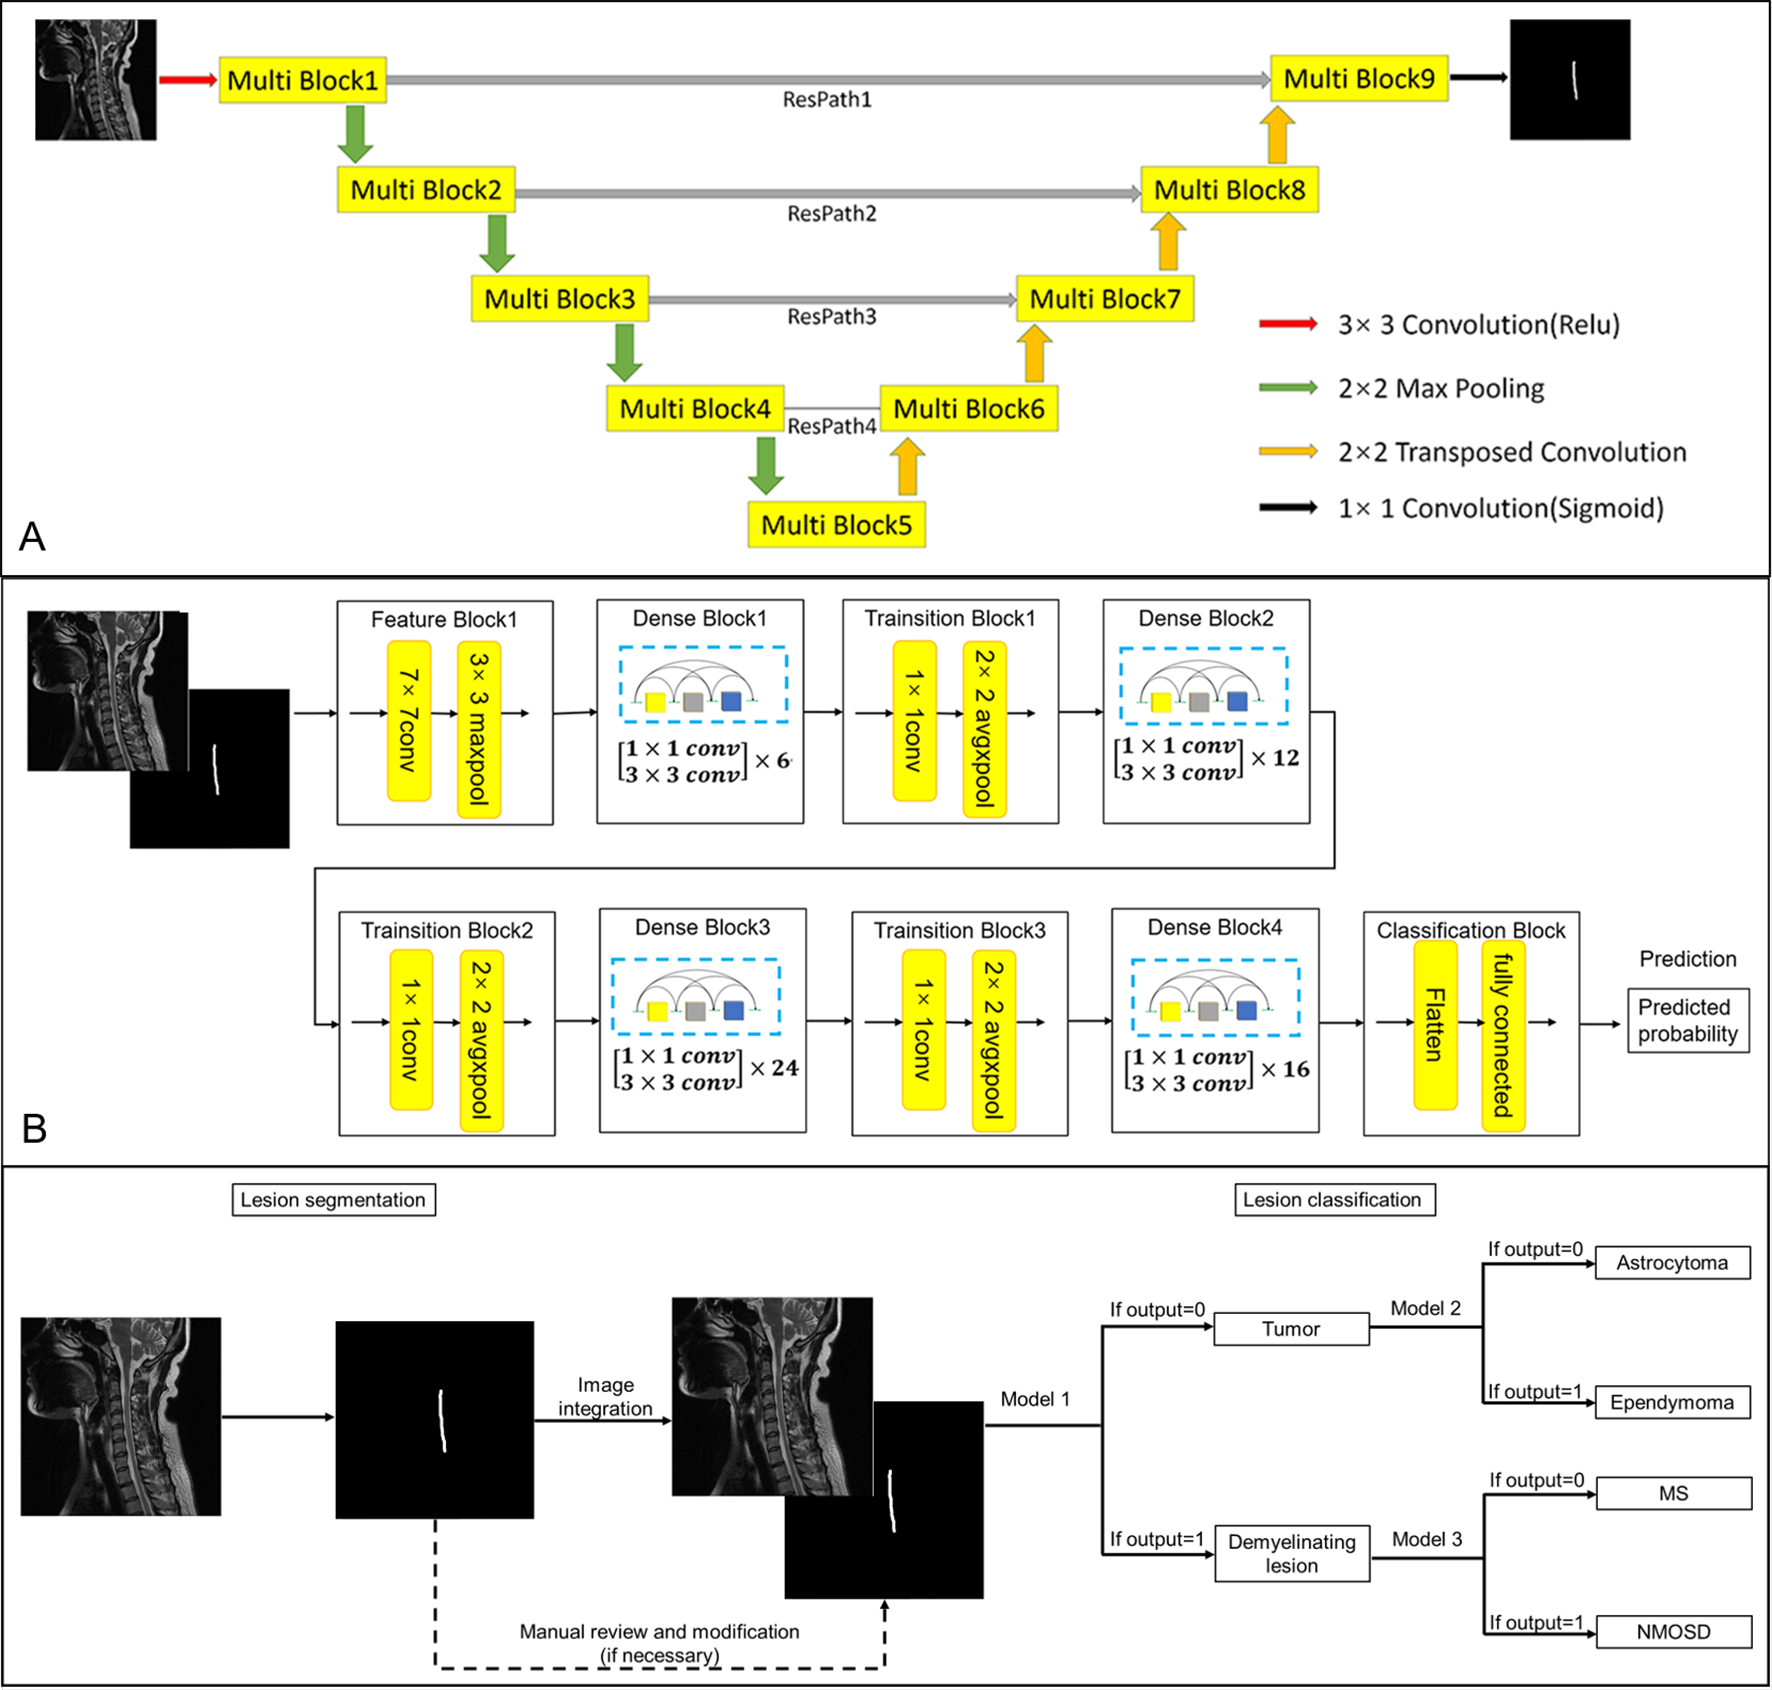
Figure
3. The pipeline of segmentation and classification based on (A) 2D MultiResUNet
and (B) 2D Densenet121 (model 1,2,3). (C) A DL pipeline built for segmentation
and classification of spinal cord lesions. Conv, convolution; MS, multiple
sclerosis; NMOSD, neuromyelitis optica spectrum disorders. Details of the
MultiResUNet (e.g., Multi Block and ResPath) could be found in reference
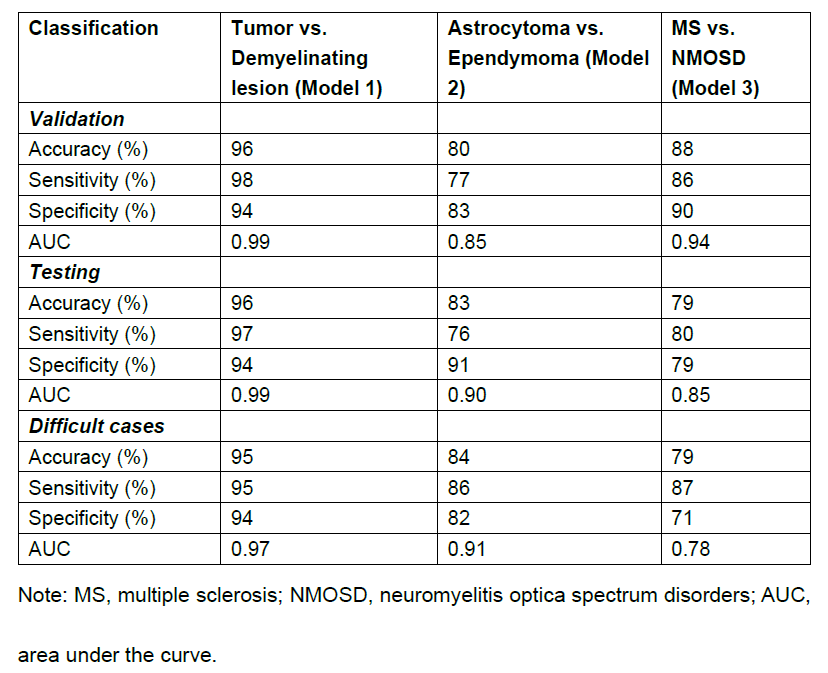
Table 1. The differentiation
of spinal cord lesions by DL models.
DOI: https://doi.org/10.58530/2022/4340