4337
Efficient six-direction DTI tensor estimation using model-based deep learning1School of Biomedical Engineering, Southern Medical University, Guangzhou, China
Synopsis
Diffusion tensor imaging (DTI) can noninvasively probe the tissue microstructure and characterize its anisotropic nature. The images carried with heavy diffusion-sensitizing gradients suffer from low SNR, and thus more than six diffusion-weighted images are required to improve the accuracy of parameter estimation against noise effect. We propose an efficient DTI model-based 3D-Unet (DTI-Unet) to predict high-quality diffusion tensor field and non-diffusion-weighted image from the noisy input. In our model, the input contains only six diffusion-weighted volumes and one b0 volume. Compared with the state-of-the-art denoising algorithms (MPPCA, GLHOSVD), our model performs better in image denoising and parameter estimation.
Introduction
Diffusion tensor imaging (DTI) can quantify the microstructure of tissues by detecting the direction and extent of water diffusion. Generally, more than 30 diffusion-weighted (DW) images are required and it leads to a long scan time, limits the application of DTI in neurological diseases and brain function research. To address the problem of low SNR in diffusion parameter estimation, traditional denoising is initially applied for the images with the knowledge of image properties, and the denoised data are used to calculate the diffusion-related metrics. Recently, deep learning is widely used for DW images denoising or diffusion parameter estimation 1-3. Here we propose a very efficient DTI model-based 3D-Unet, only one b0 and six DWI volumes with Rician noise are used to predict high-quality diffusion tensor field and one non-diffusion-weighted volume, Peak SNR (PSNR) is used to evaluate the performance of denoising and normalized root-mean-square errors (NRMSE) is for parameter estimation accuracy evaluation.Methods
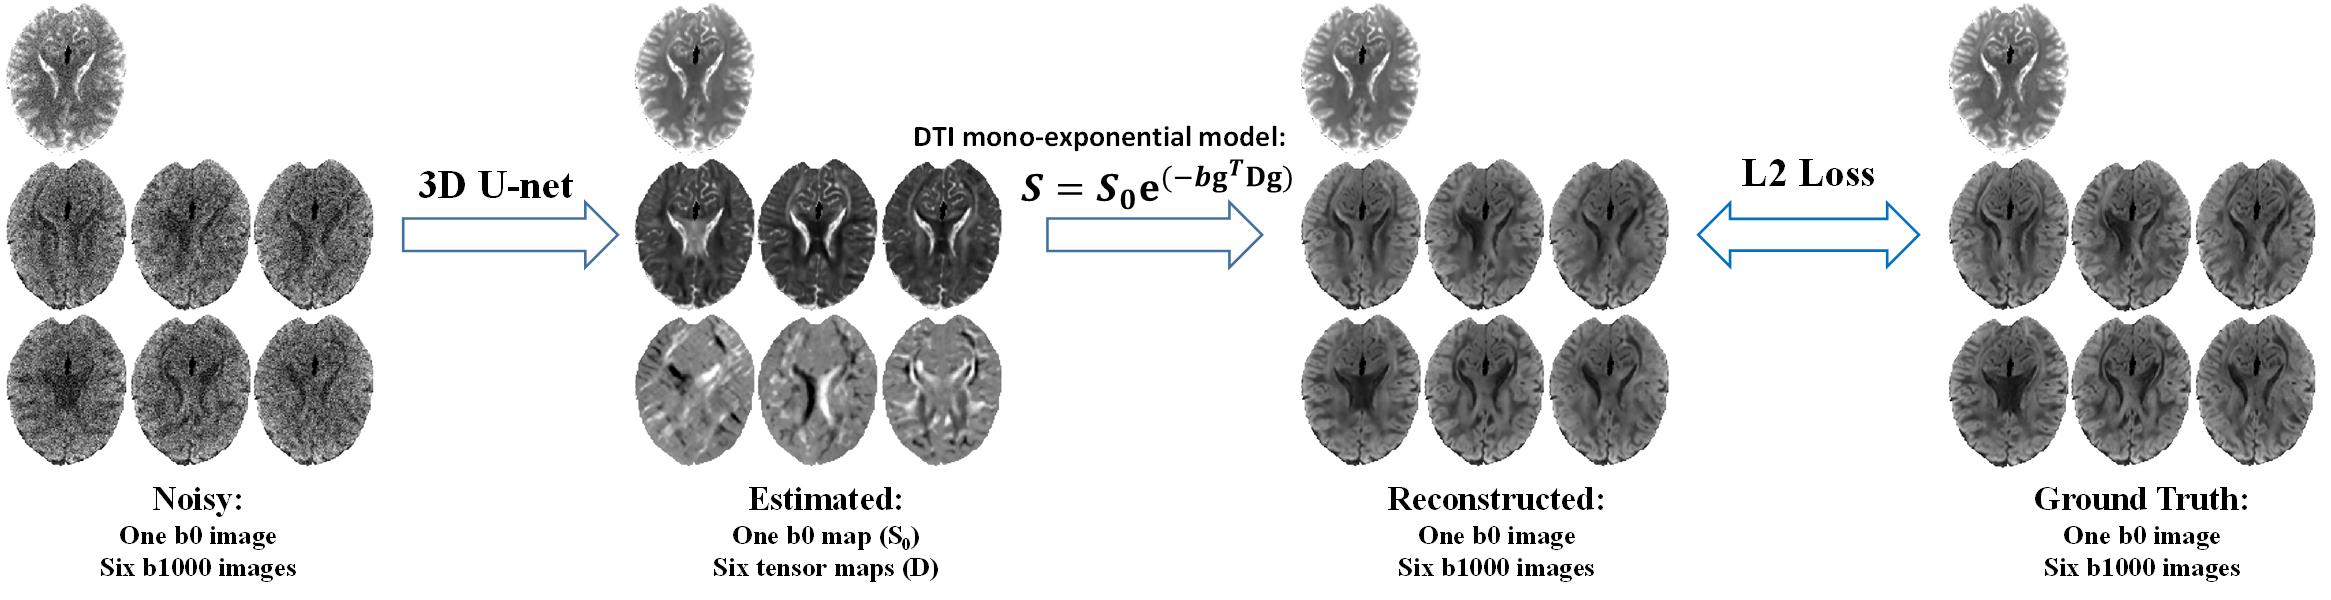
Simulated data:The HCP diffusion MRI data from 24 healthy adults (16 for training, 4 for validation, and 4 for evaluation) were used in our study. All data were denoised and corrected for Gibbs-ringing artifact and bias field in MRtrix software4. After that, the non-linear least square (NLLS) method was applied to estimate diffusion tensor (D) and b0 image (S0) using the pre-processed DTI data (5 b0 images, 64 b1000 images). The calculated S0 and D were served as ground truth and the DTI mono-exponential model was used to generate six DW volumes:
$$S=S_{0}e^{-bg^{T}Dg}$$
where $$$S$$$ is the reconstructed DW image with given encoding direction $$$g$$$, $$$S_{0}$$$ the non-diffusion-weighted image, $$$D$$$ the diffusion tensor field, and each element can be represented by a 3×3 symmetric positive-definite matrix. The Rician noise under different SNRs (15, 30, 60) was added to noise free images.
DTI-Unet Architecture:
The Deep-Unet, which is a 3D U-Net5 architecture, accepts 3D blocks of 32×32×32 voxels from the noisy images (one b0 and six b1000 volumes) as input and predicts six element maps of diffusion tensor and one b0 volume. A loss function is formed of an DTI mono-exponential model that takes the output to reconstruct DW volumes, and from which a L2 norm of the difference between the reconstructed images and the ground truth is optimized. (Figure 1)
$$||S^{truth}-S_0^{out}e^{-bg^{T}D^{out}g}||_2^2$$
where $$$S^{truth}$$$ is the ground-truth DW volumes, $$$S_0^{out}$$$ the b0 volume predicted by DTI-Unet, $$$D^{out}$$$ the diffusion tensor field predicted by DTI-Unet.
Results
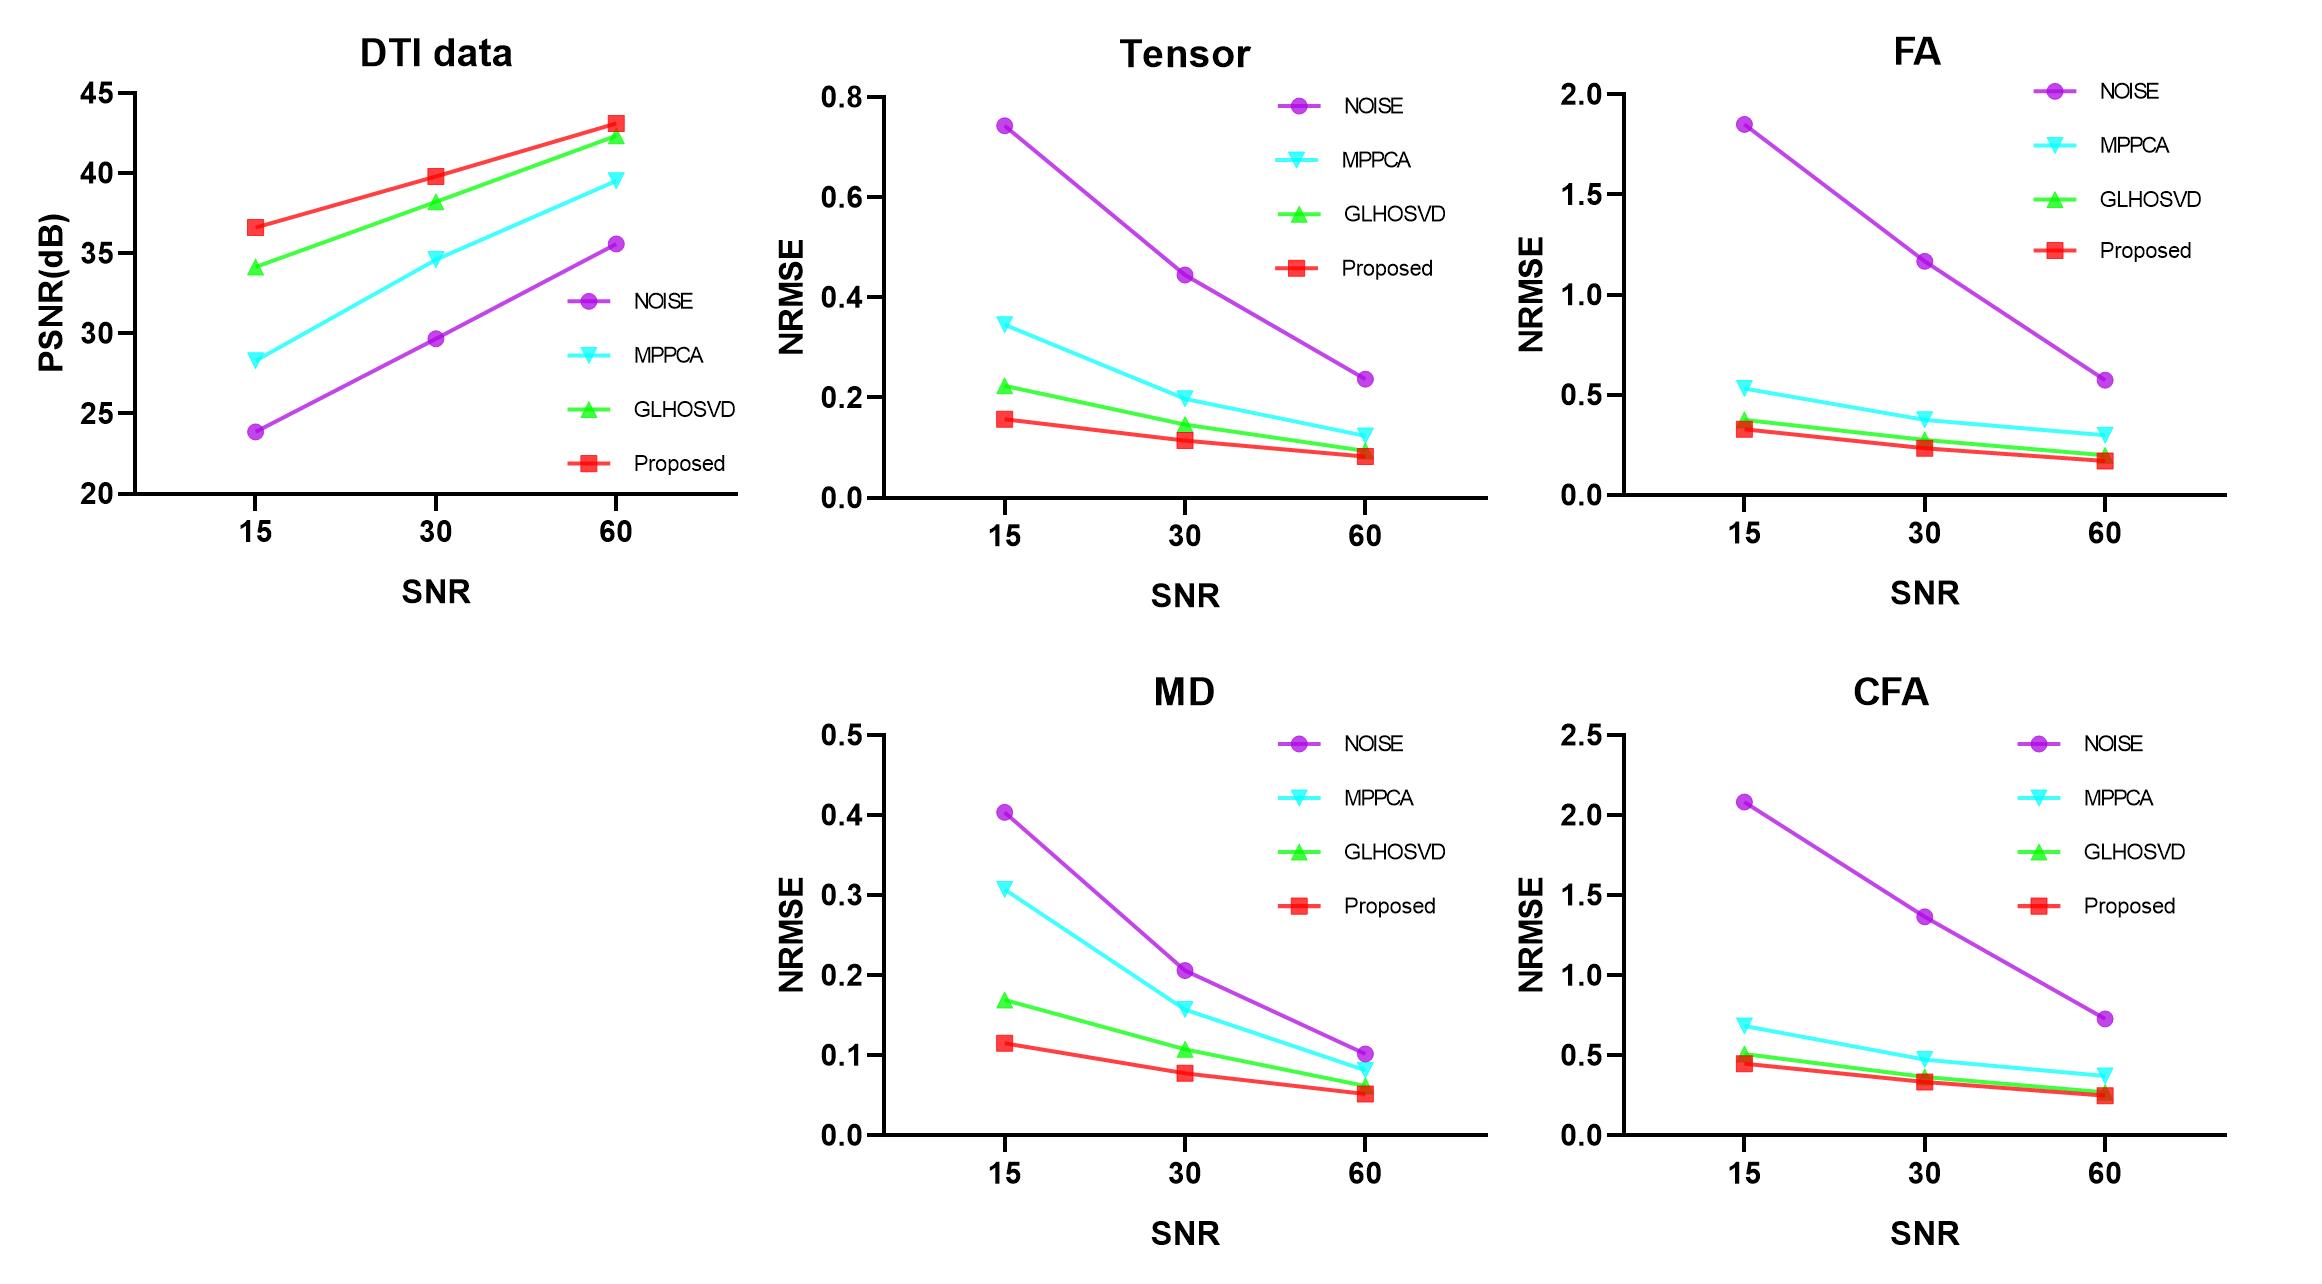
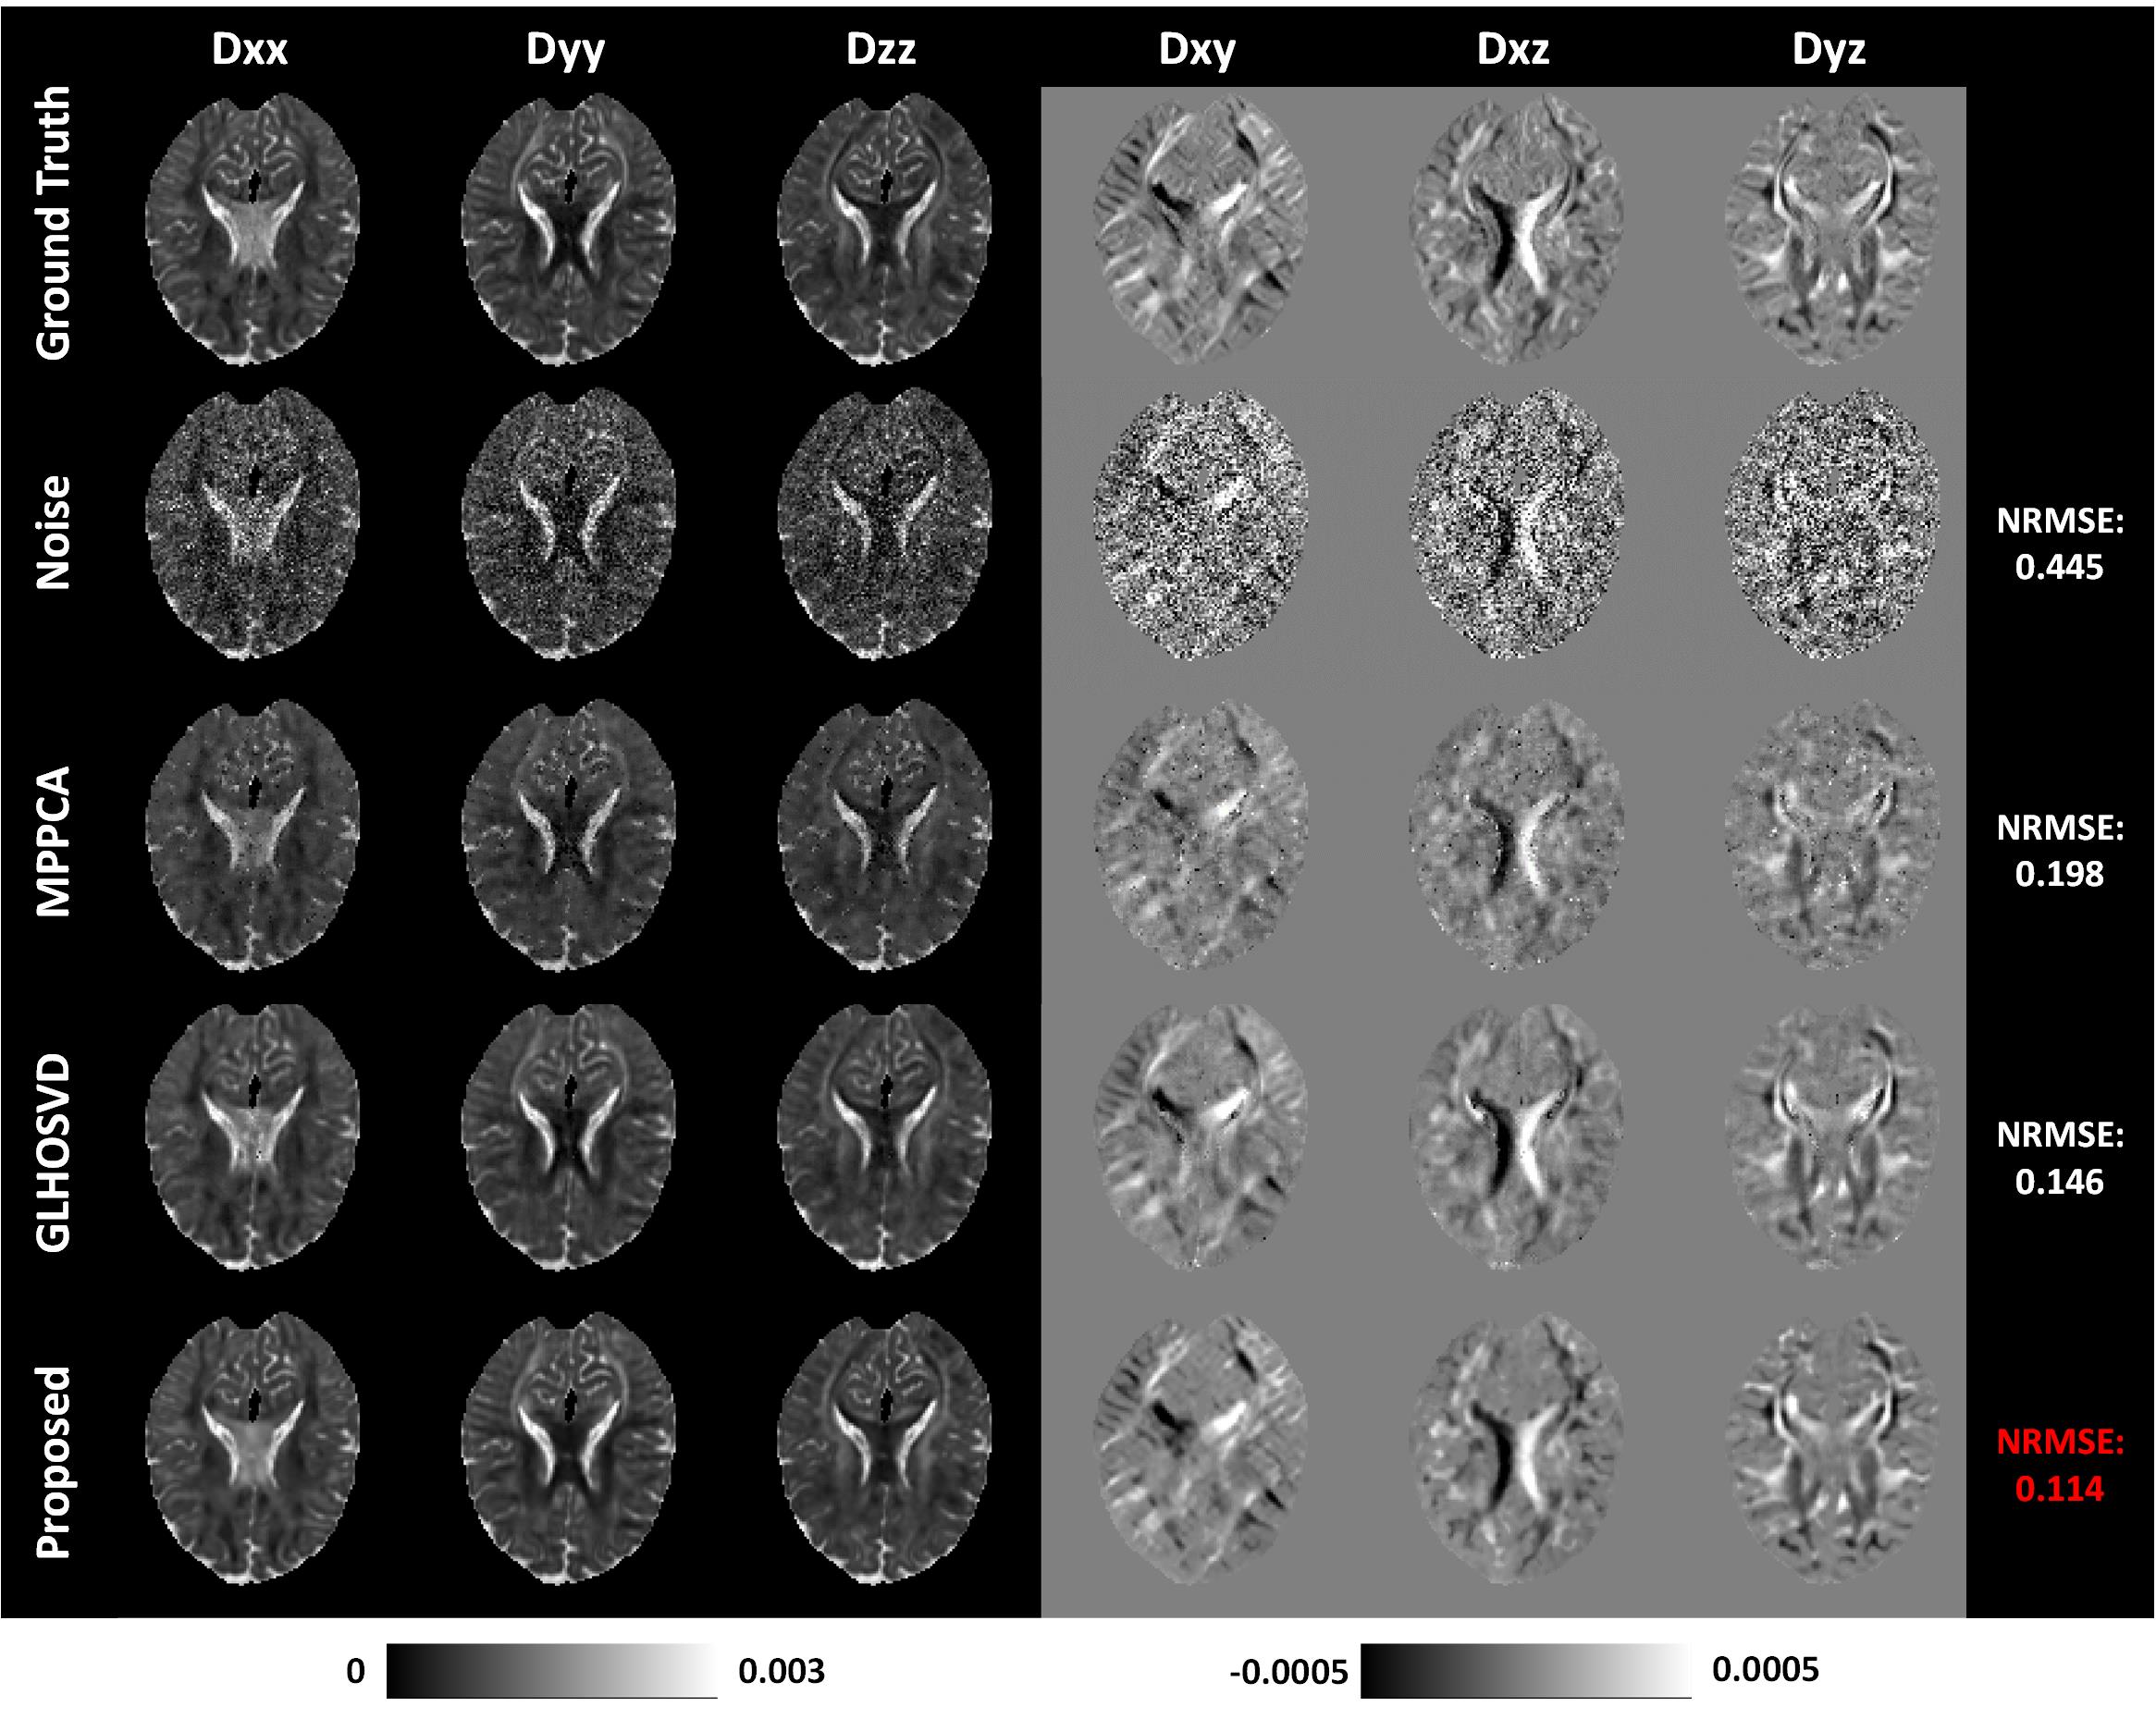
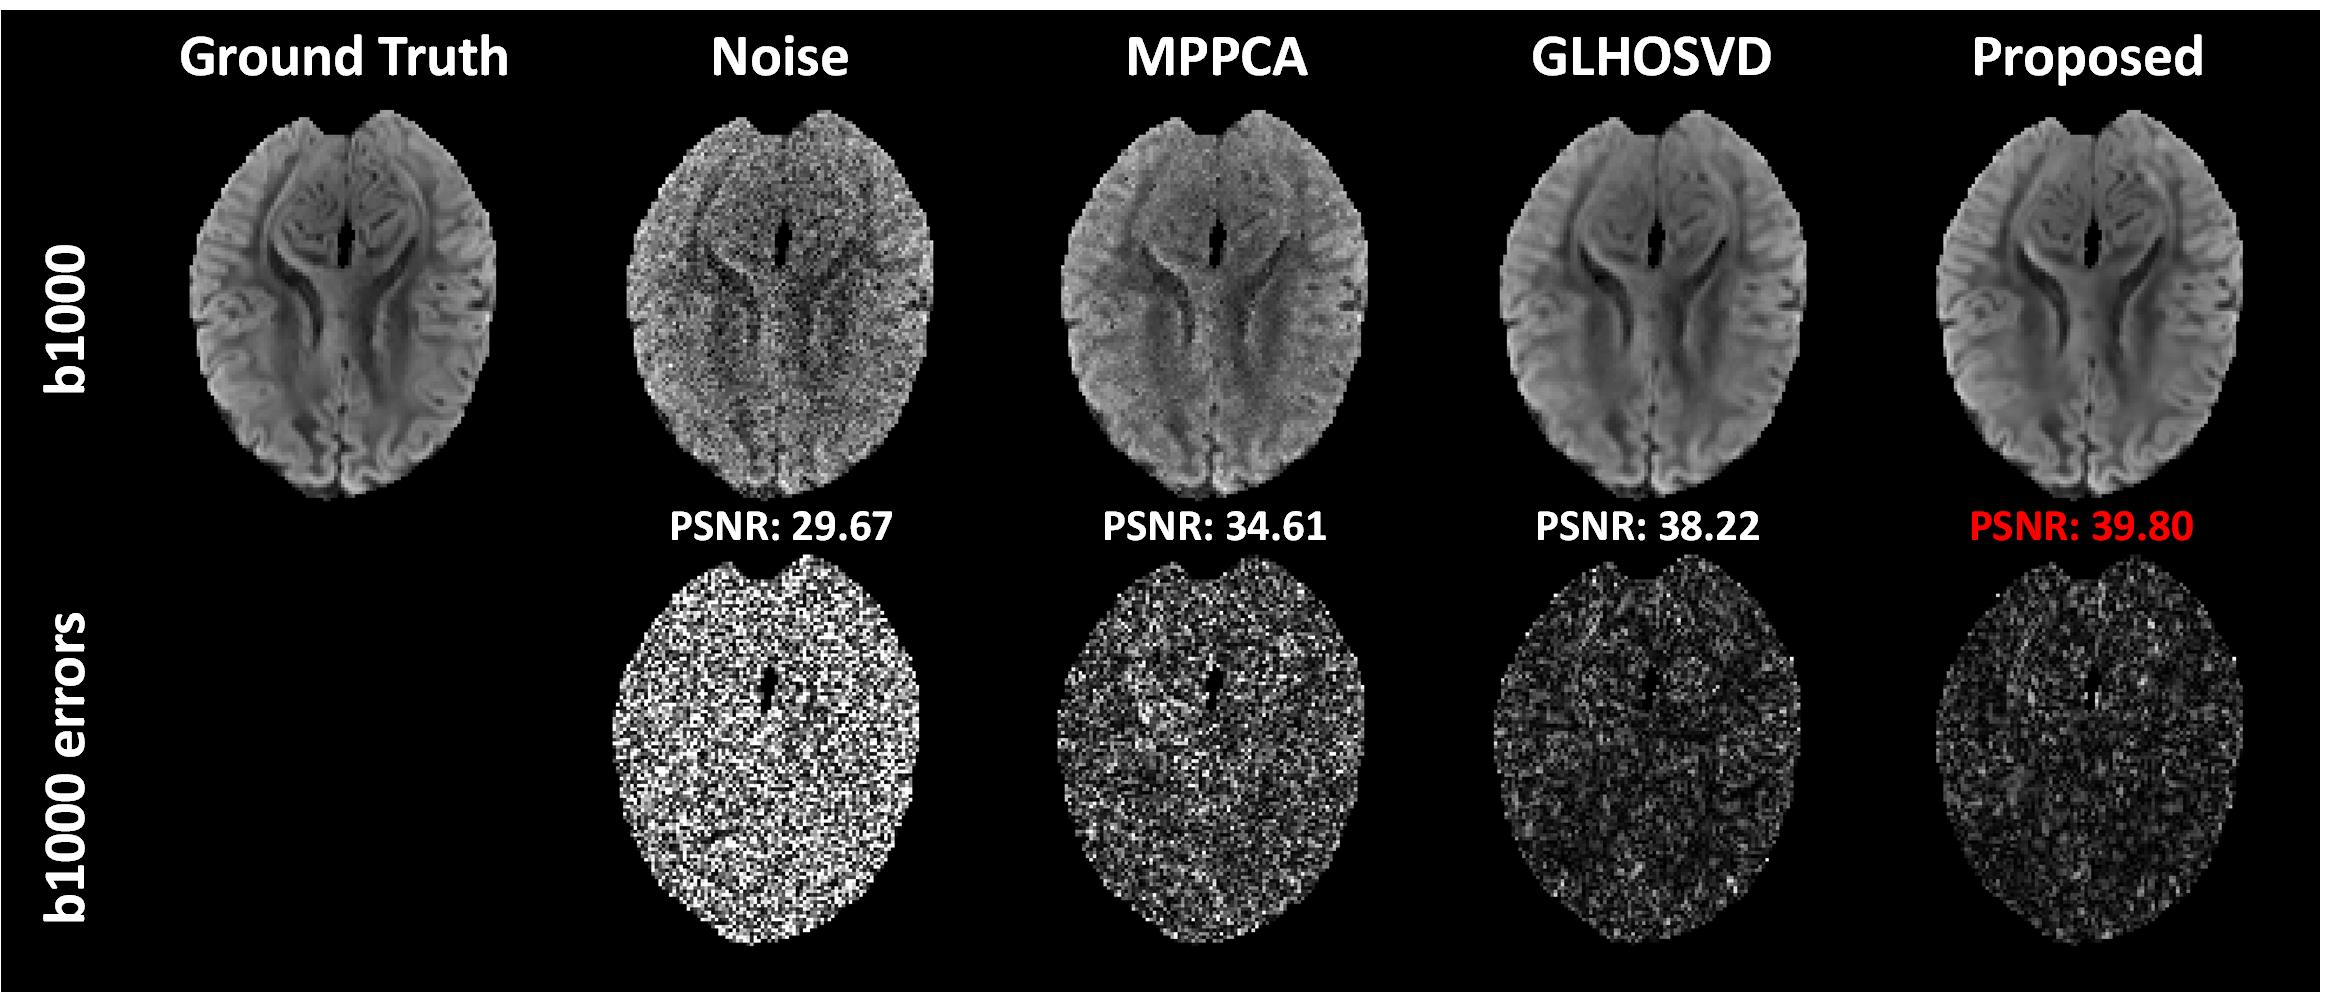
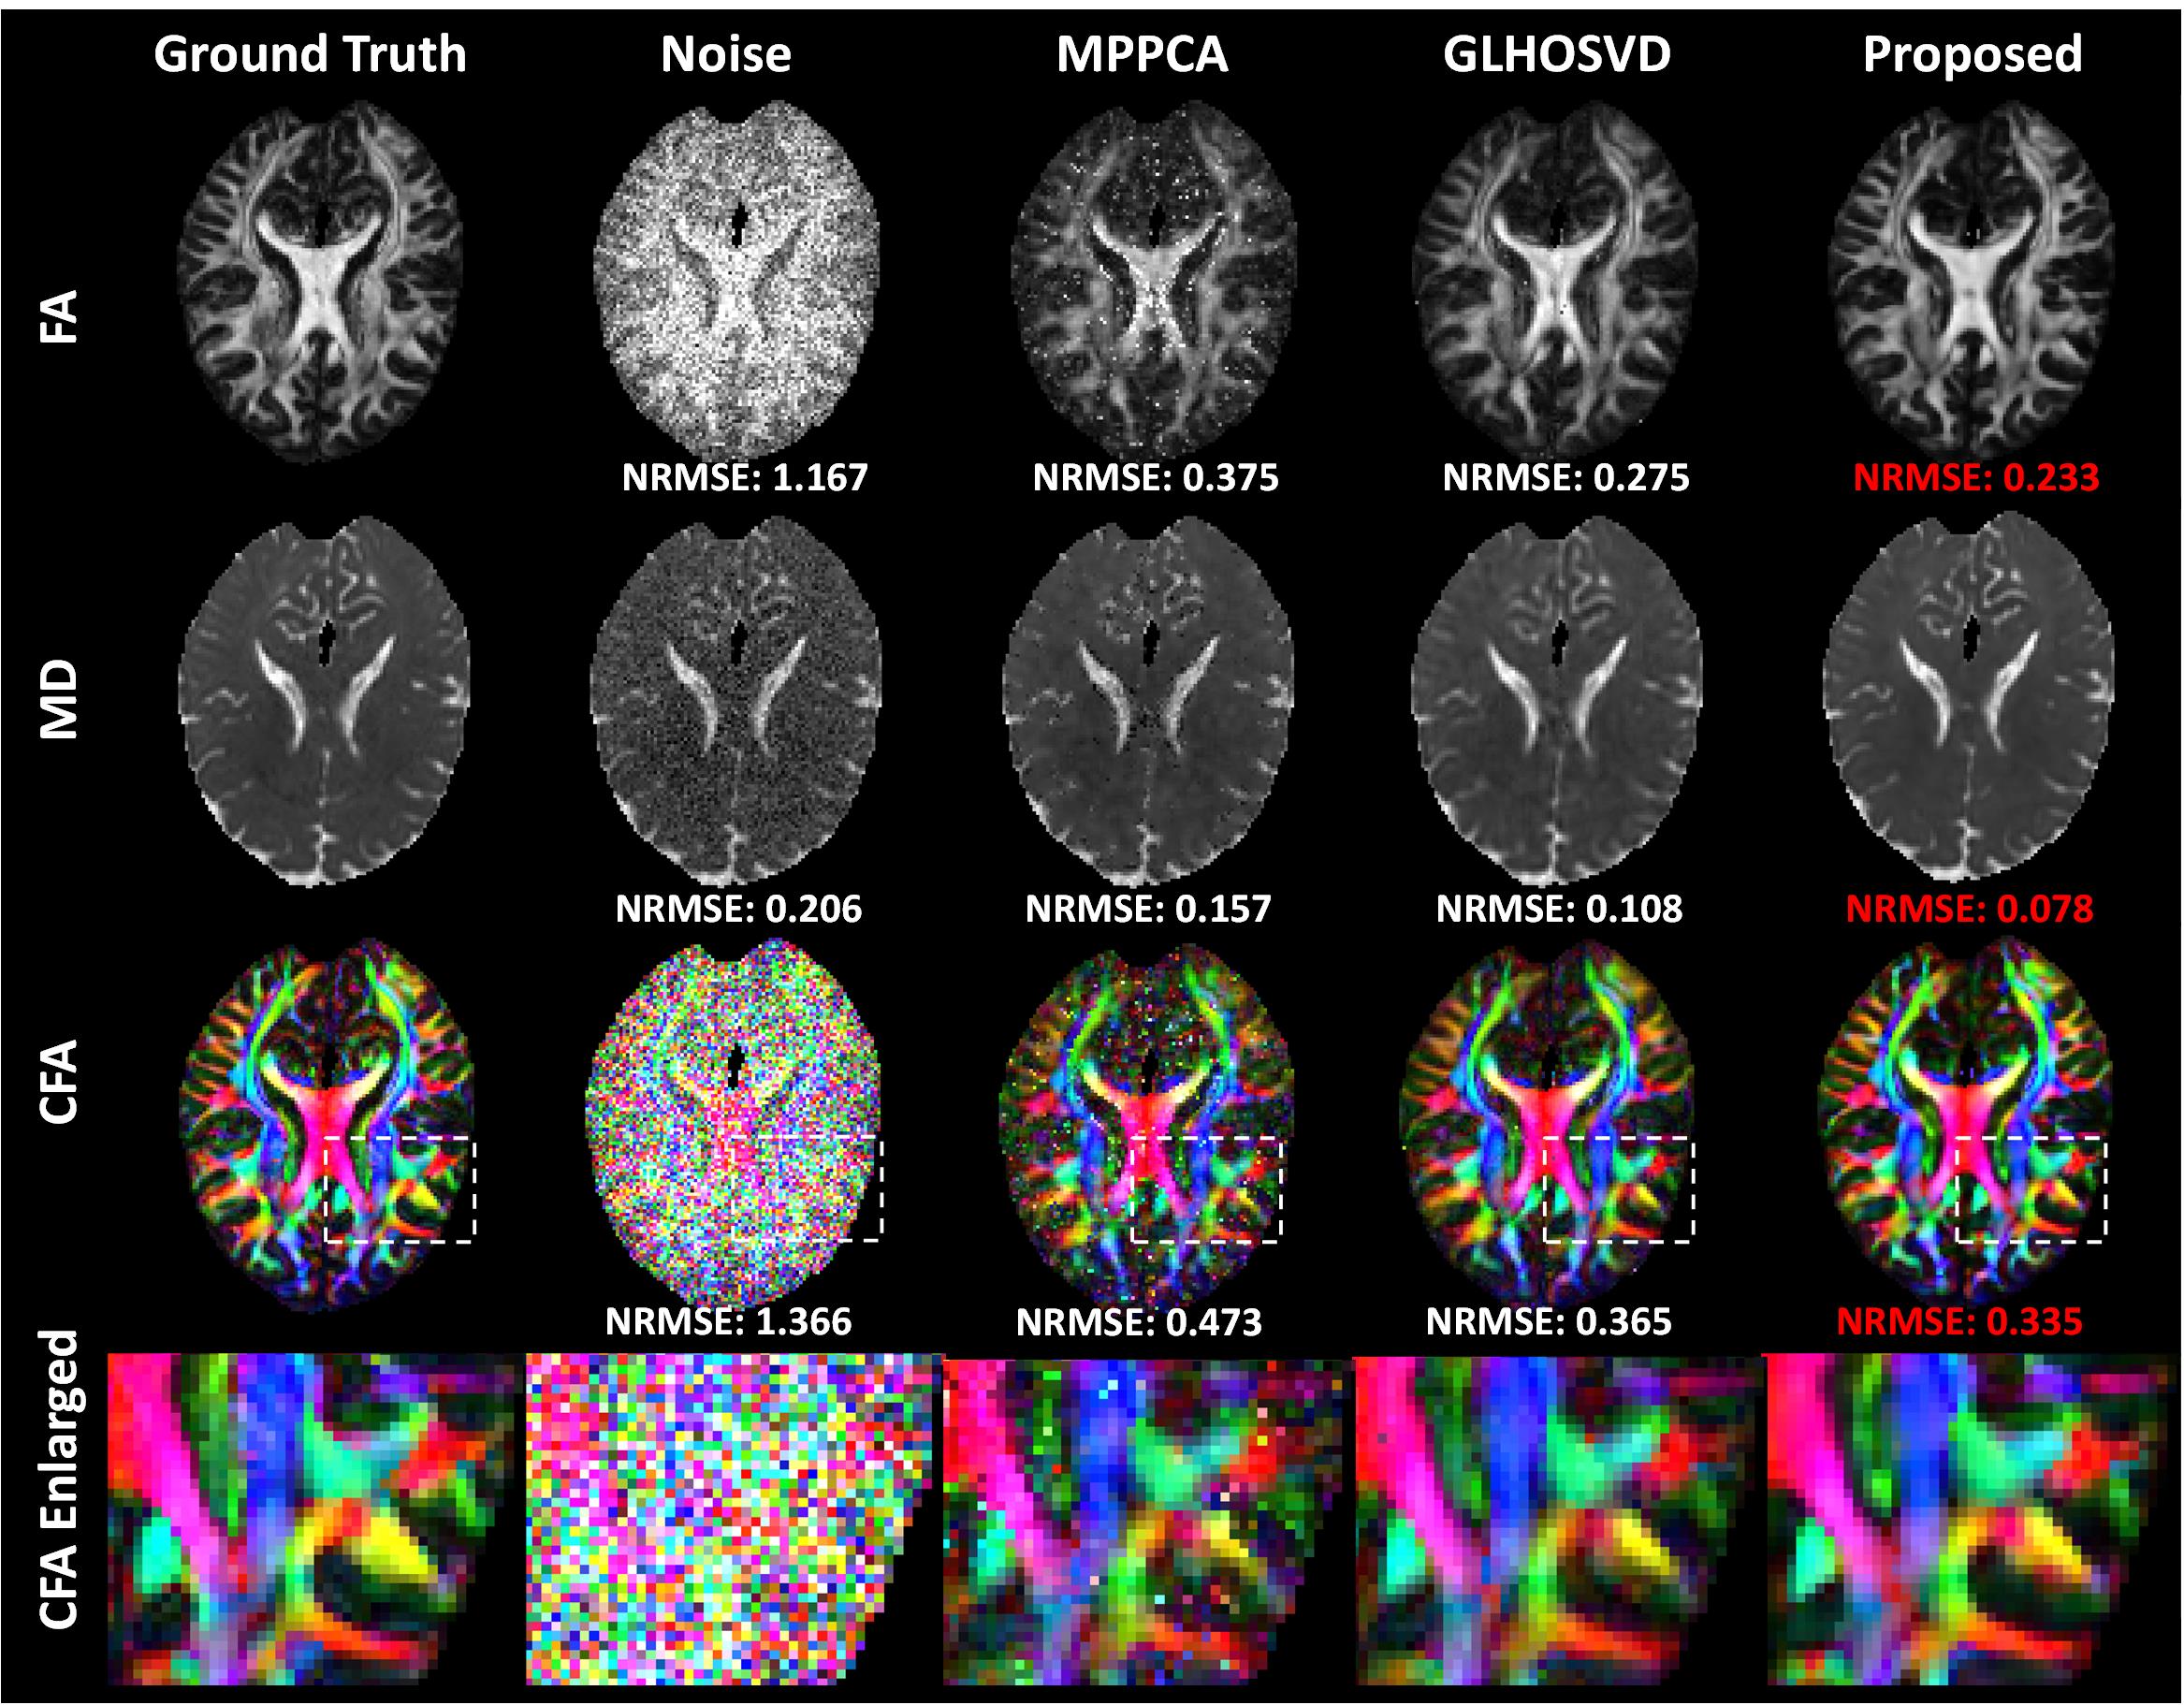
PSNR and NRMSE were calculated for evaluating the quality of image denoising and the accuracy of parameter estimation, respectively. Qualitative assessment results are shown in Figure 2. Compared with MPPCA6 and GLHOSVD7, the DTI-Unet yielded the highest PSNR and the lowest NRMSE under different SNRs. In Figure 3, the element maps of diffusion tensor field generated by our method are closest to the ground truth in visual with smallest NRMSE when compared to those by MPPCA and GLHOSVD. Figure 4 shows that the reconstructed DW images from the diffusion tensor field predicted by our method are less noisy with more details preserved, which can be clearly observed from the error map. Figure 5 shows FA, MD, and CFA maps derived with different methods. The parameter maps estimated by our method are free of outliers and recover most of detailed information with smallest NRMSEs for each parameter. The results show our method outstands in image denoising and parameter estimation.Discussion and Conclusion
Preliminary results show that the DTI-Unet trained with simulated data has high performance for both image denoising and parameter estimation. Our future work will focus on further testing and evaluating the performance of the present method: clinical data acquired from other scanners, sites or with different protocols will be included.Acknowledgements
This study was supported by the National Natural Science Foundation of China under Grant 61971214, the Natural Science Foundation of Guangdong Province under Grant 2019A1515011513, the Guangdong-Hong Kong-Macao Greater Bay Area Center for Brain Science and Brain-Inspired Intelligence Fund under Grant 2019022.References
[1] Aliotta E, Nourzadeh H, Sanders J, Muller D, Ennis DB. Highly accelerated, model-free diffusion tensor MRI reconstruction using neural networks. Med Phys 2019;46(4):1581-1591.
[2] Li Z, Gong T, Lin Z, et al. Fast and Robust Diffusion Kurtosis Parametric Mapping Using a Three-Dimensional Convolutional Neural Network. IEEE Access 2019;7:71398-71411.
[3] Tian Q, Bilgic B, Fan Q, et al. DeepDTI: High-fidelity six-direction diffusion tensor imaging using deep learning. Neuroimage 2020;219:117017.
[4] Tournier JD, Smith R, Raffelt D, et al. MRtrix3: A fast, flexible and open software framework for medical image processing and visualisation. Neuroimage 2019;202:116137.
[5] Çiçek Ö, Abdulkadir A, Lienkamp SS, Brox T, Ronneberger O. 3D U-Net: Learning Dense Volumetric Segmentation from Sparse Annotation. Medical Image Computing and Computer-Assisted Intervention – MICCAI 2016. Cham: Springer International Publishing; 2016. p. 424-432.
[6] Veraart J, Novikov DS, Christiaens D, Ades-Aron B, Sijbers J, Fieremans E. Denoising of diffusion MRI using random matrix theory. Neuroimage 2016;142:394-406.
[7] Zhang X, Peng J, Xu M, et al. Denoise diffusion-weighted images using higher-order singular value decomposition. Neuroimage 2017;156:128-145.
Figures